
Ecology 7th Edition by Manuel Molles
Edition 7ISBN: 978-0077837280Ecology 7th Edition by Manuel Molles
Edition 7ISBN: 978-0077837280 Exercise 7
In chapter 1, we reviewed the roles of questions and hypotheses in the process of science. Briefly, we considered how scientists use information to formulate questions about the natural world and convert their questions to hypotheses. A hypothesis, we said, is a possible answer to a question.
Let's use the distributions we considered in the Investigating the Evidence box in chapter 9 (p. 209) to examine the nature of scientific hypotheses in more detail. In that discussion we examined samples from three populations of plants, from which we calculated the following statistics:
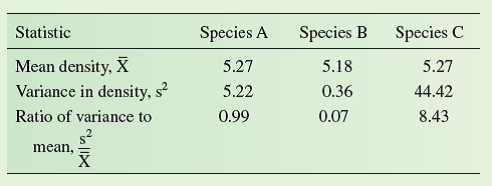

Recall that in a random distribution the ratio of the variance to the mean equals one, that is,

As we have stated repeatedly, the center of scientific investigation is the hypothesis. In the case of these three populations, an appropriate hypothesis would be that in
of observations, would exactly match the true variance to mean ratio in any of the three study populations. Because of our limited sample size, we expect to see some difference between the statistical estimate and the theoretical expectation

When using a significance level of 0.05, how often will we reject hypotheses that are actually correct For instance, how often will we reject the hypothesis that the individuals in a study population are randomly distributed when, in fact, they really are randomly distributed
Let's use the distributions we considered in the Investigating the Evidence box in chapter 9 (p. 209) to examine the nature of scientific hypotheses in more detail. In that discussion we examined samples from three populations of plants, from which we calculated the following statistics:
Recall that in a random distribution the ratio of the variance to the mean equals one, that is,
As we have stated repeatedly, the center of scientific investigation is the hypothesis. In the case of these three populations, an appropriate hypothesis would be that in
of observations, would exactly match the true variance to mean ratio in any of the three study populations. Because of our limited sample size, we expect to see some difference between the statistical estimate and the theoretical expectation
When using a significance level of 0.05, how often will we reject hypotheses that are actually correct For instance, how often will we reject the hypothesis that the individuals in a study population are randomly distributed when, in fact, they really are randomly distributed
Explanation Verified
The probability of rejecting a hypothesi...
Ecology 7th Edition by Manuel Molles
Why don’t you like this exercise?
Other Minimum 8 character and maximum 255 character
Character 255


