
Ecology 7th Edition by Manuel Molles
Edition 7ISBN: 978-0077837280Ecology 7th Edition by Manuel Molles
Edition 7ISBN: 978-0077837280 Exercise 14
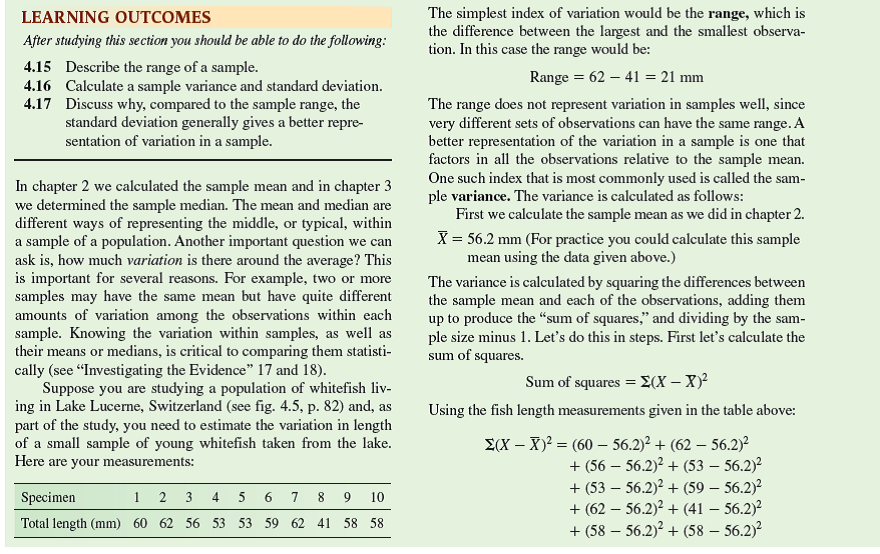
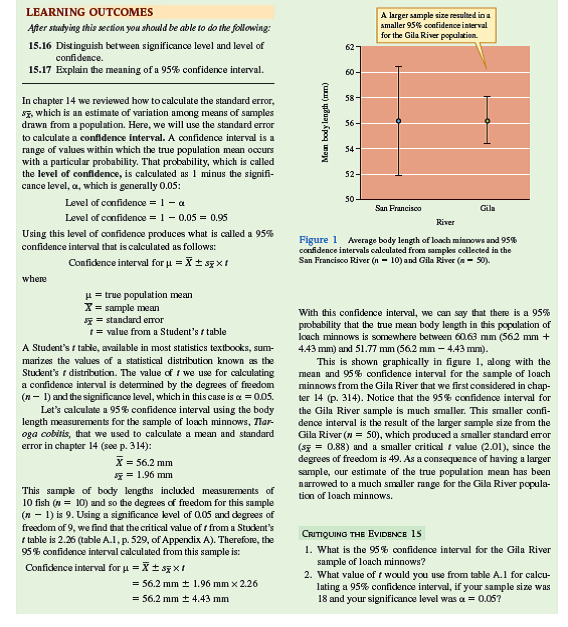
When we introduced the sample mean, we pointed out how it is an estimate of the actual, or true, population mean. A second sample from a population would probably have a different sample mean and a third sample would have yet another. How close is a given sample mean to the true population mean The answer to this question will depend on two factors: the variation within the population and the number of observations or measurements in our sample from the population. Here, we will begin to build a way of representing the precision of a given estimate of a population mean. Our first step will be to calculate a statistic called the standard error of the mean, usually called the standard error,
 . The standard error is calculated from the sample variance (see chapter 4, p. 88) and the sample size as follows:
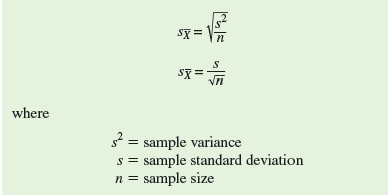
For a concrete example, let's use the body length measurements for a sample of loach minnows, Tiaroga cobitis, from a tributary of the San Francisco River in southwestern New Mexico. Suppose you are comparing the body sizes of loach minnows in populations exposed to predation by flathead catfish, an introduced species, to populations not exposed to predation by this introduced fish. To do so you need to estimate body sizes in several populations.
Your sample from the San Francisco River was:
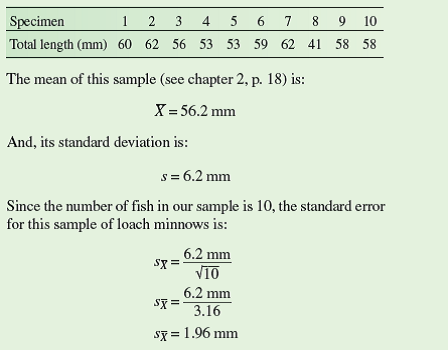
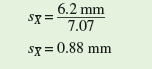
Now, let's consider the hypothetical situation in which we obtained a sample of loach minnows from another study site on the Gila River. This second sample happened to yield the same sample mean and the same standard deviation. However, instead of 10 loach minnows, this second sample included 50 loach minnows. The standard error calculated from this sample is:
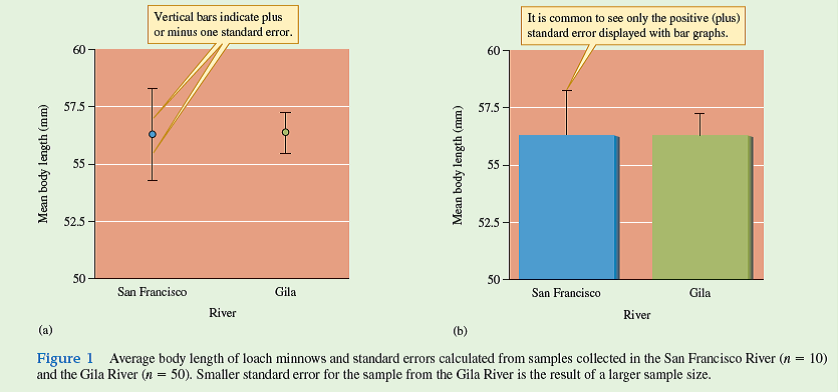
Notice that because there were more minnows in this second sample, the size of the standard error is considerably smaller. In other words, our second sample mean is a more precise estimate of the true population mean. This is shown in the form of a graph in figure 1. In figure 1 a the points indicate the sample means for our two samples and the vertical bars, above and below the points, are plus and minus one standard error. The same statistics are plotted in figure 1 b as a bar graph and only the upper standard error bar is shown, which is a common way to plot such data. In either case, the smaller standard error around the sample mean for the Gila River indicates that our estimate of the mean length of loach minnows in the population is more precise there than for the population in the San Francisco River. In Investigating the Evidence 15 (see p. 345) we will use the standard error to derive a more quantitative expression of precision called the confidence interval.
When might it be preferable to take smaller, rather than larger, samples of a population
. The standard error is calculated from the sample variance (see chapter 4, p. 88) and the sample size as follows: For a concrete example, let's use the body length measurements for a sample of loach minnows, Tiaroga cobitis, from a tributary of the San Francisco River in southwestern New Mexico. Suppose you are comparing the body sizes of loach minnows in populations exposed to predation by flathead catfish, an introduced species, to populations not exposed to predation by this introduced fish. To do so you need to estimate body sizes in several populations.
Your sample from the San Francisco River was:
Now, let's consider the hypothetical situation in which we obtained a sample of loach minnows from another study site on the Gila River. This second sample happened to yield the same sample mean and the same standard deviation. However, instead of 10 loach minnows, this second sample included 50 loach minnows. The standard error calculated from this sample is:
Notice that because there were more minnows in this second sample, the size of the standard error is considerably smaller. In other words, our second sample mean is a more precise estimate of the true population mean. This is shown in the form of a graph in figure 1. In figure 1 a the points indicate the sample means for our two samples and the vertical bars, above and below the points, are plus and minus one standard error. The same statistics are plotted in figure 1 b as a bar graph and only the upper standard error bar is shown, which is a common way to plot such data. In either case, the smaller standard error around the sample mean for the Gila River indicates that our estimate of the mean length of loach minnows in the population is more precise there than for the population in the San Francisco River. In Investigating the Evidence 15 (see p. 345) we will use the standard error to derive a more quantitative expression of precision called the confidence interval.
When might it be preferable to take smaller, rather than larger, samples of a population
Explanation Verified
In the statistical calculation, it is pr...
Ecology 7th Edition by Manuel Molles
Why don’t you like this exercise?
Other Minimum 8 character and maximum 255 character
Character 255


