
Ecology 7th Edition by Manuel Molles
Edition 7ISBN: 978-0077837280Ecology 7th Edition by Manuel Molles
Edition 7ISBN: 978-0077837280 Exercise 1
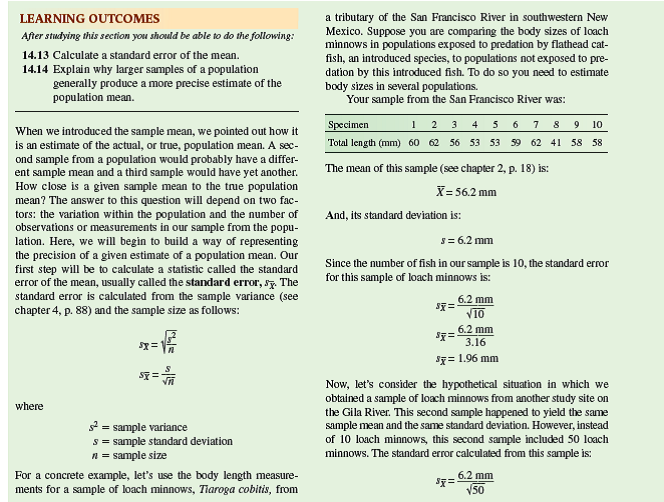
In chapter 14 we reviewed how to calculate the standard error
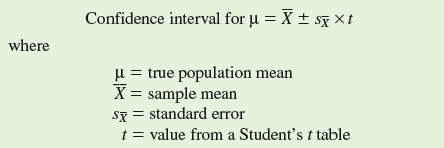
 which is an estimate of variation among means of samples drawn from a population. Here, we will use the standard error to calculate a confidence interval. A confidence interval is a range of values within which the true population mean occurs with a particular probability. That probability, which is called the level of confidence, is calculated as 1 minus the significance level, a , which is generally 0.05:
Level of confidence = 1 -
Level of confidence = 0.05 = 0.95
Using this level of confidence produces what is called a 95% confidence interval that is calculated as follows:
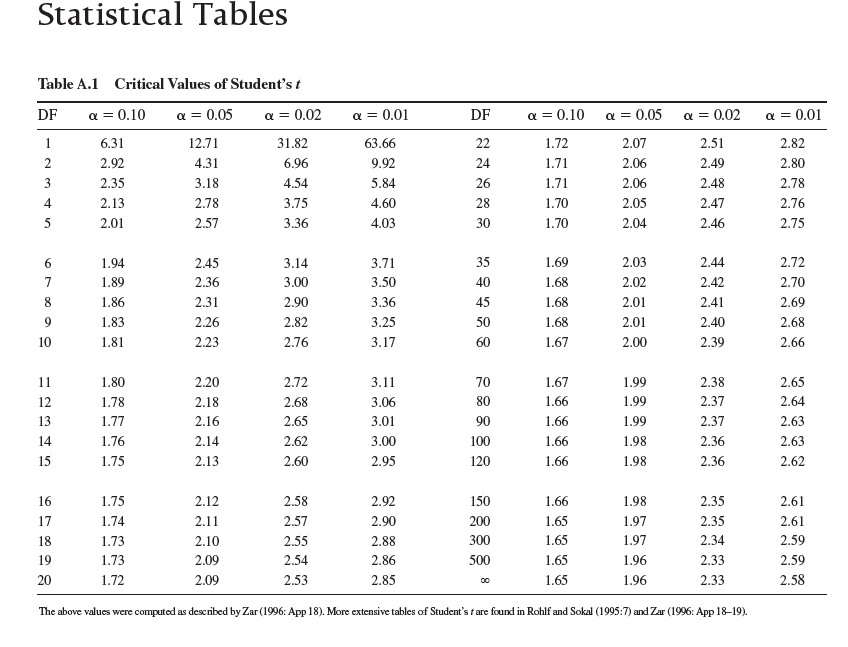
A Student's t table, available in most statistics textbooks, summarizes the values of a statistical distribution known as the Student's t distribution. The value of t we use for calculating a confidence interval is determined by the degrees of freedom ( n - 1) and the significance level, which in this case is = 0.05. Let's calculate a 95% confidence interval using the body length measurements for the sample of loach minnows, Tiaroga cobitis, that we used to calculate a mean and standard error in chapter 14 (see p. 314):
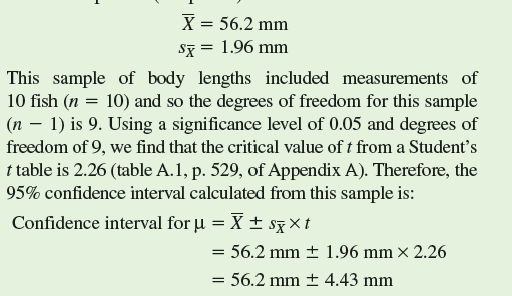
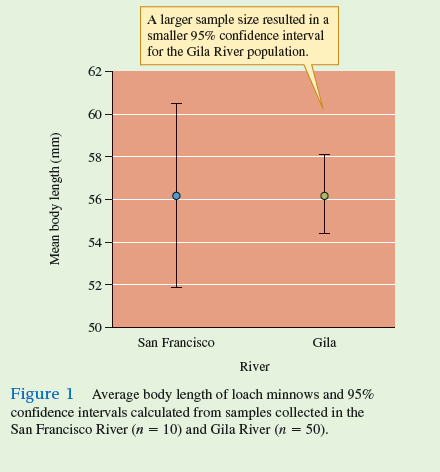
With this confidence interval, we can say that there is a 95% probability that the true mean body length in this population of loach minnows is somewhere between 60.63 mm (56.2 mm + 4.43 mm) and 51.77 mm (56.2 mm - 4.43 mm).
This is shown graphically in figure 1 , along with the mean and 95% confidence interval for the sample of loach minnows from the Gila River that we first considered in chapter 14 (p. 314). Notice that the 95% confidence interval for the Gila River sample is much smaller. This smaller confidence interval is the result of the larger sample size from the Gila River ( n = 50), which produced a smaller standard error
 and a smaller critical t value (2.01), since the degrees of freedom is 49. As a consequence of having a larger sample, our estimate of the true population mean has been narrowed to a much smaller range for the Gila River population of loach minnows.
What is the 95% confidence interval for the Gila River sample of loach minnows
which is an estimate of variation among means of samples drawn from a population. Here, we will use the standard error to calculate a confidence interval. A confidence interval is a range of values within which the true population mean occurs with a particular probability. That probability, which is called the level of confidence, is calculated as 1 minus the significance level, a , which is generally 0.05:Level of confidence = 1 -
Level of confidence = 0.05 = 0.95
Using this level of confidence produces what is called a 95% confidence interval that is calculated as follows:
A Student's t table, available in most statistics textbooks, summarizes the values of a statistical distribution known as the Student's t distribution. The value of t we use for calculating a confidence interval is determined by the degrees of freedom ( n - 1) and the significance level, which in this case is = 0.05. Let's calculate a 95% confidence interval using the body length measurements for the sample of loach minnows, Tiaroga cobitis, that we used to calculate a mean and standard error in chapter 14 (see p. 314):
With this confidence interval, we can say that there is a 95% probability that the true mean body length in this population of loach minnows is somewhere between 60.63 mm (56.2 mm + 4.43 mm) and 51.77 mm (56.2 mm - 4.43 mm).
This is shown graphically in figure 1 , along with the mean and 95% confidence interval for the sample of loach minnows from the Gila River that we first considered in chapter 14 (p. 314). Notice that the 95% confidence interval for the Gila River sample is much smaller. This smaller confidence interval is the result of the larger sample size from the Gila River ( n = 50), which produced a smaller standard error
and a smaller critical t value (2.01), since the degrees of freedom is 49. As a consequence of having a larger sample, our estimate of the true population mean has been narrowed to a much smaller range for the Gila River population of loach minnows. What is the 95% confidence interval for the Gila River sample of loach minnows
Explanation Verified
A confidence interval is a range of valu...
Ecology 7th Edition by Manuel Molles
Why don’t you like this exercise?
Other Minimum 8 character and maximum 255 character
Character 255


