
Ecology 7th Edition by Manuel Molles
Edition 7ISBN: 978-0077837280Ecology 7th Edition by Manuel Molles
Edition 7ISBN: 978-0077837280 Exercise 14
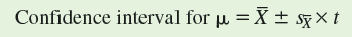
In chapter 15 we reviewed how to calculate confidence intervals for the true population mean as:

Here, we will use the confidence intervals calculated from samples of two populations to create a visual comparison of the populations.
Suppose you are studying the recovery of the food web of a mountain stream from the effects of a flood. Part of your study involves estimating the biomass of each of the consumers in the food web. One of the species you are studying is Neothremma alicia, a small species of caddisfly, an insect in the order Trichoptera, that spends its larval stage grazing on diatoms living on the tops of stones in swift mountain streams. In your study site there are two forks in a stream, one that flooded 2 months before you took your sample, and one that did not flood. Otherwise, the two forks of the stream are similar. The following are the dry weights (milligrams) of N. alicia that you collected in 0.1 m 2 quadrats in each study stream:
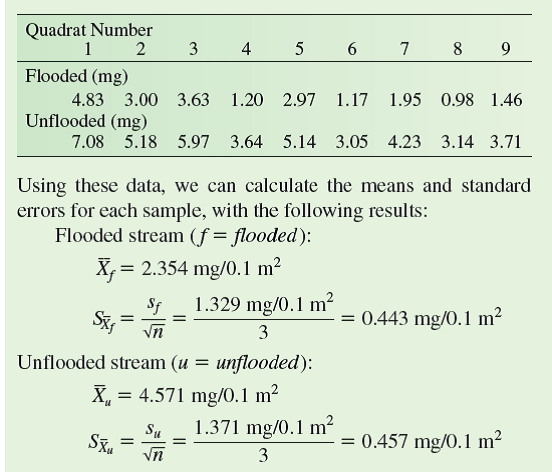
Now using our degrees of freedom ( n - 1 = 8) and a level of confidence of 0.95, we find that our critical value of Student's t is 2.31. Using this t value, we can calculate a confidence interval for each population:
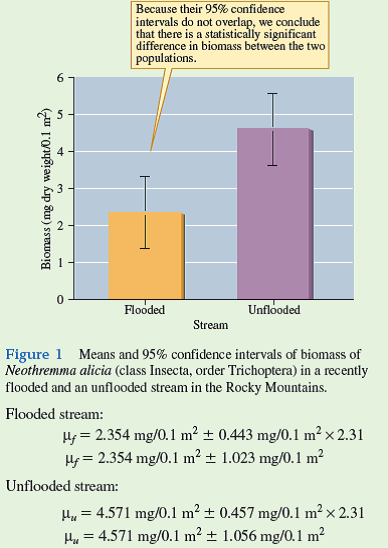
These sample means and confidence intervals are plotted in figure 1. Recall from chapter 15 (p. 345) that the true population means for each of the study populations has a 95% chance of falling somewhere within the 95% confidence intervals. Now notice that the 95% confidence intervals for the two samples do not overlap. This indicates that there is less than a 5% chance that the two samples were drawn from populations of N. alicia with the same mean biomass per unit area. In other words, we have a basis for saying that there is a statistically significant difference in biomass of N. alicia in the two study streams. In chapter 18, we will take a somewhat different approach to making a statistical comparison of these two populations (p. 406).
How would increasing the level of confidence from 0.95 to 0.99 affect the range of values included in the confidence intervals for the abundance of Neothremma Alicia in the flooded and unflooded study streams
Here, we will use the confidence intervals calculated from samples of two populations to create a visual comparison of the populations.
Suppose you are studying the recovery of the food web of a mountain stream from the effects of a flood. Part of your study involves estimating the biomass of each of the consumers in the food web. One of the species you are studying is Neothremma alicia, a small species of caddisfly, an insect in the order Trichoptera, that spends its larval stage grazing on diatoms living on the tops of stones in swift mountain streams. In your study site there are two forks in a stream, one that flooded 2 months before you took your sample, and one that did not flood. Otherwise, the two forks of the stream are similar. The following are the dry weights (milligrams) of N. alicia that you collected in 0.1 m 2 quadrats in each study stream:
Now using our degrees of freedom ( n - 1 = 8) and a level of confidence of 0.95, we find that our critical value of Student's t is 2.31. Using this t value, we can calculate a confidence interval for each population:
These sample means and confidence intervals are plotted in figure 1. Recall from chapter 15 (p. 345) that the true population means for each of the study populations has a 95% chance of falling somewhere within the 95% confidence intervals. Now notice that the 95% confidence intervals for the two samples do not overlap. This indicates that there is less than a 5% chance that the two samples were drawn from populations of N. alicia with the same mean biomass per unit area. In other words, we have a basis for saying that there is a statistically significant difference in biomass of N. alicia in the two study streams. In chapter 18, we will take a somewhat different approach to making a statistical comparison of these two populations (p. 406).
How would increasing the level of confidence from 0.95 to 0.99 affect the range of values included in the confidence intervals for the abundance of Neothremma Alicia in the flooded and unflooded study streams
Explanation Verified
The confidence intervals of two populati...
Ecology 7th Edition by Manuel Molles
Why don’t you like this exercise?
Other Minimum 8 character and maximum 255 character
Character 255


