
Ecology 7th Edition by Manuel Molles
Edition 7ISBN: 978-0077837280Ecology 7th Edition by Manuel Molles
Edition 7ISBN: 978-0077837280 Exercise 22
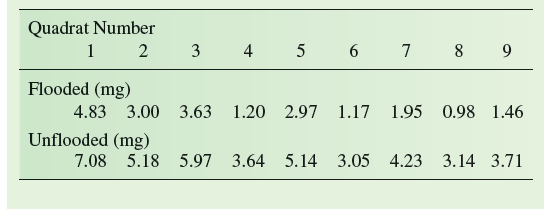
In chapter 17, we used confidence intervals to compare the biomasses of two populations of the diatom-feeding caddisfly, Neothremma alicia. That comparison indicated that the population living in a stream that had flooded recently had a lower biomass per unit area. Here, we will use the same samples of the two populations to test for significant differences using a t -test, a method for statistical comparison of two samples. The t -test involves calculating the statistic t and comparing the value with a table of critical values of t. The hypothesis is that the populations from which the samples were drawn have the same mean, and the alternative hypothesis is that the population means are different. If the calculated t statistic is less than the critical value of t, the hypothesis that the populations are not different is accepted. If the calculated t statistic is greater than the critical value of t, this hypothesis is rejected. As an example, let's use the t -test to compare our two samples of N. alicia:
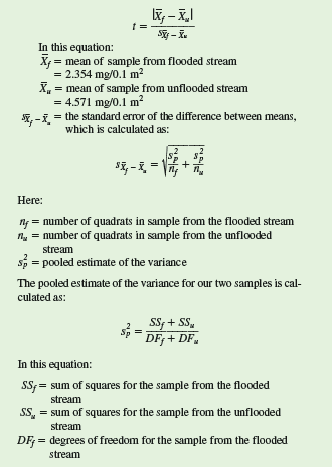
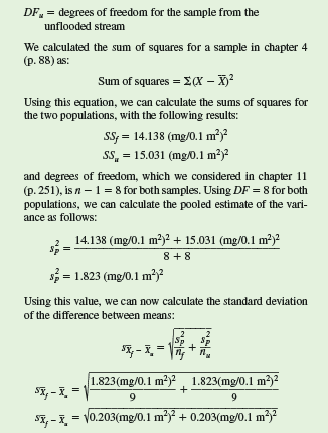
The statistic t for this comparison is calculated as:
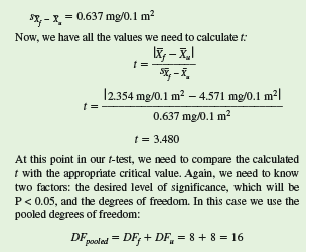
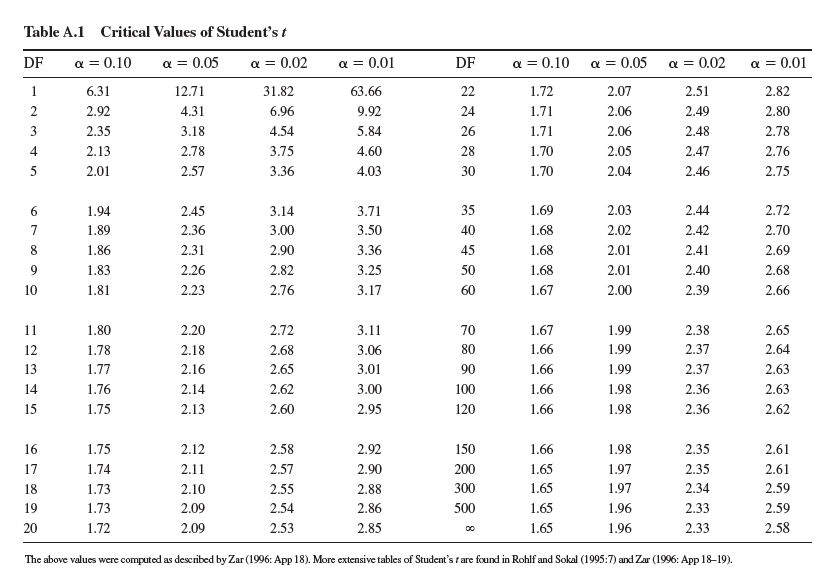
The critical value of Student's t for P 0.05 and DF = 16, is 2.12. Since our calculated value of t, 3.480, is greater than this critical value, the probability that the population means are the same is less than 0.05. Therefore, we reject the hypothesis that the mean biomass of N. alicia per unit area is the same in the two streams and accept the alternative hypothesis that the mean biomass of this caddisfly differs in the two streams.
How would the outcome of our statistical comparison of the two Neothremma alicia populations have been affected if we had chosen a level of significance of P 0.01 (see Appendix Table A.1)
The statistic t for this comparison is calculated as:
The critical value of Student's t for P 0.05 and DF = 16, is 2.12. Since our calculated value of t, 3.480, is greater than this critical value, the probability that the population means are the same is less than 0.05. Therefore, we reject the hypothesis that the mean biomass of N. alicia per unit area is the same in the two streams and accept the alternative hypothesis that the mean biomass of this caddisfly differs in the two streams.
How would the outcome of our statistical comparison of the two Neothremma alicia populations have been affected if we had chosen a level of significance of P 0.01 (see Appendix Table A.1)
Explanation Verified
The t -test is a statistical test that a...
Ecology 7th Edition by Manuel Molles
Why don’t you like this exercise?
Other Minimum 8 character and maximum 255 character
Character 255


