
Ecology 7th Edition by Manuel Molles
Edition 7ISBN: 978-0077837280Ecology 7th Edition by Manuel Molles
Edition 7ISBN: 978-0077837280 Exercise 8
In chapter 18 (p. 406) we compared samples from two populations using the t -test to judge whether there was a statistically significant difference between the populations. While the t -test is one of the most valuable tools for comparisons of pairs of samples, like any tool there are situations where it is appropriate to use a t -test and others where it is not. The t -test is based on a number of assumptions, as are other statistical tests.
One requirement of the t -test is that the populations being compared have equal variances. Another assumption of the t -test is that each of the samples is drawn from a population with a normal distribution. We first considered this assumption in chapter 3 (p. 52), when we discussed the assumptions underlying calculating the sample mean as a way of estimating the average, or typical, in a population. As we saw, the sample mean was appropriate for one population (a sample of seedling heights) but not appropriate for another (a sample of stream invertebrate densities) that we considered. A normal distribution is also assumed for calculating 95% confidence intervals (p. 345) and for regression analysis (p. 188).
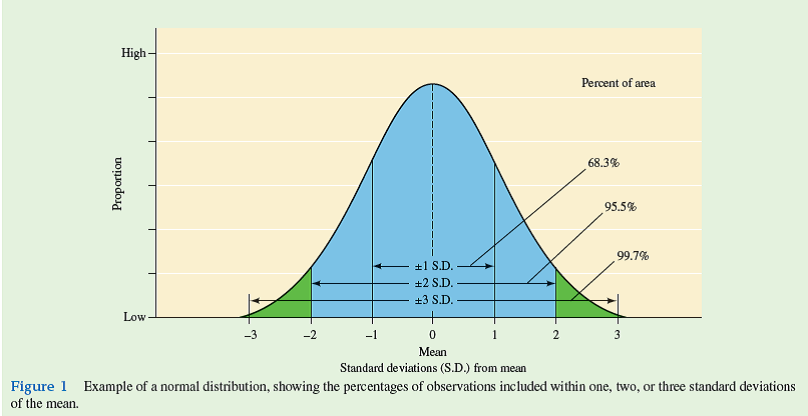
Let's consider the assumption of a normal distribution in a bit more detail. A normal distribution has a particular shape. As shown in figure 1 , a normal distribution is bell-shaped and proportioned in such a way that predictable percentages of the observations, or measurements, will fall within one, two, or three standard deviations of the mean (see chapter 4, p. 88). If the characteristic of interest is not normally distributed, then we cannot be certain, for instance, that a 95% confidence interval will be accurate or that two sample means compared using a t -test are statistically different. Fortunately, many of the kinds of measurements made by ecologists, such as weights of individuals, body lengths or lengths of appendages, running speeds, or rates of photosynthesis, have normal distributions. In addition, the fit of measurements to a normal distribution does not have to be exact. For example, the t -test will produce reliable results if the distribution of measurements is fairly symmetrical around the mean. Also, the t -test can give reliable results with some differences in variances, as long as the sizes of samples being compared are similar.
However, there are some important attributes of ecological systems that are not distributed normally. These include population densities (numbers per unit area) of plants or
animals, proportions of different species in a community, percentage of time that an animal spends in different activities, and exponential rates of litter decay. One way to analyze such data is to use statistical methods that do not assume a normal distribution. We entered this area in chapter 3 (p. 52) where we discussed the sample median. We will explore this area further in chapters 20 tO₂2.
Suppose you sample two populations for a characteristic that has a normal distribution in both populations but is much more variable in one of the populations compared to the other. In general, would it be appropriate to test for statistical differences in the characteristic in the two populations using a t -test
One requirement of the t -test is that the populations being compared have equal variances. Another assumption of the t -test is that each of the samples is drawn from a population with a normal distribution. We first considered this assumption in chapter 3 (p. 52), when we discussed the assumptions underlying calculating the sample mean as a way of estimating the average, or typical, in a population. As we saw, the sample mean was appropriate for one population (a sample of seedling heights) but not appropriate for another (a sample of stream invertebrate densities) that we considered. A normal distribution is also assumed for calculating 95% confidence intervals (p. 345) and for regression analysis (p. 188).
Let's consider the assumption of a normal distribution in a bit more detail. A normal distribution has a particular shape. As shown in figure 1 , a normal distribution is bell-shaped and proportioned in such a way that predictable percentages of the observations, or measurements, will fall within one, two, or three standard deviations of the mean (see chapter 4, p. 88). If the characteristic of interest is not normally distributed, then we cannot be certain, for instance, that a 95% confidence interval will be accurate or that two sample means compared using a t -test are statistically different. Fortunately, many of the kinds of measurements made by ecologists, such as weights of individuals, body lengths or lengths of appendages, running speeds, or rates of photosynthesis, have normal distributions. In addition, the fit of measurements to a normal distribution does not have to be exact. For example, the t -test will produce reliable results if the distribution of measurements is fairly symmetrical around the mean. Also, the t -test can give reliable results with some differences in variances, as long as the sizes of samples being compared are similar.
However, there are some important attributes of ecological systems that are not distributed normally. These include population densities (numbers per unit area) of plants or
animals, proportions of different species in a community, percentage of time that an animal spends in different activities, and exponential rates of litter decay. One way to analyze such data is to use statistical methods that do not assume a normal distribution. We entered this area in chapter 3 (p. 52) where we discussed the sample median. We will explore this area further in chapters 20 tO₂2.
Suppose you sample two populations for a characteristic that has a normal distribution in both populations but is much more variable in one of the populations compared to the other. In general, would it be appropriate to test for statistical differences in the characteristic in the two populations using a t -test
Explanation Verified
The t -test is a statistical test that a...
Ecology 7th Edition by Manuel Molles
Why don’t you like this exercise?
Other Minimum 8 character and maximum 255 character
Character 255


