Environmental Science 12th Edition by William Cunningham,Mary Ann Cunningham
Edition 12ISBN: 978-0077431204Environmental Science 12th Edition by William Cunningham,Mary Ann Cunningham
Edition 12ISBN: 978-0077431204 Exercise 18
The National Agricultural Statistics Service (NASS) keeps records of pesticide use in the United States, and you can access those records by going to www.pestmanagement.info \nass \app_usage.cfm. This data source is incomplete and not up to date, but it is the only public monitoring source for chemicals whose use is rapidly increasing, expanding, and diversifying worldwide and in the United States. Both environmental and economic impacts of these uses are substantial. Visit the NASS site, and observe how many pesticides are listed. Monitoring the environmental and health effects of this many compounds is clearly a challenge, but this diversity helps growers respond to the "pesticide treadmill" effect. Refer to your readings to recall what the term pesticide treadmill means.
Then look at some of the crops on which growers use the dominant pesticides glyphosate, atrazine, alachlor, or 2,4-D (for reference, see fig. 10.18). You can experiment with graphing and mapping, as well as tabular reports on uses of these pesticides.
You can download and analyze these data yourself, but to make it easier we have provided an Excel file with a set of this data that is organized for easy graphing (below graph). Acquire this file by going to www.mhhe.com \cunningham12e. Find material for Chapter 10 to locate and download the Data Analysis Excel file. The file contains directions for graphing different crops on which Glyphosate ("Roundup"), the most abundantly used herbicide in the United States, is applied.
Graph data for the different crops, as described in the file, and answer the questions below.
Crops are sorted roughly according to the amount produced in the United States each year. In general, is more glyphosate used on the most abundant crops or the least abundant crops
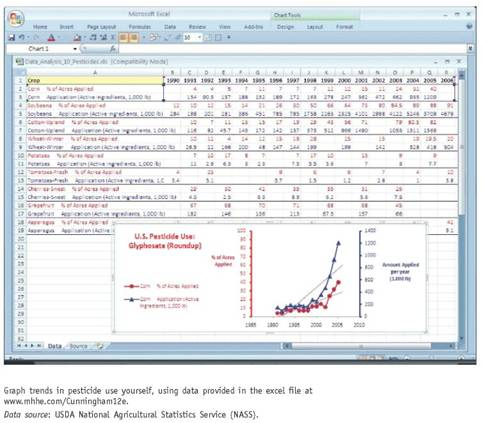
FIGURE 10.18 Usage of the top five pesticides in the United States. All are herbicides applied to soy, corn, or wheat, or to lawns, except metam sodium, a soil fumigant used mainly on ground crops such as carrots, potatoes, peppers, and strawberries. Source: USDA, 2009.

Then look at some of the crops on which growers use the dominant pesticides glyphosate, atrazine, alachlor, or 2,4-D (for reference, see fig. 10.18). You can experiment with graphing and mapping, as well as tabular reports on uses of these pesticides.
You can download and analyze these data yourself, but to make it easier we have provided an Excel file with a set of this data that is organized for easy graphing (below graph). Acquire this file by going to www.mhhe.com \cunningham12e. Find material for Chapter 10 to locate and download the Data Analysis Excel file. The file contains directions for graphing different crops on which Glyphosate ("Roundup"), the most abundantly used herbicide in the United States, is applied.
Graph data for the different crops, as described in the file, and answer the questions below.
Crops are sorted roughly according to the amount produced in the United States each year. In general, is more glyphosate used on the most abundant crops or the least abundant crops
FIGURE 10.18 Usage of the top five pesticides in the United States. All are herbicides applied to soy, corn, or wheat, or to lawns, except metam sodium, a soil fumigant used mainly on ground crops such as carrots, potatoes, peppers, and strawberries. Source: USDA, 2009.
Explanation Verified
More glyphosate is u...
Environmental Science 12th Edition by William Cunningham,Mary Ann Cunningham
Why don’t you like this exercise?
Other Minimum 8 character and maximum 255 character
Character 255


