Environmental Science 12th Edition by William Cunningham,Mary Ann Cunningham
Edition 12ISBN: 978-0077431204Environmental Science 12th Edition by William Cunningham,Mary Ann Cunningham
Edition 12ISBN: 978-0077431204 Exercise 10
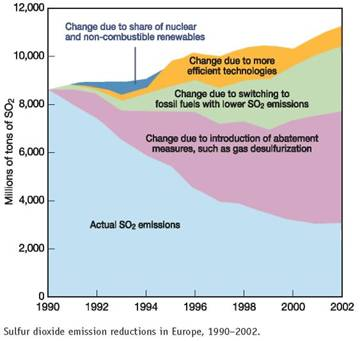
Reduction of acid-forming air pollutants in Europe is an inspiring success story. The first evidence of ecological damage from acid rain came from disappearance of fish from Scandinavian lakes and rivers in the 1960s. By the 1970s, evidence of air pollution damage to forests in northern and central Europe alarmed many people. International agreements reached since the mid-1980s have been highly successful in reducing emissions of SO₂ and NO x as well as photochemical oxidants, such as O 3. The graph on this page shows reductions in SO₂ emissions in Europe between 1990 and 2002. The light blue area shows actual SO₂ emissions. Blue represents changes due to increased nuclear and renewable energy. Orange shows reductionsdue to energy conservation. Green shows improvement from switching to low-sulfur fuels. Purple shows declines due to increased abatement measures (flue gas scrubbers). The upper boundary of each area indicates what emissions would have been without pollution control.
How much have actual SO₂ emissions declined since 1990
How much have actual SO₂ emissions declined since 1990
Explanation Verified
Air pollution is an unwanted change in t...
Environmental Science 12th Edition by William Cunningham,Mary Ann Cunningham
Why don’t you like this exercise?
Other Minimum 8 character and maximum 255 character
Character 255


