
Introductory Econometrics 4th Edition by Jeffrey Wooldridge
Edition 4ISBN: 978-0324660609Introductory Econometrics 4th Edition by Jeffrey Wooldridge
Edition 4ISBN: 978-0324660609 Exercise 9
The new management at a bakery claims that workers are now more productive than they were under old management, which is why wages have "generally increased." Let Wi b be Worker i's wage under the old management and let Wi a be Worker i's wage after the change. The difference is D i = W i a - W i b. Assume that the D i are a random sample from a Normal( , 2 ) distribution.
(i) Using the following data on 15 workers, construct an exact 95% confidence interval for .
(ii) Formally state the null hypothesis that there has been no change in average wages. In particular, what is E(D i ) under H 0 If you are hired to examine the validity of the new management's claim, what is the relevant alternative hypothesis in terms of =E(D i )
(iii)Test the null hypothesis from part (ii) against the stated alternative at the 5% and 1% levels.
(iv) Obtain the p-value for the test in part (iii).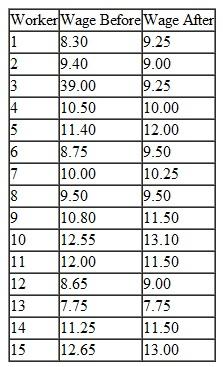
Explanation Verified
Consider the following table shows the w...
Introductory Econometrics 4th Edition by Jeffrey Wooldridge
Why don’t you like this exercise?
Other Minimum 8 character and maximum 255 character
Character 255


