
Introductory Econometrics 4th Edition by Jeffrey Wooldridge
Edition 4ISBN: 978-0324660609Introductory Econometrics 4th Edition by Jeffrey Wooldridge
Edition 4ISBN: 978-0324660609 Exercise 14
The following table contains the ACT scores and the GPA (grade point average) for eight college students. Grade point average is based on a four-point scale and has been rounded to one digit after the decimal. 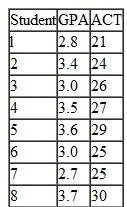 (i) Estimate the relationship between GPA and ACT using OLS; that is, obtain the intercept and slope estimates in the equation
Comment on the direction of the relationship. Does the intercept have a useful interpretation here Explain. How much higher is the GPA predicted to be if the ACT score is increased by five points
(ii) Compute the fitted values and residuals for each observation, and verify that the residuals\ (approximately) sum to zero.
(iii) What is the predicted value of GPA when ACT = 20
(iv) How much of the variation in GPA for these eight students is explained by ACT Explain.
(i) Estimate the relationship between GPA and ACT using OLS; that is, obtain the intercept and slope estimates in the equation Comment on the direction of the relationship. Does the intercept have a useful interpretation here Explain. How much higher is the GPA predicted to be if the ACT score is increased by five points
(ii) Compute the fitted values and residuals for each observation, and verify that the residuals\ (approximately) sum to zero.
(iii) What is the predicted value of GPA when ACT = 20
(iv) How much of the variation in GPA for these eight students is explained by ACT Explain.
Explanation Verified
To estimate the relationship between ACT...
Introductory Econometrics 4th Edition by Jeffrey Wooldridge
Why don’t you like this exercise?
Other Minimum 8 character and maximum 255 character
Character 255


