
Introductory Econometrics 4th Edition by Jeffrey Wooldridge
Edition 4ISBN: 978-0324660609Introductory Econometrics 4th Edition by Jeffrey Wooldridge
Edition 4ISBN: 978-0324660609 Exercise 3
There has been much interest in whether the presence of 401(k) pension plans, available to many U.S. workers, increases net savings. The data set 401KSUBS.RAW contains information on net financial assets (nettfa), family income (inc), a binary variable for eligibility in a 401(k) plan (e401k), and several other variables.
(i) What fraction of the families in the sample are eligible for participation in a 401(k) plan
(ii) Estimate a linear probability model explaining 401(k) eligibility in terms of income, age, and gender. Include income and age in quadratic form, and report the results in the usual form.
(iii) Would you say that 401(k) eligibility is independent of income and age What about gender Explain.
(iv) Obtain the fitted values from the linear probability model estimated in part (ii). Are any fitted values negative or greater than one
(v) Using the fitted values from part (iv), define
 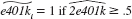 and
and 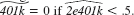 Out of 9,275 families, how many are predicted to be eligible for a 401(k) plan
(vi) For the 5,638 families not eligible for a 401(k), what percentage of these are predicted not to have a 401(k), using the predictor For the 3,637 families eligible for a 401(k) plan, what percentage are predicted to have one (It is helpful if your econometrics package has a "tabulate" command.)
(vii) The overall percent correctly predicted is about 64.9%. Do you think this is a complete description of how well the model does, given your answers in part (vi)
(viii) Add the variable pira as an explanatory variable to the linear probability model. Other things equal, if a family has someone with an individual retirement account, how much higher is the estimated probability that the family is eligible for a 401(k) plan Is it statistically different from zero at the 10% level
(i) What fraction of the families in the sample are eligible for participation in a 401(k) plan
(ii) Estimate a linear probability model explaining 401(k) eligibility in terms of income, age, and gender. Include income and age in quadratic form, and report the results in the usual form.
(iii) Would you say that 401(k) eligibility is independent of income and age What about gender Explain.
(iv) Obtain the fitted values from the linear probability model estimated in part (ii). Are any fitted values negative or greater than one
(v) Using the fitted values
from part (iv), define and Out of 9,275 families, how many are predicted to be eligible for a 401(k) plan (vi) For the 5,638 families not eligible for a 401(k), what percentage of these are predicted not to have a 401(k), using the predictor
For the 3,637 families eligible for a 401(k) plan, what percentage are predicted to have one (It is helpful if your econometrics package has a "tabulate" command.)(vii) The overall percent correctly predicted is about 64.9%. Do you think this is a complete description of how well the model does, given your answers in part (vi)
(viii) Add the variable pira as an explanatory variable to the linear probability model. Other things equal, if a family has someone with an individual retirement account, how much higher is the estimated probability that the family is eligible for a 401(k) plan Is it statistically different from zero at the 10% level
Explanation

This question doesn’t have an expert verified answer yet, let Quizplus AI Copilot help.
Introductory Econometrics 4th Edition by Jeffrey Wooldridge
Why don’t you like this exercise?
Other Minimum 8 character and maximum 255 character
Character 255


