
Introductory Econometrics 4th Edition by Jeffrey Wooldridge
Edition 4ISBN: 978-0324660609Introductory Econometrics 4th Edition by Jeffrey Wooldridge
Edition 4ISBN: 978-0324660609 Exercise 2
Let math10 denote the percentage of students at a Michigan high school receiving a passing score on a standardized math test (see also Example). We are interested in estimating the effect of per student spending on math performance. A simple model is
math10 = 0 + 1 log(expend) + 2 log(enroll)+ 3 poverty + u,
where poverty is the percentage of students living in poverty.
(i) The variable lnchprg is the percentage of students eligible for the federally funded school lunch program. Why is this a sensible proxy variable for poverty
(ii) The table that follows contains OLS estimates, with and without lnchprg as an explanatory variable.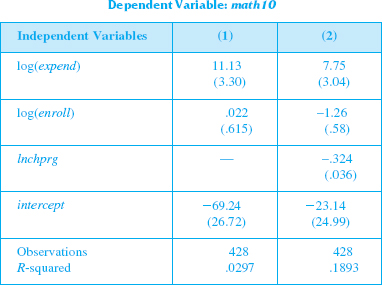
Explain why the effect of expenditures on math10 is lower in column (2) than in column (1). Is the effect in column (2) still statistically greater than zero
(iii) Does it appear that pass rates are lower at larger schools, other factors being equal Explain.
(iv) Interpret the coefficient on lnchprg in column (2).
(v) What do you make of the substantial increase in R 2 from column (1) to column (2)
Explanation Verified
Consider the model, the result of which ...
Introductory Econometrics 4th Edition by Jeffrey Wooldridge
Why don’t you like this exercise?
Other Minimum 8 character and maximum 255 character
Character 255


