
Introductory Econometrics 4th Edition by Jeffrey Wooldridge
Edition 4ISBN: 978-0324660609Introductory Econometrics 4th Edition by Jeffrey Wooldridge
Edition 4ISBN: 978-0324660609 Exercise 17
The file MATHPNL.RAW contains panel data on school districts in Michigan for the years 1992 through 1998. It is the district-level analogue of the school-level data used by Papke (2005). The response variable of interest in this question is math4, the percentage of fourth graders in a district receiving a passing score on a standardized math test. The key explanatory variable is rexpp, which is real expenditures per pupil in the district. The amounts are in 1997 dollars. The spending variable will appear in logarithmic form.
(i) Consider the static unobserved effects model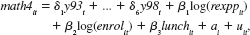
where enrolit is total district enrollment and lunchit is the percentage of stu¬dents in the district eligible for the school lunch program. (So lunchit is a pretty good measure of the district-wide poverty rate.) Argue that ft/10 is the percentage point change in math4it when real per-student spending increases by roughly 10%.
(ii) Use first differencing to estimate the model in part (i). The simplest approach is to allow an intercept in the first-differenced equation and to include dummy variables for the years 1994 through 1998. Interpret the coefficient on the spend¬ing variable.
(iii) Now, add one lag of the spending variable to the model and reestimate using first differencing. Note that you lose another year of data, so you are only using changes starting in 1994. Discuss the coefficients and significance on the current and lagged spending variables.
(iv) Obtain heteroskedasticity-robust standard errors for the first-differenced regres¬sion in part (iii). How do these standard errors compare with those from part (iii) for the spending variables
(v) Now, obtain standard errors robust to both heteroskedasticity and serial correla¬tion. What does this do to the significance of the lagged spending variable
(vi) Verify that the differenced errors rit = Auit have negative serial correlation by carrying out a test of AR(1) serial correlation.
(vii) Based on a fully robust joint test, does it appear necessary to include the enroll¬ment and lunch variables in the model
Explanation Verified
(i)
Given the unobserved effects model i...
Introductory Econometrics 4th Edition by Jeffrey Wooldridge
Why don’t you like this exercise?
Other Minimum 8 character and maximum 255 character
Character 255


