
Campbell Biology 11th Edition by Lisa Urry,Michael Cain,Steven Wasserman,Peter Minorsky,Jane Reece
Edition 11ISBN: 978-0134093413Campbell Biology 11th Edition by Lisa Urry,Michael Cain,Steven Wasserman,Peter Minorsky,Jane Reece
Edition 11ISBN: 978-0134093413 Exercise 10
What Is the Distribution of Phenotypes Among Offspring of Two Parents Who Are Both Heterozygous for Three Additive Genes Human skin color is a polygenic trait that is determined by the additive effects of several different genes. In this exercise, you will work with a simplified model of skin-color genetics where three genes are assumed to affect the darkness of skin color and where each gene has two alleles-dark or light. In this model, each dark allele contributes equally to the darkness of skin color, and each pair of alleles segregates independently of each other pair. Using a type of graph called a histogram, you will determine the distribution of phenotypes of offspring with different numbers of dark-skin alleles. (For additional information about graphs, see the Scientific Skills Review in Appendix F and in the Study Area in MasteringBiology.)
How This Model Is Analyzed To predict the phenotypes of the offspring of heterozygous parents, the ratios of the genes for this trait must be calculated. Figure 11.13 shows a simplified model for polygenic inheritance of skin color that includes three of the known genes. According to this model, three separately inherited genesaffect the darkness of skin. The heterozygous individuals ( AaBbCc ) represented by the two rectangles at the top of this figure each carry three dark-skin alleles (black circles, which represent A , B , or C ) and three light-skin alleles (white circles, which represent a , b , or c ). The Punnett square shows all the possible genetic combinations in gametes and in offspring of a large number of hypothetical matings between these heterozygotes.
Predictions from the Punnett Square If we assume that each square in the Punnett square represents one offspring of the heterozygous AaBbCc parents, then the squares below show the possible phenotypes. Below the squares are the predicted frequencies of individuals with the same number of dark-skin alleles.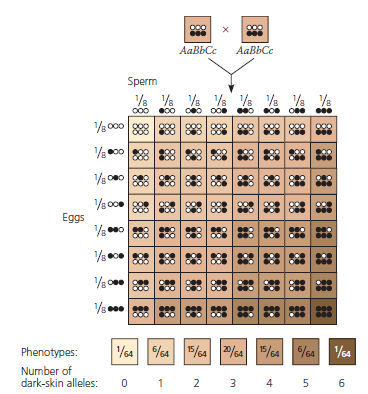
You can see that the skin-color phenotypes are not distributed uniformly. (a) Which phenotype has the highest frequency Draw a vertical dotted line through that bar. (b) Distributions of values like this one tend to show one of several common patterns. Sketch a rough curve that approximates the values and look at its shape. Is it symmetrically distributed around a central peak value (a "normal distribution," sometimes called a bell curve); is it skewed to one end of the x -axis or the other (a "skewed distribution"); or does it show two apparent groups of frequencies (a "bimodal distribution") Explain the reason for the curve's shape. (It will help to read the text description that supports Figure 11.13.)
Explanation Verified
a.
The observable traits of organisms ar...
Campbell Biology 11th Edition by Lisa Urry,Michael Cain,Steven Wasserman,Peter Minorsky,Jane Reece
Why don’t you like this exercise?
Other Minimum 8 character and maximum 255 character
Character 255


