
Campbell Biology 11th Edition by Lisa Urry,Michael Cain,Steven Wasserman,Peter Minorsky,Jane Reece
Edition 11ISBN: 978-0134093413Campbell Biology 11th Edition by Lisa Urry,Michael Cain,Steven Wasserman,Peter Minorsky,Jane Reece
Edition 11ISBN: 978-0134093413 Exercise 7
How Have Amino Acid Sequences of Human Globin Genes Diverged During Their Evolution To build a model of the evolutionary history of the globin genes (see Figure 18.13), researchers compared the amino acid sequences of the polypeptides they encode. In this exercise, you will analyze comparisons of the amino acid sequences of globin polypeptides to shed light on their evolutionary relationships. 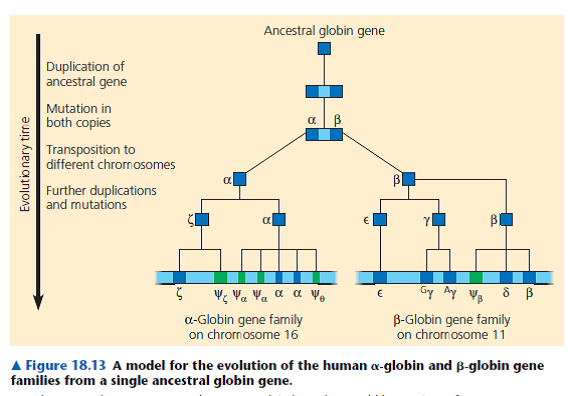
How the Experiment Was Done Scientists obtained the DNA sequences for each of the eight globin genes and "translated" them into amino acid sequences. They then used a computer program to align the sequences (with dashes indicating gaps in one sequence) and calculate a percent identity value for each pair of globins. The percent identity reflects the number of positions with identical amino acids relative to the total number of amino acids in a globin polypeptide. The data were arranged in a table to show the pairwise comparisons.
Data from the Experiment The following table shows an example of a pairwise alignment-that of the 1-globin (alpha-1 globin) and -globin (zeta globin) amino acid sequences-using the standard single-letter codes for amino acids. To the left of each line of amino acid sequence is the number of the first amino acid in that line. The percent identity value for the 1- and -globin amino acid sequences was calculated by counting the number of matching amino acids (86, highlighted in yellow), dividing by the total number of amino acid positions (143), and then multiplying by 100. This resulted in a 60% identity value for the 1- pair, as shown in the amino acid identity table at the bottom of the page. The values for other globin pairs were calculated in the same way.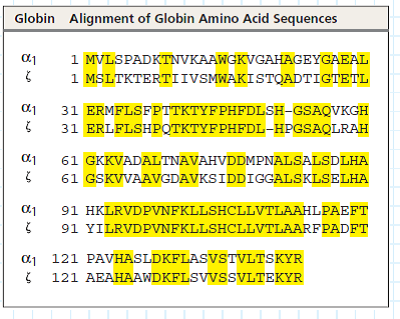
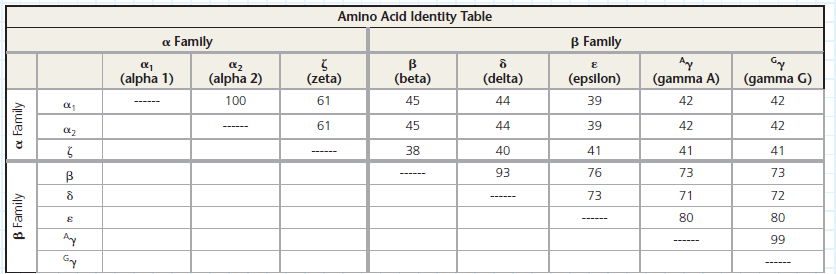
Make a list of all the percent identity values from the table, starting with 100% at the top. Next to each number write the globin pair(s) with that percent identity value. Use one color for the globins from the family and a different color for the globins from the family. (a) Compare the order of pairs on your list with their positions in the model shown in Figure 18.13. Does the order of pairs describe the same relative "closeness" of globin family members seen in the model (b) Compare the percent identity values for pairs within the or group to the values for between-group pairs.
How the Experiment Was Done Scientists obtained the DNA sequences for each of the eight globin genes and "translated" them into amino acid sequences. They then used a computer program to align the sequences (with dashes indicating gaps in one sequence) and calculate a percent identity value for each pair of globins. The percent identity reflects the number of positions with identical amino acids relative to the total number of amino acids in a globin polypeptide. The data were arranged in a table to show the pairwise comparisons.
Data from the Experiment The following table shows an example of a pairwise alignment-that of the 1-globin (alpha-1 globin) and -globin (zeta globin) amino acid sequences-using the standard single-letter codes for amino acids. To the left of each line of amino acid sequence is the number of the first amino acid in that line. The percent identity value for the 1- and -globin amino acid sequences was calculated by counting the number of matching amino acids (86, highlighted in yellow), dividing by the total number of amino acid positions (143), and then multiplying by 100. This resulted in a 60% identity value for the 1- pair, as shown in the amino acid identity table at the bottom of the page. The values for other globin pairs were calculated in the same way.
Make a list of all the percent identity values from the table, starting with 100% at the top. Next to each number write the globin pair(s) with that percent identity value. Use one color for the globins from the family and a different color for the globins from the family. (a) Compare the order of pairs on your list with their positions in the model shown in Figure 18.13. Does the order of pairs describe the same relative "closeness" of globin family members seen in the model (b) Compare the percent identity values for pairs within the or group to the values for between-group pairs.
Explanation Verified
In the given case, there are (alpha) and...
Campbell Biology 11th Edition by Lisa Urry,Michael Cain,Steven Wasserman,Peter Minorsky,Jane Reece
Why don’t you like this exercise?
Other Minimum 8 character and maximum 255 character
Character 255


