
Essentials of Business Analytics 1st Edition by Jeffrey Camm,James Cochran,Michael Fry,Jeffrey Ohlmann ,David Anderson
Edition 1ISBN: 978-1285187273Essentials of Business Analytics 1st Edition by Jeffrey Camm,James Cochran,Michael Fry,Jeffrey Ohlmann ,David Anderson
Edition 1ISBN: 978-1285187273 Exercise 6
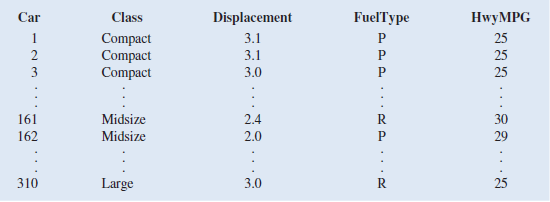
The U.S. Department of Energy's Fuel Economy Guide provides fuel efficiency data for cars and trucks. A portion of the data for 311 compact, midsized, and large cars follows. The Class column identifies the size of the car; Compact, Midsize, or Large. The Displacement column shows the engine's displacement in liters. The Fuel Type column shows whether the car uses premium (P) or regular (R) fuel, and the HwyMPG column shows the fuel efficiency rating for highway driving in terms of miles per gallon. The complete dataset is contained in the file FuelData :
a. Develop an estimated regression equation that can be used to predict the fuel efficiency for highway driving given the engine's displacement. Test for significance using the 0.05 level of significance. How much of the variation in the sample values of HwyMPG does this estimated regression equation explain
b. Create a scatter chart with HwyMPG on the y -axis and displacement on the x -axis for which the points representing compact, midsize, and large automobiles are shown in different shapes and/or colors. What does this chart suggest about the relationship between the class of automobile (compact, midsize, and large) and Hwy
c. Now consider the addition of the dummy variables ClassMidsize and ClassLarge to the simple linear regression model in part a. The value of ClassMidsize is 1 if the car is a midsize car and 0 otherwise; the value of ClassLarge is 1 if the car is a large car and 0 otherwise. Thus, for a compact car, the value of ClassMidsize and the value of ClassLarge are both 0. Develop the estimated regression equation that can be used to predict the fuel efficiency for highway driving, given the engine's displacement and the dummy variables ClassMidsize and ClassLarge. How much of the variation in the sample values of HwyMPG does this estimated regression equation explain
d. Use significance level of 0.05 to determine whether the dummy variables added to the model in part c are significant.
e. Consider the addition of the dummy variable FuelPremium, where the value of FuelPremium is 1 if the car uses premium fuel and 0 if the car uses regular fuel. Develop the estimated regression equation that can be used to predict the fuel efficiency for highway driving given the engine's displacement, the dummy variables ClassMidsize and ClassLarge, and the dummy variable Fuel Premium. How much of the variation in the sample values of HwyMPG does this estimated regression equation explain
f. For the estimated regression equation developed in part e, test for the significance of an overall regression relationship and relationships between each of the independent variables and the dependent variable using the 0.05 level of significance for each test.
Explanation Verified
Consider the provided details and the "F...
Essentials of Business Analytics 1st Edition by Jeffrey Camm,James Cochran,Michael Fry,Jeffrey Ohlmann ,David Anderson
Why don’t you like this exercise?
Other Minimum 8 character and maximum 255 character
Character 255


