Deck 13: Simulation Modeling
Full screen (f)
Question
Question
Question
Question
Question
Question
Question
Question
Question
Question
Question
Question
Question
Question
Question
Question
Question
Question
Question
Question
Question
Question
Question
Question
Table 13-2
A new young mother has opened a cloth diaper service.She is interested in simulating the number of diapers required for a one-year-old.She hopes to use this data to show the cost effectiveness of cloth diapers.The table below shows the number of diapers demanded daily and the probabilities associated with each level of demand.
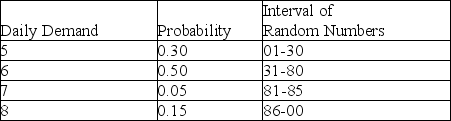
According to Table 13-2, if the random number 96 were generated for a particular day, what would the simulated demand be for that day?
A)5
B)6
C)7
D)8
A new young mother has opened a cloth diaper service.She is interested in simulating the number of diapers required for a one-year-old.She hopes to use this data to show the cost effectiveness of cloth diapers.The table below shows the number of diapers demanded daily and the probabilities associated with each level of demand.
According to Table 13-2, if the random number 96 were generated for a particular day, what would the simulated demand be for that day?
A)5
B)6
C)7
D)8
Question
Table 13-2
A new young mother has opened a cloth diaper service.She is interested in simulating the number of diapers required for a one-year-old.She hopes to use this data to show the cost effectiveness of cloth diapers.The table below shows the number of diapers demanded daily and the probabilities associated with each level of demand.
According to Table 13-2, if the random number 40 were generated for a particular day, what would the simulated demand be for that day?
A)5
B)6
C)7
D)20
Question
Question
Question
Question
Question
Question
Question
Table 13-1
The table below represents the probability distribution for machine breakdowns in a day of operation.
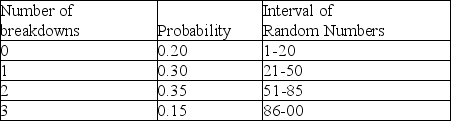
According to Table 13-1, if a random number of 00 is drawn, what would the simulated number of breakdowns be?
A)0
B)1
C)2
D)3
The table below represents the probability distribution for machine breakdowns in a day of operation.
According to Table 13-1, if a random number of 00 is drawn, what would the simulated number of breakdowns be?
A)0
B)1
C)2
D)3
Question
Table 13-1
The table below represents the probability distribution for machine breakdowns in a day of operation.
According to Table 13-1, what is the probability of at least one breakdown?
A)0.2
B)0.3
C)0.5
D)0.8
The table below represents the probability distribution for machine breakdowns in a day of operation.
According to Table 13-1, what is the probability of at least one breakdown?
A)0.2
B)0.3
C)0.5
D)0.8
Question
Question
Question
Table 13-1
The table below represents the probability distribution for machine breakdowns in a day of operation.
According to Table 13-1, what is the cumulative probability of 2 breakdowns?
A)0.35
B)0.50
C)0.85
D)0.15
The table below represents the probability distribution for machine breakdowns in a day of operation.
According to Table 13-1, what is the cumulative probability of 2 breakdowns?
A)0.35
B)0.50
C)0.85
D)0.15
Question
Question
Question
Question
Question
Table 13-4
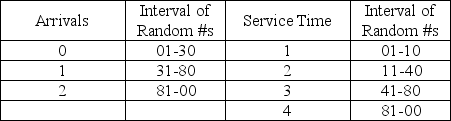
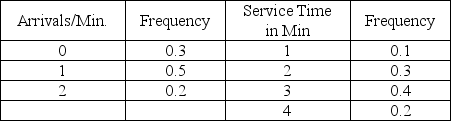
A pawn shop in Arlington, Texas, has a drive-through window to better serve customers.The following tables provide information about the time between arrivals and the service times required at the window on a particularly busy day of the week.All times are in minutes.
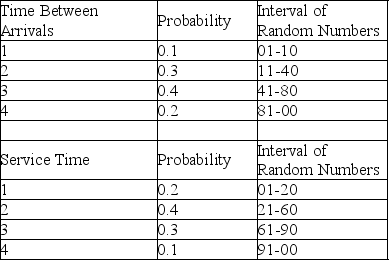 The first random number generated for arrivals is used to tell when the first customer arrives after opening.
According to Table 13-4, the time between successive arrivals is 1, 2, 3, or 4 minutes.If the store opens at 8:00 a.m., and random numbers are used to generate arrivals, what time would the first customer arrive if the first random number were 02?
A)8:01
B)8:02
C)8:03
D)8:04
A pawn shop in Arlington, Texas, has a drive-through window to better serve customers.The following tables provide information about the time between arrivals and the service times required at the window on a particularly busy day of the week.All times are in minutes.
The first random number generated for arrivals is used to tell when the first customer arrives after opening.According to Table 13-4, the time between successive arrivals is 1, 2, 3, or 4 minutes.If the store opens at 8:00 a.m., and random numbers are used to generate arrivals, what time would the first customer arrive if the first random number were 02?
A)8:01
B)8:02
C)8:03
D)8:04
Question
Question
Table 13-3
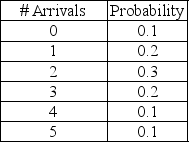
A pharmacy is considering hiring another pharmacist to better serve customers.To help analyze this situation, records are kept to determine how many customers will arrive in any 10-minute interval.Based on 100 ten-minute intervals, the following probability distribution has been developed and random numbers assigned to each event.
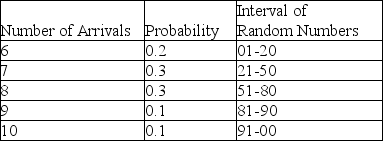
According to Table 13-3, the number of arrivals in any 10-minute period is between 6 and 10, inclusive.Suppose the next three random numbers were 18, 89, and 67, and these were used to simulate arrivals in the next three 10-minute intervals.How many customers would have arrived during this 30-minute time period?
A)22
B)23
C)24
D)25
A pharmacy is considering hiring another pharmacist to better serve customers.To help analyze this situation, records are kept to determine how many customers will arrive in any 10-minute interval.Based on 100 ten-minute intervals, the following probability distribution has been developed and random numbers assigned to each event.
According to Table 13-3, the number of arrivals in any 10-minute period is between 6 and 10, inclusive.Suppose the next three random numbers were 18, 89, and 67, and these were used to simulate arrivals in the next three 10-minute intervals.How many customers would have arrived during this 30-minute time period?
A)22
B)23
C)24
D)25
Question
Table 13-2
A new young mother has opened a cloth diaper service.She is interested in simulating the number of diapers required for a one-year-old.She hopes to use this data to show the cost effectiveness of cloth diapers.The table below shows the number of diapers demanded daily and the probabilities associated with each level of demand.
According to Table 13-2, what is the cumulative probability that demand is less than or equal to 7?
A)0.85
B)0.95
C)0.80
D)0.15
Question
Question
Question
Table 13-4
A pawn shop in Arlington, Texas, has a drive-through window to better serve customers.The following tables provide information about the time between arrivals and the service times required at the window on a particularly busy day of the week.All times are in minutes.
The first random number generated for arrivals is used to tell when the first customer arrives after opening.
According to Table 13-4, the time between successive arrivals is 1, 2, 3, or 4 minutes.The store opens at 8:00 a.m., and random numbers are used to generate arrivals and service times.The first random number to generate an arrival is 39, while the first service time is generated by the random number 94.What time would the first customer finish transacting business?
A)8:03
B)8:04
C)8:05
D)8:06
A pawn shop in Arlington, Texas, has a drive-through window to better serve customers.The following tables provide information about the time between arrivals and the service times required at the window on a particularly busy day of the week.All times are in minutes.
The first random number generated for arrivals is used to tell when the first customer arrives after opening.According to Table 13-4, the time between successive arrivals is 1, 2, 3, or 4 minutes.The store opens at 8:00 a.m., and random numbers are used to generate arrivals and service times.The first random number to generate an arrival is 39, while the first service time is generated by the random number 94.What time would the first customer finish transacting business?
A)8:03
B)8:04
C)8:05
D)8:06
Question
Table 13-5
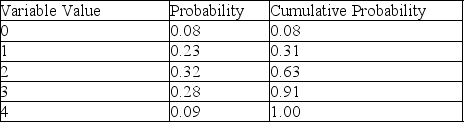
According to Table 13-5, which presents a summary of the Monte Carlo output from a simulation of 200 runs, there are 5 possible values for the variable of concern.If random numbers between 01 and 100 are used to generate values, then a random draw of 72 would produce a variable value of
A)0.
B)1.
C)2.
D)3.
Question
Question
Table 13-3
A pharmacy is considering hiring another pharmacist to better serve customers.To help analyze this situation, records are kept to determine how many customers will arrive in any 10-minute interval.Based on 100 ten-minute intervals, the following probability distribution has been developed and random numbers assigned to each event.
According to Table 13-3, the number of arrivals in any 10-minute period is between 6 and 10, inclusive.Suppose the next three random numbers were 20, 50, and 79, and these were used to simulate arrivals in the next three 10-minute intervals.How many customers would have arrived during this 30-minute time period?
A)18
B)19
C)20
D)21
Question
Table 13-4
A pawn shop in Arlington, Texas, has a drive-through window to better serve customers.The following tables provide information about the time between arrivals and the service times required at the window on a particularly busy day of the week.All times are in minutes.
The first random number generated for arrivals is used to tell when the first customer arrives after opening.
According to Table 13-4, the time between successive arrivals is 1, 2, 3, or 4 minutes.The store opens at 8:00 a.m., and random numbers are used to generate arrivals and service times.The first two random numbers for arrivals are 95 and 08.The first two random numbers for service times are 92 and 18.At what time does the second customer finish transacting business?
A)8:07
B)8:08
C)8:09
D)8:10
A pawn shop in Arlington, Texas, has a drive-through window to better serve customers.The following tables provide information about the time between arrivals and the service times required at the window on a particularly busy day of the week.All times are in minutes.
The first random number generated for arrivals is used to tell when the first customer arrives after opening.According to Table 13-4, the time between successive arrivals is 1, 2, 3, or 4 minutes.The store opens at 8:00 a.m., and random numbers are used to generate arrivals and service times.The first two random numbers for arrivals are 95 and 08.The first two random numbers for service times are 92 and 18.At what time does the second customer finish transacting business?
A)8:07
B)8:08
C)8:09
D)8:10
Question
Question
Table 13-3
A pharmacy is considering hiring another pharmacist to better serve customers.To help analyze this situation, records are kept to determine how many customers will arrive in any 10-minute interval.Based on 100 ten-minute intervals, the following probability distribution has been developed and random numbers assigned to each event.
According to Table 13-3, the number of arrivals in any 10-minute period is between 6 and 10 inclusive.Suppose the next 3 random numbers were 02, 81, and 18.These numbers are used to simulate arrivals into the pharmacy.What would the average number of arrivals per 10-minute period be based on this set of occurrences?
A)6
B)7
C)8
D)9
Question
Question
Table 13-4
A pawn shop in Arlington, Texas, has a drive-through window to better serve customers.The following tables provide information about the time between arrivals and the service times required at the window on a particularly busy day of the week.All times are in minutes.
The first random number generated for arrivals is used to tell when the first customer arrives after opening.
According to Table 13-4, the time between successive arrivals is 1, 2, 3, or 4 minutes.The store opens at 8:00 a.m., and random numbers are used to generate arrivals and service times.The first 3 random numbers to generate arrivals are 09, 89, and 26.What time does the third customer arrive?
A)8:07
B)8:08
C)8:09
D)8:10
A pawn shop in Arlington, Texas, has a drive-through window to better serve customers.The following tables provide information about the time between arrivals and the service times required at the window on a particularly busy day of the week.All times are in minutes.
The first random number generated for arrivals is used to tell when the first customer arrives after opening.According to Table 13-4, the time between successive arrivals is 1, 2, 3, or 4 minutes.The store opens at 8:00 a.m., and random numbers are used to generate arrivals and service times.The first 3 random numbers to generate arrivals are 09, 89, and 26.What time does the third customer arrive?
A)8:07
B)8:08
C)8:09
D)8:10
Question
Table 13-6
Paul prepares a variety of Creole and Cajun dishes to the delight of his diners at his restaurant in the French Quarter.Demand for crawfish etouffee follows this historical distribution:
 Each recipe of crawfish etouffee calls for two sticks of butter which the prep chef must buy down the block at a local grocery store.Paul would like to put in a special butter refrigerator and needs to estimate the capacity he would need if he orders twice a week from his butter supplier.He decides to simulate two weeks of this process using the historical distribution mapped to random numbers ranging from 01-00 and the random number table below.
Use the information in Table 13-6 to determine the range of random numbers corresponding to demand for 22 orders per day.
A)11-25
B)10-25
C)10-24
D)11-24
Paul prepares a variety of Creole and Cajun dishes to the delight of his diners at his restaurant in the French Quarter.Demand for crawfish etouffee follows this historical distribution:
Each recipe of crawfish etouffee calls for two sticks of butter which the prep chef must buy down the block at a local grocery store.Paul would like to put in a special butter refrigerator and needs to estimate the capacity he would need if he orders twice a week from his butter supplier.He decides to simulate two weeks of this process using the historical distribution mapped to random numbers ranging from 01-00 and the random number table below.Use the information in Table 13-6 to determine the range of random numbers corresponding to demand for 22 orders per day.
A)11-25
B)10-25
C)10-24
D)11-24
Question
Question
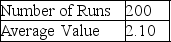
Table 13-5
According to Table 13-5, which presents a summary of the Monte Carlo output from a simulation of 200 runs, there are 5 possible values for the variable of concern.If this variable represents the number of machine breakdowns during a day, what is the probability that the number of breakdowns is 2 or fewer?
A)0.23
B)0.31
C)0.32
D)0.63
Question
Question
Table 13-5
According to Table 13-5, which presents a summary of the Monte Carlo output from a simulation of 200 runs, there are 5 possible values for the variable of concern.If this variable represents the number of machine breakdowns during a day, what is the probability that the number of breakdowns is more than 4?
A)0
B)0.08
C)0.09
D)1.00
Question
Table 13-6
Paul prepares a variety of Creole and Cajun dishes to the delight of his diners at his restaurant in the French Quarter.Demand for crawfish etouffee follows this historical distribution:
Each recipe of crawfish etouffee calls for two sticks of butter which the prep chef must buy down the block at a local grocery store.Paul would like to put in a special butter refrigerator and needs to estimate the capacity he would need if he orders twice a week from his butter supplier.He decides to simulate two weeks of this process using the historical distribution mapped to random numbers ranging from 01-00 and the random number table below.
Paul decides to order butter every four days and decides to maintain a level of inventory that is the sum of the four highest consecutive days' demand plus 10%.Based on this two-week simulation, what should his stocking level be for the scenario shown in Table 13-6?
A)340 sticks
B)251 sticks
C)319 sticks
D)125 sticks
Paul prepares a variety of Creole and Cajun dishes to the delight of his diners at his restaurant in the French Quarter.Demand for crawfish etouffee follows this historical distribution:
Each recipe of crawfish etouffee calls for two sticks of butter which the prep chef must buy down the block at a local grocery store.Paul would like to put in a special butter refrigerator and needs to estimate the capacity he would need if he orders twice a week from his butter supplier.He decides to simulate two weeks of this process using the historical distribution mapped to random numbers ranging from 01-00 and the random number table below.Paul decides to order butter every four days and decides to maintain a level of inventory that is the sum of the four highest consecutive days' demand plus 10%.Based on this two-week simulation, what should his stocking level be for the scenario shown in Table 13-6?
A)340 sticks
B)251 sticks
C)319 sticks
D)125 sticks
Question
Table 13-6
Paul prepares a variety of Creole and Cajun dishes to the delight of his diners at his restaurant in the French Quarter.Demand for crawfish etouffee follows this historical distribution:
Each recipe of crawfish etouffee calls for two sticks of butter which the prep chef must buy down the block at a local grocery store.Paul would like to put in a special butter refrigerator and needs to estimate the capacity he would need if he orders twice a week from his butter supplier.He decides to simulate two weeks of this process using the historical distribution mapped to random numbers ranging from 01-00 and the random number table below.
At what level of nightly order for etouffee does the cumulative probability reach 50% for the scenario shown in Table 13-6?
A)22 orders
B)24 orders
C)26 orders
D)28 orders
Paul prepares a variety of Creole and Cajun dishes to the delight of his diners at his restaurant in the French Quarter.Demand for crawfish etouffee follows this historical distribution:
Each recipe of crawfish etouffee calls for two sticks of butter which the prep chef must buy down the block at a local grocery store.Paul would like to put in a special butter refrigerator and needs to estimate the capacity he would need if he orders twice a week from his butter supplier.He decides to simulate two weeks of this process using the historical distribution mapped to random numbers ranging from 01-00 and the random number table below.At what level of nightly order for etouffee does the cumulative probability reach 50% for the scenario shown in Table 13-6?
A)22 orders
B)24 orders
C)26 orders
D)28 orders
Question
Table 13-6
Paul prepares a variety of Creole and Cajun dishes to the delight of his diners at his restaurant in the French Quarter.Demand for crawfish etouffee follows this historical distribution:
Each recipe of crawfish etouffee calls for two sticks of butter which the prep chef must buy down the block at a local grocery store.Paul would like to put in a special butter refrigerator and needs to estimate the capacity he would need if he orders twice a week from his butter supplier.He decides to simulate two weeks of this process using the historical distribution mapped to random numbers ranging from 01-00 and the random number table below.
What is the demand for etouffee on day 6 dictated by the random number shown in Table 13-6?
A)20
B)22
C)24
D)26
Paul prepares a variety of Creole and Cajun dishes to the delight of his diners at his restaurant in the French Quarter.Demand for crawfish etouffee follows this historical distribution:
Each recipe of crawfish etouffee calls for two sticks of butter which the prep chef must buy down the block at a local grocery store.Paul would like to put in a special butter refrigerator and needs to estimate the capacity he would need if he orders twice a week from his butter supplier.He decides to simulate two weeks of this process using the historical distribution mapped to random numbers ranging from 01-00 and the random number table below.What is the demand for etouffee on day 6 dictated by the random number shown in Table 13-6?
A)20
B)22
C)24
D)26
Question
Table 13-7
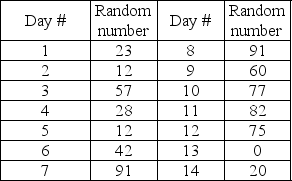
A professor dutifully holds six office hours per week as dictated by an archaic policy.Demand for office hours varies wildly as reflected in this historical data.
 The duration of time to answer questions varies independently from the actual demand.Question duration is reflected in this table.
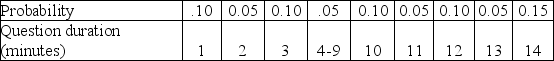 Entries in the student demand and question duration tables that reflect a range in demand, i.e., 3-9 students per six hours or 4-9 minutes should be treated as collapsed entries in the table.Thus, a question duration of 4 minutes has a 0.05 probability, a question duration of 5 minutes also has a 0.05 probability, and so on up through 9 minutes and a 0.05 probability.
This table contains random numbers for the number of students and duration of question for a 16-week period.
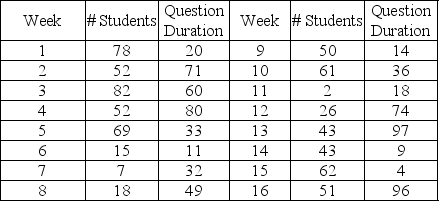 Use the question duration figure as the time required to answer questions for each student that week, so if three students arrive in week seven and the average duration is ten minutes, the total time spent answering questions that week is thirty minutes.
What is the duration of questions asked during week 5 according to the information contained in Table 13-7?
A)2
B)3
C)4
D)5
A professor dutifully holds six office hours per week as dictated by an archaic policy.Demand for office hours varies wildly as reflected in this historical data.
The duration of time to answer questions varies independently from the actual demand.Question duration is reflected in this table. Entries in the student demand and question duration tables that reflect a range in demand, i.e., 3-9 students per six hours or 4-9 minutes should be treated as collapsed entries in the table.Thus, a question duration of 4 minutes has a 0.05 probability, a question duration of 5 minutes also has a 0.05 probability, and so on up through 9 minutes and a 0.05 probability.This table contains random numbers for the number of students and duration of question for a 16-week period.
Use the question duration figure as the time required to answer questions for each student that week, so if three students arrive in week seven and the average duration is ten minutes, the total time spent answering questions that week is thirty minutes.What is the duration of questions asked during week 5 according to the information contained in Table 13-7?
A)2
B)3
C)4
D)5
Question
A certain grocery store has created the following tables of intervals of random numbers with regard to the number of people who arrive at its three checkout stands ready to check out, and the time it takes to check out the individuals.Simulate the utilization rate of the three checkout stands over four minutes using the following random numbers for arrivals: 07, 60, 49, and 95.Use the following random numbers for service: 77, 76, 51, and 16.Describe the results at the end of the four-minute period.
Question
Table 13-7
A professor dutifully holds six office hours per week as dictated by an archaic policy.Demand for office hours varies wildly as reflected in this historical data.
The duration of time to answer questions varies independently from the actual demand.Question duration is reflected in this table.
Entries in the student demand and question duration tables that reflect a range in demand, i.e., 3-9 students per six hours or 4-9 minutes should be treated as collapsed entries in the table.Thus, a question duration of 4 minutes has a 0.05 probability, a question duration of 5 minutes also has a 0.05 probability, and so on up through 9 minutes and a 0.05 probability.
This table contains random numbers for the number of students and duration of question for a 16-week period.
Use the question duration figure as the time required to answer questions for each student that week, so if three students arrive in week seven and the average duration is ten minutes, the total time spent answering questions that week is thirty minutes.
Use the information in Table 13-7 to determine the range of random numbers that corresponds to 10 students showing up for office hours.
A)21 to 25
B)20 to 24
C)20 to 25
D)21 to 24
A professor dutifully holds six office hours per week as dictated by an archaic policy.Demand for office hours varies wildly as reflected in this historical data.
The duration of time to answer questions varies independently from the actual demand.Question duration is reflected in this table. Entries in the student demand and question duration tables that reflect a range in demand, i.e., 3-9 students per six hours or 4-9 minutes should be treated as collapsed entries in the table.Thus, a question duration of 4 minutes has a 0.05 probability, a question duration of 5 minutes also has a 0.05 probability, and so on up through 9 minutes and a 0.05 probability.This table contains random numbers for the number of students and duration of question for a 16-week period.
Use the question duration figure as the time required to answer questions for each student that week, so if three students arrive in week seven and the average duration is ten minutes, the total time spent answering questions that week is thirty minutes.Use the information in Table 13-7 to determine the range of random numbers that corresponds to 10 students showing up for office hours.
A)21 to 25
B)20 to 24
C)20 to 25
D)21 to 24
Question
Question
Table 13-6
Paul prepares a variety of Creole and Cajun dishes to the delight of his diners at his restaurant in the French Quarter.Demand for crawfish etouffee follows this historical distribution:
Each recipe of crawfish etouffee calls for two sticks of butter which the prep chef must buy down the block at a local grocery store.Paul would like to put in a special butter refrigerator and needs to estimate the capacity he would need if he orders twice a week from his butter supplier.He decides to simulate two weeks of this process using the historical distribution mapped to random numbers ranging from 01-00 and the random number table below.
What is the demand for etouffee on day 13 dictated by the random number shown in Table 13-6?
A)20
B)24
C)26
D)30
Paul prepares a variety of Creole and Cajun dishes to the delight of his diners at his restaurant in the French Quarter.Demand for crawfish etouffee follows this historical distribution:
Each recipe of crawfish etouffee calls for two sticks of butter which the prep chef must buy down the block at a local grocery store.Paul would like to put in a special butter refrigerator and needs to estimate the capacity he would need if he orders twice a week from his butter supplier.He decides to simulate two weeks of this process using the historical distribution mapped to random numbers ranging from 01-00 and the random number table below.What is the demand for etouffee on day 13 dictated by the random number shown in Table 13-6?
A)20
B)24
C)26
D)30
Question
Table 13-7
A professor dutifully holds six office hours per week as dictated by an archaic policy.Demand for office hours varies wildly as reflected in this historical data.
The duration of time to answer questions varies independently from the actual demand.Question duration is reflected in this table.
Entries in the student demand and question duration tables that reflect a range in demand, i.e., 3-9 students per six hours or 4-9 minutes should be treated as collapsed entries in the table.Thus, a question duration of 4 minutes has a 0.05 probability, a question duration of 5 minutes also has a 0.05 probability, and so on up through 9 minutes and a 0.05 probability.
This table contains random numbers for the number of students and duration of question for a 16-week period.
Use the question duration figure as the time required to answer questions for each student that week, so if three students arrive in week seven and the average duration is ten minutes, the total time spent answering questions that week is thirty minutes.
What is the highest total time spent answering questions of all the weeks shown in Table 13-7?
A)150
B)154
C)158
D)162
A professor dutifully holds six office hours per week as dictated by an archaic policy.Demand for office hours varies wildly as reflected in this historical data.
The duration of time to answer questions varies independently from the actual demand.Question duration is reflected in this table. Entries in the student demand and question duration tables that reflect a range in demand, i.e., 3-9 students per six hours or 4-9 minutes should be treated as collapsed entries in the table.Thus, a question duration of 4 minutes has a 0.05 probability, a question duration of 5 minutes also has a 0.05 probability, and so on up through 9 minutes and a 0.05 probability.This table contains random numbers for the number of students and duration of question for a 16-week period.
Use the question duration figure as the time required to answer questions for each student that week, so if three students arrive in week seven and the average duration is ten minutes, the total time spent answering questions that week is thirty minutes.What is the highest total time spent answering questions of all the weeks shown in Table 13-7?
A)150
B)154
C)158
D)162
Question
Customer arrivals adhere to the following probability distribution:
 Create an appropriate table of interval of random numbers.
Create an appropriate table of interval of random numbers. Question
Table 13-7
A professor dutifully holds six office hours per week as dictated by an archaic policy.Demand for office hours varies wildly as reflected in this historical data.
The duration of time to answer questions varies independently from the actual demand.Question duration is reflected in this table.
Entries in the student demand and question duration tables that reflect a range in demand, i.e., 3-9 students per six hours or 4-9 minutes should be treated as collapsed entries in the table.Thus, a question duration of 4 minutes has a 0.05 probability, a question duration of 5 minutes also has a 0.05 probability, and so on up through 9 minutes and a 0.05 probability.
This table contains random numbers for the number of students and duration of question for a 16-week period.
Use the question duration figure as the time required to answer questions for each student that week, so if three students arrive in week seven and the average duration is ten minutes, the total time spent answering questions that week is thirty minutes.
What is the number of students that show up in a six-hour period during week 3 according to the information contained in Table 13-7?
A)9
B)10
C)11
D)12
A professor dutifully holds six office hours per week as dictated by an archaic policy.Demand for office hours varies wildly as reflected in this historical data.
The duration of time to answer questions varies independently from the actual demand.Question duration is reflected in this table. Entries in the student demand and question duration tables that reflect a range in demand, i.e., 3-9 students per six hours or 4-9 minutes should be treated as collapsed entries in the table.Thus, a question duration of 4 minutes has a 0.05 probability, a question duration of 5 minutes also has a 0.05 probability, and so on up through 9 minutes and a 0.05 probability.This table contains random numbers for the number of students and duration of question for a 16-week period.
Use the question duration figure as the time required to answer questions for each student that week, so if three students arrive in week seven and the average duration is ten minutes, the total time spent answering questions that week is thirty minutes.What is the number of students that show up in a six-hour period during week 3 according to the information contained in Table 13-7?
A)9
B)10
C)11
D)12
Question
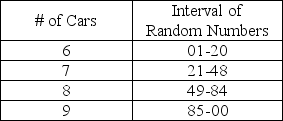
The number of cars arriving at a self-service gasoline station during the last 50 hours of operation are as follows:
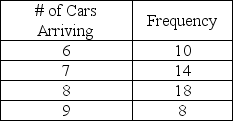 Create an appropriate table of intervals of random numbers.
Create an appropriate table of intervals of random numbers. Question
Question
Table 13-7
A professor dutifully holds six office hours per week as dictated by an archaic policy.Demand for office hours varies wildly as reflected in this historical data.
The duration of time to answer questions varies independently from the actual demand.Question duration is reflected in this table.
Entries in the student demand and question duration tables that reflect a range in demand, i.e., 3-9 students per six hours or 4-9 minutes should be treated as collapsed entries in the table.Thus, a question duration of 4 minutes has a 0.05 probability, a question duration of 5 minutes also has a 0.05 probability, and so on up through 9 minutes and a 0.05 probability.
This table contains random numbers for the number of students and duration of question for a 16-week period.
Use the question duration figure as the time required to answer questions for each student that week, so if three students arrive in week seven and the average duration is ten minutes, the total time spent answering questions that week is thirty minutes.
Use the information in Table 13-7 to determine the range of random numbers that corresponds to a seven-minute question.
A)40 to 45
B)41 to 45
C)40 to 44
D)41 to 44
A professor dutifully holds six office hours per week as dictated by an archaic policy.Demand for office hours varies wildly as reflected in this historical data.
The duration of time to answer questions varies independently from the actual demand.Question duration is reflected in this table. Entries in the student demand and question duration tables that reflect a range in demand, i.e., 3-9 students per six hours or 4-9 minutes should be treated as collapsed entries in the table.Thus, a question duration of 4 minutes has a 0.05 probability, a question duration of 5 minutes also has a 0.05 probability, and so on up through 9 minutes and a 0.05 probability.This table contains random numbers for the number of students and duration of question for a 16-week period.
Use the question duration figure as the time required to answer questions for each student that week, so if three students arrive in week seven and the average duration is ten minutes, the total time spent answering questions that week is thirty minutes.Use the information in Table 13-7 to determine the range of random numbers that corresponds to a seven-minute question.
A)40 to 45
B)41 to 45
C)40 to 44
D)41 to 44
Question
Table 13-7
A professor dutifully holds six office hours per week as dictated by an archaic policy.Demand for office hours varies wildly as reflected in this historical data.
The duration of time to answer questions varies independently from the actual demand.Question duration is reflected in this table.
Entries in the student demand and question duration tables that reflect a range in demand, i.e., 3-9 students per six hours or 4-9 minutes should be treated as collapsed entries in the table.Thus, a question duration of 4 minutes has a 0.05 probability, a question duration of 5 minutes also has a 0.05 probability, and so on up through 9 minutes and a 0.05 probability.
This table contains random numbers for the number of students and duration of question for a 16-week period.
Use the question duration figure as the time required to answer questions for each student that week, so if three students arrive in week seven and the average duration is ten minutes, the total time spent answering questions that week is thirty minutes.
What is the total duration of questions asked during week 3 according to the information contained in Table 13-7?
A)120
B)132
C)144
D)156
A professor dutifully holds six office hours per week as dictated by an archaic policy.Demand for office hours varies wildly as reflected in this historical data.
The duration of time to answer questions varies independently from the actual demand.Question duration is reflected in this table. Entries in the student demand and question duration tables that reflect a range in demand, i.e., 3-9 students per six hours or 4-9 minutes should be treated as collapsed entries in the table.Thus, a question duration of 4 minutes has a 0.05 probability, a question duration of 5 minutes also has a 0.05 probability, and so on up through 9 minutes and a 0.05 probability.This table contains random numbers for the number of students and duration of question for a 16-week period.
Use the question duration figure as the time required to answer questions for each student that week, so if three students arrive in week seven and the average duration is ten minutes, the total time spent answering questions that week is thirty minutes.What is the total duration of questions asked during week 3 according to the information contained in Table 13-7?
A)120
B)132
C)144
D)156
Question
Table 13-6
Paul prepares a variety of Creole and Cajun dishes to the delight of his diners at his restaurant in the French Quarter.Demand for crawfish etouffee follows this historical distribution:
Each recipe of crawfish etouffee calls for two sticks of butter which the prep chef must buy down the block at a local grocery store.Paul would like to put in a special butter refrigerator and needs to estimate the capacity he would need if he orders twice a week from his butter supplier.He decides to simulate two weeks of this process using the historical distribution mapped to random numbers ranging from 01-00 and the random number table below.
What is the total demand for butter during the first week for the scenario shown in Table 13-6?
A)340 sticks
B)265 sticks
C)405 sticks
D)384 sticks
Paul prepares a variety of Creole and Cajun dishes to the delight of his diners at his restaurant in the French Quarter.Demand for crawfish etouffee follows this historical distribution:
Each recipe of crawfish etouffee calls for two sticks of butter which the prep chef must buy down the block at a local grocery store.Paul would like to put in a special butter refrigerator and needs to estimate the capacity he would need if he orders twice a week from his butter supplier.He decides to simulate two weeks of this process using the historical distribution mapped to random numbers ranging from 01-00 and the random number table below.What is the total demand for butter during the first week for the scenario shown in Table 13-6?
A)340 sticks
B)265 sticks
C)405 sticks
D)384 sticks
Question
Table 13-6
Paul prepares a variety of Creole and Cajun dishes to the delight of his diners at his restaurant in the French Quarter.Demand for crawfish etouffee follows this historical distribution:
Each recipe of crawfish etouffee calls for two sticks of butter which the prep chef must buy down the block at a local grocery store.Paul would like to put in a special butter refrigerator and needs to estimate the capacity he would need if he orders twice a week from his butter supplier.He decides to simulate two weeks of this process using the historical distribution mapped to random numbers ranging from 01-00 and the random number table below.
What is the total demand for butter during the second week for the scenario shown in Table 13-6?
A)340 sticks
B)265 sticks
C)405 sticks
D)384 sticks
Paul prepares a variety of Creole and Cajun dishes to the delight of his diners at his restaurant in the French Quarter.Demand for crawfish etouffee follows this historical distribution:
Each recipe of crawfish etouffee calls for two sticks of butter which the prep chef must buy down the block at a local grocery store.Paul would like to put in a special butter refrigerator and needs to estimate the capacity he would need if he orders twice a week from his butter supplier.He decides to simulate two weeks of this process using the historical distribution mapped to random numbers ranging from 01-00 and the random number table below.What is the total demand for butter during the second week for the scenario shown in Table 13-6?
A)340 sticks
B)265 sticks
C)405 sticks
D)384 sticks
Question
Consider the interval of random numbers presented below.The following random numbers have been generated: 99, 98, 26, 09, 49, 52, 33, 89, 21, 37.Simulate 10 hours of arrivals at this gas station.What is the average number of arrivals during this period?
Question
Table 13-6
Paul prepares a variety of Creole and Cajun dishes to the delight of his diners at his restaurant in the French Quarter.Demand for crawfish etouffee follows this historical distribution:
Each recipe of crawfish etouffee calls for two sticks of butter which the prep chef must buy down the block at a local grocery store.Paul would like to put in a special butter refrigerator and needs to estimate the capacity he would need if he orders twice a week from his butter supplier.He decides to simulate two weeks of this process using the historical distribution mapped to random numbers ranging from 01-00 and the random number table below.
Use the information in Table 13-6 to determine the range of random numbers corresponding to demand for 30 orders per day.
A)90-99
B)91-00
C)90-100
D)91-100
Paul prepares a variety of Creole and Cajun dishes to the delight of his diners at his restaurant in the French Quarter.Demand for crawfish etouffee follows this historical distribution:
Each recipe of crawfish etouffee calls for two sticks of butter which the prep chef must buy down the block at a local grocery store.Paul would like to put in a special butter refrigerator and needs to estimate the capacity he would need if he orders twice a week from his butter supplier.He decides to simulate two weeks of this process using the historical distribution mapped to random numbers ranging from 01-00 and the random number table below.Use the information in Table 13-6 to determine the range of random numbers corresponding to demand for 30 orders per day.
A)90-99
B)91-00
C)90-100
D)91-100
Question
A certain grocery store has noted the following figures with regard to the number of people who arrive at its three checkout stands ready to check out, and the time it takes to check out the individuals.
 Create an appropriate table of interval of random numbers for both variables.
Create an appropriate table of interval of random numbers for both variables.
Unlock Deck
Sign up to unlock the cards in this deck!
Unlock Deck
Unlock Deck
1/94
Play
Full screen (f)
Deck 13: Simulation Modeling
1
Simulation models are limited to using standard probability distributions such as Poisson, exponential, normal, etc.
False
2
If, for a simple queuing or waiting line problem, we compare the solution from an analytical model with that from a simulation, we will typically find them to be exactly the same.
False
3
Simulation models are useful for economic order quantity problems with probabilistic demand and lead time.
True
4
Simulation that is used with queuing models are probabilistic and do not have Poisson arrivals nor exponential service times.
Unlock Deck
Unlock for access to all 94 flashcards in this deck.
Unlock Deck
k this deck
5
The wider the variation among results produced by using different sets of random numbers, the longer we need to run the simulation to obtain reliable results.
Unlock Deck
Unlock for access to all 94 flashcards in this deck.
Unlock Deck
k this deck
6
Simulation models may contain both deterministic and probabilistic variables.
Unlock Deck
Unlock for access to all 94 flashcards in this deck.
Unlock Deck
k this deck
7
A major advantage of using simulation techniques is to be able to study the interactive effect of individual components/variables.
Unlock Deck
Unlock for access to all 94 flashcards in this deck.
Unlock Deck
k this deck
8
The probability of selecting any random number in a two-digit table is 1/100.
Unlock Deck
Unlock for access to all 94 flashcards in this deck.
Unlock Deck
k this deck
9
The advantage of simulation over queuing or waiting line models is that simulation allows us to relax our assumptions regarding arrival and service distributions.
Unlock Deck
Unlock for access to all 94 flashcards in this deck.
Unlock Deck
k this deck
10
The four disadvantages of simulation are cost, its trial-and-error nature, time compression, and uniqueness.
Unlock Deck
Unlock for access to all 94 flashcards in this deck.
Unlock Deck
k this deck
11
One of the major advantages of simulation is "time compression," i.e., the ability to study in a relatively short period, activities that would, in reality, take place over a period of days, months, or even years.
Unlock Deck
Unlock for access to all 94 flashcards in this deck.
Unlock Deck
k this deck
12
Simulation models are designed to generate optimal solutions, which can then be applied to real-world situations.
Unlock Deck
Unlock for access to all 94 flashcards in this deck.
Unlock Deck
k this deck
13
Simulation is very flexible.Thus, its solutions and inferences are usually transferable to other problems.
Unlock Deck
Unlock for access to all 94 flashcards in this deck.
Unlock Deck
k this deck
14
Simulation can use any probability distribution that the user defines; it does not require standard distributions.
Unlock Deck
Unlock for access to all 94 flashcards in this deck.
Unlock Deck
k this deck
15
One disadvantage of simulation is that it does not allow for what-if types of questions.
Unlock Deck
Unlock for access to all 94 flashcards in this deck.
Unlock Deck
k this deck
16
A flow diagram is helpful in the logical coding procedures for programming a simulation process.
Unlock Deck
Unlock for access to all 94 flashcards in this deck.
Unlock Deck
k this deck
17
Simulation of a business or process is generally performed by building a mathematical model to represent the process or system.
Unlock Deck
Unlock for access to all 94 flashcards in this deck.
Unlock Deck
k this deck
18
If we are using a Monte Carlo simulation model, we should expect the model to produce the same results for each set of random numbers used.
Unlock Deck
Unlock for access to all 94 flashcards in this deck.
Unlock Deck
k this deck
19
The Monte Carlo simulation is used with variables that are probabilistic.
Unlock Deck
Unlock for access to all 94 flashcards in this deck.
Unlock Deck
k this deck
20
If, in a simple queuing or waiting line problem, we wish to know the maximum likely waiting time, or the maximum likely length of the line, we must use a simulation model.
Unlock Deck
Unlock for access to all 94 flashcards in this deck.
Unlock Deck
k this deck
21
Operational gaming refers to simulation involving two or more competing agents.
Unlock Deck
Unlock for access to all 94 flashcards in this deck.
Unlock Deck
k this deck
22
When establishing a probability distribution based on historical outcomes, the relative frequency for each possible outcome of a variable is found by dividing the frequency of each outcome by the total number of observations.
Unlock Deck
Unlock for access to all 94 flashcards in this deck.
Unlock Deck
k this deck
23
Many companies use computerized simulation models to decide when to shut down an entire plant for maintenance activities.
Unlock Deck
Unlock for access to all 94 flashcards in this deck.
Unlock Deck
k this deck
24
Table 13-2
A new young mother has opened a cloth diaper service.She is interested in simulating the number of diapers required for a one-year-old.She hopes to use this data to show the cost effectiveness of cloth diapers.The table below shows the number of diapers demanded daily and the probabilities associated with each level of demand.
According to Table 13-2, if the random number 96 were generated for a particular day, what would the simulated demand be for that day?
A)5
B)6
C)7
D)8
Unlock Deck
Unlock for access to all 94 flashcards in this deck.
Unlock Deck
k this deck
25
Table 13-2
A new young mother has opened a cloth diaper service.She is interested in simulating the number of diapers required for a one-year-old.She hopes to use this data to show the cost effectiveness of cloth diapers.The table below shows the number of diapers demanded daily and the probabilities associated with each level of demand.
According to Table 13-2, if the random number 40 were generated for a particular day, what would the simulated demand be for that day?
A)5
B)6
C)7
D)20
Unlock Deck
Unlock for access to all 94 flashcards in this deck.
Unlock Deck
k this deck
26
One use of machine maintenance simulation is to test how frequently preventive maintenance should be performed or determine whether the plant should adopt a policy of simply fixing a machine when it breaks.
Unlock Deck
Unlock for access to all 94 flashcards in this deck.
Unlock Deck
k this deck
27
Econometric models are typically huge simulations involving thousands of queuing equations tied together by economics factors.
Unlock Deck
Unlock for access to all 94 flashcards in this deck.
Unlock Deck
k this deck
28
What is the probability of selecting any random number from a two-digit table?
A)0.001
B)0.01
C)0.10
D)0.02
A)0.001
B)0.01
C)0.10
D)0.02
Unlock Deck
Unlock for access to all 94 flashcards in this deck.
Unlock Deck
k this deck
29
A simulation that tests the number of ticket takers needed to allow fans to enter a stadium within a set period of time is one example of operational gaming.
Unlock Deck
Unlock for access to all 94 flashcards in this deck.
Unlock Deck
k this deck
30
Verification relates to building the right model.
Unlock Deck
Unlock for access to all 94 flashcards in this deck.
Unlock Deck
k this deck
31
There are three categories of simulation models: Monte Carlo, operational gaming, and systems simulation.
Unlock Deck
Unlock for access to all 94 flashcards in this deck.
Unlock Deck
k this deck
32
Table 13-1
The table below represents the probability distribution for machine breakdowns in a day of operation.
According to Table 13-1, if a random number of 00 is drawn, what would the simulated number of breakdowns be?
A)0
B)1
C)2
D)3
The table below represents the probability distribution for machine breakdowns in a day of operation.
According to Table 13-1, if a random number of 00 is drawn, what would the simulated number of breakdowns be?
A)0
B)1
C)2
D)3
Unlock Deck
Unlock for access to all 94 flashcards in this deck.
Unlock Deck
k this deck
33
Table 13-1
The table below represents the probability distribution for machine breakdowns in a day of operation.
According to Table 13-1, what is the probability of at least one breakdown?
A)0.2
B)0.3
C)0.5
D)0.8
The table below represents the probability distribution for machine breakdowns in a day of operation.
According to Table 13-1, what is the probability of at least one breakdown?
A)0.2
B)0.3
C)0.5
D)0.8
Unlock Deck
Unlock for access to all 94 flashcards in this deck.
Unlock Deck
k this deck
34
Validation relates to building the right model.
Unlock Deck
Unlock for access to all 94 flashcards in this deck.
Unlock Deck
k this deck
35
The Monte Carlo simulation was developed by
A)John von Neumann.
B)Eric von Brock.
C)A.K.Erlang.
D)P.K.Poisson.
A)John von Neumann.
B)Eric von Brock.
C)A.K.Erlang.
D)P.K.Poisson.
Unlock Deck
Unlock for access to all 94 flashcards in this deck.
Unlock Deck
k this deck
36
Table 13-1
The table below represents the probability distribution for machine breakdowns in a day of operation.
According to Table 13-1, what is the cumulative probability of 2 breakdowns?
A)0.35
B)0.50
C)0.85
D)0.15
The table below represents the probability distribution for machine breakdowns in a day of operation.
According to Table 13-1, what is the cumulative probability of 2 breakdowns?
A)0.35
B)0.50
C)0.85
D)0.15
Unlock Deck
Unlock for access to all 94 flashcards in this deck.
Unlock Deck
k this deck
37
Which of the following is not an advantage of simulation?
A)It allows for the study of what-if questions.
B)Each simulation model is unique.
C)It allows the study of interaction of components or variables to determine which are important.
D)It allows time compression.
A)It allows for the study of what-if questions.
B)Each simulation model is unique.
C)It allows the study of interaction of components or variables to determine which are important.
D)It allows time compression.
Unlock Deck
Unlock for access to all 94 flashcards in this deck.
Unlock Deck
k this deck
38
Simulation of maintenance problems can help management analyze various staffing strategies based on machine downtime and labor cost.
Unlock Deck
Unlock for access to all 94 flashcards in this deck.
Unlock Deck
k this deck
39
Econometric models are one class of systems simulations.
Unlock Deck
Unlock for access to all 94 flashcards in this deck.
Unlock Deck
k this deck
40
In assigning random numbers in a Monte Carlo simulation
A)it is important to develop a cumulative probability distribution.
B)it is important to use a normal distribution for all variables simulated.
C)it is not important to assign probabilities to an exact range of random number intervals.
D)it is important to use prime numbers to seed the distribution.
Unlock Deck
Unlock for access to all 94 flashcards in this deck.
Unlock Deck
k this deck
41
Table 13-4
A pawn shop in Arlington, Texas, has a drive-through window to better serve customers.The following tables provide information about the time between arrivals and the service times required at the window on a particularly busy day of the week.All times are in minutes.
The first random number generated for arrivals is used to tell when the first customer arrives after opening.
According to Table 13-4, the time between successive arrivals is 1, 2, 3, or 4 minutes.If the store opens at 8:00 a.m., and random numbers are used to generate arrivals, what time would the first customer arrive if the first random number were 02?
A)8:01
B)8:02
C)8:03
D)8:04
A pawn shop in Arlington, Texas, has a drive-through window to better serve customers.The following tables provide information about the time between arrivals and the service times required at the window on a particularly busy day of the week.All times are in minutes.
The first random number generated for arrivals is used to tell when the first customer arrives after opening.According to Table 13-4, the time between successive arrivals is 1, 2, 3, or 4 minutes.If the store opens at 8:00 a.m., and random numbers are used to generate arrivals, what time would the first customer arrive if the first random number were 02?
A)8:01
B)8:02
C)8:03
D)8:04
Unlock Deck
Unlock for access to all 94 flashcards in this deck.
Unlock Deck
k this deck
42
The use of simulations in competitive situations is called
A)Monte Carlo simulation.
B)systems simulation.
C)operational gaming.
D)virtual reality.
A)Monte Carlo simulation.
B)systems simulation.
C)operational gaming.
D)virtual reality.
Unlock Deck
Unlock for access to all 94 flashcards in this deck.
Unlock Deck
k this deck
43
Table 13-3
A pharmacy is considering hiring another pharmacist to better serve customers.To help analyze this situation, records are kept to determine how many customers will arrive in any 10-minute interval.Based on 100 ten-minute intervals, the following probability distribution has been developed and random numbers assigned to each event.
According to Table 13-3, the number of arrivals in any 10-minute period is between 6 and 10, inclusive.Suppose the next three random numbers were 18, 89, and 67, and these were used to simulate arrivals in the next three 10-minute intervals.How many customers would have arrived during this 30-minute time period?
A)22
B)23
C)24
D)25
Unlock Deck
Unlock for access to all 94 flashcards in this deck.
Unlock Deck
k this deck
44
Table 13-2
A new young mother has opened a cloth diaper service.She is interested in simulating the number of diapers required for a one-year-old.She hopes to use this data to show the cost effectiveness of cloth diapers.The table below shows the number of diapers demanded daily and the probabilities associated with each level of demand.
According to Table 13-2, what is the cumulative probability that demand is less than or equal to 7?
A)0.85
B)0.95
C)0.80
D)0.15
Unlock Deck
Unlock for access to all 94 flashcards in this deck.
Unlock Deck
k this deck
45
Simulation models can be broken down into which of the following three categories?
A)Monte Carlo, queuing, and inventory
B)queuing, inventory, and maintenance policy
C)Monte Carlo, operational gaming, systems simulation
D)inventory, systems simulation, and operational gaming
A)Monte Carlo, queuing, and inventory
B)queuing, inventory, and maintenance policy
C)Monte Carlo, operational gaming, systems simulation
D)inventory, systems simulation, and operational gaming
Unlock Deck
Unlock for access to all 94 flashcards in this deck.
Unlock Deck
k this deck
46
Which of the following represents the primary reason simulation cannot be used for the classic EOQ model?
A)too many parameters involved
B)too many decision variables
C)EOQ models are probabilistic.
D)EOQ models are deterministic.
A)too many parameters involved
B)too many decision variables
C)EOQ models are probabilistic.
D)EOQ models are deterministic.
Unlock Deck
Unlock for access to all 94 flashcards in this deck.
Unlock Deck
k this deck
47
Table 13-4
A pawn shop in Arlington, Texas, has a drive-through window to better serve customers.The following tables provide information about the time between arrivals and the service times required at the window on a particularly busy day of the week.All times are in minutes.
The first random number generated for arrivals is used to tell when the first customer arrives after opening.
According to Table 13-4, the time between successive arrivals is 1, 2, 3, or 4 minutes.The store opens at 8:00 a.m., and random numbers are used to generate arrivals and service times.The first random number to generate an arrival is 39, while the first service time is generated by the random number 94.What time would the first customer finish transacting business?
A)8:03
B)8:04
C)8:05
D)8:06
A pawn shop in Arlington, Texas, has a drive-through window to better serve customers.The following tables provide information about the time between arrivals and the service times required at the window on a particularly busy day of the week.All times are in minutes.
The first random number generated for arrivals is used to tell when the first customer arrives after opening.According to Table 13-4, the time between successive arrivals is 1, 2, 3, or 4 minutes.The store opens at 8:00 a.m., and random numbers are used to generate arrivals and service times.The first random number to generate an arrival is 39, while the first service time is generated by the random number 94.What time would the first customer finish transacting business?
A)8:03
B)8:04
C)8:05
D)8:06
Unlock Deck
Unlock for access to all 94 flashcards in this deck.
Unlock Deck
k this deck
48
Table 13-5
According to Table 13-5, which presents a summary of the Monte Carlo output from a simulation of 200 runs, there are 5 possible values for the variable of concern.If random numbers between 01 and 100 are used to generate values, then a random draw of 72 would produce a variable value of
A)0.
B)1.
C)2.
D)3.
Unlock Deck
Unlock for access to all 94 flashcards in this deck.
Unlock Deck
k this deck
49
The process of determining that the computer model is internally consistent and following the logic of the conceptual model is called
A)validation.
B)verification.
C)simulation.
D)experimentation.
A)validation.
B)verification.
C)simulation.
D)experimentation.
Unlock Deck
Unlock for access to all 94 flashcards in this deck.
Unlock Deck
k this deck
50
Table 13-3
A pharmacy is considering hiring another pharmacist to better serve customers.To help analyze this situation, records are kept to determine how many customers will arrive in any 10-minute interval.Based on 100 ten-minute intervals, the following probability distribution has been developed and random numbers assigned to each event.
According to Table 13-3, the number of arrivals in any 10-minute period is between 6 and 10, inclusive.Suppose the next three random numbers were 20, 50, and 79, and these were used to simulate arrivals in the next three 10-minute intervals.How many customers would have arrived during this 30-minute time period?
A)18
B)19
C)20
D)21
Unlock Deck
Unlock for access to all 94 flashcards in this deck.
Unlock Deck
k this deck
51
Table 13-4
A pawn shop in Arlington, Texas, has a drive-through window to better serve customers.The following tables provide information about the time between arrivals and the service times required at the window on a particularly busy day of the week.All times are in minutes.
The first random number generated for arrivals is used to tell when the first customer arrives after opening.
According to Table 13-4, the time between successive arrivals is 1, 2, 3, or 4 minutes.The store opens at 8:00 a.m., and random numbers are used to generate arrivals and service times.The first two random numbers for arrivals are 95 and 08.The first two random numbers for service times are 92 and 18.At what time does the second customer finish transacting business?
A)8:07
B)8:08
C)8:09
D)8:10
A pawn shop in Arlington, Texas, has a drive-through window to better serve customers.The following tables provide information about the time between arrivals and the service times required at the window on a particularly busy day of the week.All times are in minutes.
The first random number generated for arrivals is used to tell when the first customer arrives after opening.According to Table 13-4, the time between successive arrivals is 1, 2, 3, or 4 minutes.The store opens at 8:00 a.m., and random numbers are used to generate arrivals and service times.The first two random numbers for arrivals are 95 and 08.The first two random numbers for service times are 92 and 18.At what time does the second customer finish transacting business?
A)8:07
B)8:08
C)8:09
D)8:10
Unlock Deck
Unlock for access to all 94 flashcards in this deck.
Unlock Deck
k this deck
52
The logic in a simulation model is presented graphically through which of the following?
A)scatterplot
B)flowchart
C)blueprint
D)decision tree
A)scatterplot
B)flowchart
C)blueprint
D)decision tree
Unlock Deck
Unlock for access to all 94 flashcards in this deck.
Unlock Deck
k this deck
53
Table 13-3
A pharmacy is considering hiring another pharmacist to better serve customers.To help analyze this situation, records are kept to determine how many customers will arrive in any 10-minute interval.Based on 100 ten-minute intervals, the following probability distribution has been developed and random numbers assigned to each event.
According to Table 13-3, the number of arrivals in any 10-minute period is between 6 and 10 inclusive.Suppose the next 3 random numbers were 02, 81, and 18.These numbers are used to simulate arrivals into the pharmacy.What would the average number of arrivals per 10-minute period be based on this set of occurrences?
A)6
B)7
C)8
D)9
Unlock Deck
Unlock for access to all 94 flashcards in this deck.
Unlock Deck
k this deck
54
Which of the following is not considered one of the 5 steps of Monte Carlo Simulation?
A)establishing probability distributions for important input variables
B)generating random number
C)building a cumulative probability distribution for each input variable
D)establishing an objective function
A)establishing probability distributions for important input variables
B)generating random number
C)building a cumulative probability distribution for each input variable
D)establishing an objective function
Unlock Deck
Unlock for access to all 94 flashcards in this deck.
Unlock Deck
k this deck
55
Table 13-4
A pawn shop in Arlington, Texas, has a drive-through window to better serve customers.The following tables provide information about the time between arrivals and the service times required at the window on a particularly busy day of the week.All times are in minutes.
The first random number generated for arrivals is used to tell when the first customer arrives after opening.
According to Table 13-4, the time between successive arrivals is 1, 2, 3, or 4 minutes.The store opens at 8:00 a.m., and random numbers are used to generate arrivals and service times.The first 3 random numbers to generate arrivals are 09, 89, and 26.What time does the third customer arrive?
A)8:07
B)8:08
C)8:09
D)8:10
A pawn shop in Arlington, Texas, has a drive-through window to better serve customers.The following tables provide information about the time between arrivals and the service times required at the window on a particularly busy day of the week.All times are in minutes.
The first random number generated for arrivals is used to tell when the first customer arrives after opening.According to Table 13-4, the time between successive arrivals is 1, 2, 3, or 4 minutes.The store opens at 8:00 a.m., and random numbers are used to generate arrivals and service times.The first 3 random numbers to generate arrivals are 09, 89, and 26.What time does the third customer arrive?
A)8:07
B)8:08
C)8:09
D)8:10
Unlock Deck
Unlock for access to all 94 flashcards in this deck.
Unlock Deck
k this deck
56
Table 13-6
Paul prepares a variety of Creole and Cajun dishes to the delight of his diners at his restaurant in the French Quarter.Demand for crawfish etouffee follows this historical distribution:
Each recipe of crawfish etouffee calls for two sticks of butter which the prep chef must buy down the block at a local grocery store.Paul would like to put in a special butter refrigerator and needs to estimate the capacity he would need if he orders twice a week from his butter supplier.He decides to simulate two weeks of this process using the historical distribution mapped to random numbers ranging from 01-00 and the random number table below.
Use the information in Table 13-6 to determine the range of random numbers corresponding to demand for 22 orders per day.
A)11-25
B)10-25
C)10-24
D)11-24
Paul prepares a variety of Creole and Cajun dishes to the delight of his diners at his restaurant in the French Quarter.Demand for crawfish etouffee follows this historical distribution:
Each recipe of crawfish etouffee calls for two sticks of butter which the prep chef must buy down the block at a local grocery store.Paul would like to put in a special butter refrigerator and needs to estimate the capacity he would need if he orders twice a week from his butter supplier.He decides to simulate two weeks of this process using the historical distribution mapped to random numbers ranging from 01-00 and the random number table below.Use the information in Table 13-6 to determine the range of random numbers corresponding to demand for 22 orders per day.
A)11-25
B)10-25
C)10-24
D)11-24
Unlock Deck
Unlock for access to all 94 flashcards in this deck.
Unlock Deck
k this deck
57
The process of comparing a model to the real system that it represents to make sure it is accurate is called
A)validation.
B)verification.
C)simulation.
D)experimentation.
A)validation.
B)verification.
C)simulation.
D)experimentation.
Unlock Deck
Unlock for access to all 94 flashcards in this deck.
Unlock Deck
k this deck
58
Table 13-5
According to Table 13-5, which presents a summary of the Monte Carlo output from a simulation of 200 runs, there are 5 possible values for the variable of concern.If this variable represents the number of machine breakdowns during a day, what is the probability that the number of breakdowns is 2 or fewer?
A)0.23
B)0.31
C)0.32
D)0.63
Unlock Deck
Unlock for access to all 94 flashcards in this deck.
Unlock Deck
k this deck
59
Which of the following variables are probabilistic in an inventory model that requires simulation?
A)demand only
B)lead time only
C)holding cost only
D)both A and B
A)demand only
B)lead time only
C)holding cost only
D)both A and B
Unlock Deck
Unlock for access to all 94 flashcards in this deck.
Unlock Deck
k this deck
60
Table 13-5
According to Table 13-5, which presents a summary of the Monte Carlo output from a simulation of 200 runs, there are 5 possible values for the variable of concern.If this variable represents the number of machine breakdowns during a day, what is the probability that the number of breakdowns is more than 4?
A)0
B)0.08
C)0.09
D)1.00
Unlock Deck
Unlock for access to all 94 flashcards in this deck.
Unlock Deck
k this deck
61
Table 13-6
Paul prepares a variety of Creole and Cajun dishes to the delight of his diners at his restaurant in the French Quarter.Demand for crawfish etouffee follows this historical distribution:
Each recipe of crawfish etouffee calls for two sticks of butter which the prep chef must buy down the block at a local grocery store.Paul would like to put in a special butter refrigerator and needs to estimate the capacity he would need if he orders twice a week from his butter supplier.He decides to simulate two weeks of this process using the historical distribution mapped to random numbers ranging from 01-00 and the random number table below.
Paul decides to order butter every four days and decides to maintain a level of inventory that is the sum of the four highest consecutive days' demand plus 10%.Based on this two-week simulation, what should his stocking level be for the scenario shown in Table 13-6?
A)340 sticks
B)251 sticks
C)319 sticks
D)125 sticks
Paul prepares a variety of Creole and Cajun dishes to the delight of his diners at his restaurant in the French Quarter.Demand for crawfish etouffee follows this historical distribution:
Each recipe of crawfish etouffee calls for two sticks of butter which the prep chef must buy down the block at a local grocery store.Paul would like to put in a special butter refrigerator and needs to estimate the capacity he would need if he orders twice a week from his butter supplier.He decides to simulate two weeks of this process using the historical distribution mapped to random numbers ranging from 01-00 and the random number table below.Paul decides to order butter every four days and decides to maintain a level of inventory that is the sum of the four highest consecutive days' demand plus 10%.Based on this two-week simulation, what should his stocking level be for the scenario shown in Table 13-6?
A)340 sticks
B)251 sticks
C)319 sticks
D)125 sticks
Unlock Deck
Unlock for access to all 94 flashcards in this deck.
Unlock Deck
k this deck
62
Table 13-6
Paul prepares a variety of Creole and Cajun dishes to the delight of his diners at his restaurant in the French Quarter.Demand for crawfish etouffee follows this historical distribution:
Each recipe of crawfish etouffee calls for two sticks of butter which the prep chef must buy down the block at a local grocery store.Paul would like to put in a special butter refrigerator and needs to estimate the capacity he would need if he orders twice a week from his butter supplier.He decides to simulate two weeks of this process using the historical distribution mapped to random numbers ranging from 01-00 and the random number table below.
At what level of nightly order for etouffee does the cumulative probability reach 50% for the scenario shown in Table 13-6?
A)22 orders
B)24 orders
C)26 orders
D)28 orders
Paul prepares a variety of Creole and Cajun dishes to the delight of his diners at his restaurant in the French Quarter.Demand for crawfish etouffee follows this historical distribution:
Each recipe of crawfish etouffee calls for two sticks of butter which the prep chef must buy down the block at a local grocery store.Paul would like to put in a special butter refrigerator and needs to estimate the capacity he would need if he orders twice a week from his butter supplier.He decides to simulate two weeks of this process using the historical distribution mapped to random numbers ranging from 01-00 and the random number table below.At what level of nightly order for etouffee does the cumulative probability reach 50% for the scenario shown in Table 13-6?
A)22 orders
B)24 orders
C)26 orders
D)28 orders
Unlock Deck
Unlock for access to all 94 flashcards in this deck.
Unlock Deck
k this deck
63
Table 13-6
Paul prepares a variety of Creole and Cajun dishes to the delight of his diners at his restaurant in the French Quarter.Demand for crawfish etouffee follows this historical distribution:
Each recipe of crawfish etouffee calls for two sticks of butter which the prep chef must buy down the block at a local grocery store.Paul would like to put in a special butter refrigerator and needs to estimate the capacity he would need if he orders twice a week from his butter supplier.He decides to simulate two weeks of this process using the historical distribution mapped to random numbers ranging from 01-00 and the random number table below.
What is the demand for etouffee on day 6 dictated by the random number shown in Table 13-6?
A)20
B)22
C)24
D)26
Paul prepares a variety of Creole and Cajun dishes to the delight of his diners at his restaurant in the French Quarter.Demand for crawfish etouffee follows this historical distribution:
Each recipe of crawfish etouffee calls for two sticks of butter which the prep chef must buy down the block at a local grocery store.Paul would like to put in a special butter refrigerator and needs to estimate the capacity he would need if he orders twice a week from his butter supplier.He decides to simulate two weeks of this process using the historical distribution mapped to random numbers ranging from 01-00 and the random number table below.What is the demand for etouffee on day 6 dictated by the random number shown in Table 13-6?
A)20
B)22
C)24
D)26
Unlock Deck
Unlock for access to all 94 flashcards in this deck.
Unlock Deck
k this deck
64
Table 13-7
A professor dutifully holds six office hours per week as dictated by an archaic policy.Demand for office hours varies wildly as reflected in this historical data.
The duration of time to answer questions varies independently from the actual demand.Question duration is reflected in this table.
Entries in the student demand and question duration tables that reflect a range in demand, i.e., 3-9 students per six hours or 4-9 minutes should be treated as collapsed entries in the table.Thus, a question duration of 4 minutes has a 0.05 probability, a question duration of 5 minutes also has a 0.05 probability, and so on up through 9 minutes and a 0.05 probability.
This table contains random numbers for the number of students and duration of question for a 16-week period.
Use the question duration figure as the time required to answer questions for each student that week, so if three students arrive in week seven and the average duration is ten minutes, the total time spent answering questions that week is thirty minutes.
What is the duration of questions asked during week 5 according to the information contained in Table 13-7?
A)2
B)3
C)4
D)5
A professor dutifully holds six office hours per week as dictated by an archaic policy.Demand for office hours varies wildly as reflected in this historical data.
The duration of time to answer questions varies independently from the actual demand.Question duration is reflected in this table. Entries in the student demand and question duration tables that reflect a range in demand, i.e., 3-9 students per six hours or 4-9 minutes should be treated as collapsed entries in the table.Thus, a question duration of 4 minutes has a 0.05 probability, a question duration of 5 minutes also has a 0.05 probability, and so on up through 9 minutes and a 0.05 probability.This table contains random numbers for the number of students and duration of question for a 16-week period.
Use the question duration figure as the time required to answer questions for each student that week, so if three students arrive in week seven and the average duration is ten minutes, the total time spent answering questions that week is thirty minutes.What is the duration of questions asked during week 5 according to the information contained in Table 13-7?
A)2
B)3
C)4
D)5
Unlock Deck
Unlock for access to all 94 flashcards in this deck.
Unlock Deck
k this deck
65
A certain grocery store has created the following tables of intervals of random numbers with regard to the number of people who arrive at its three checkout stands ready to check out, and the time it takes to check out the individuals.Simulate the utilization rate of the three checkout stands over four minutes using the following random numbers for arrivals: 07, 60, 49, and 95.Use the following random numbers for service: 77, 76, 51, and 16.Describe the results at the end of the four-minute period.
Unlock Deck
Unlock for access to all 94 flashcards in this deck.
Unlock Deck
k this deck
66
Table 13-7
A professor dutifully holds six office hours per week as dictated by an archaic policy.Demand for office hours varies wildly as reflected in this historical data.
The duration of time to answer questions varies independently from the actual demand.Question duration is reflected in this table.
Entries in the student demand and question duration tables that reflect a range in demand, i.e., 3-9 students per six hours or 4-9 minutes should be treated as collapsed entries in the table.Thus, a question duration of 4 minutes has a 0.05 probability, a question duration of 5 minutes also has a 0.05 probability, and so on up through 9 minutes and a 0.05 probability.
This table contains random numbers for the number of students and duration of question for a 16-week period.
Use the question duration figure as the time required to answer questions for each student that week, so if three students arrive in week seven and the average duration is ten minutes, the total time spent answering questions that week is thirty minutes.
Use the information in Table 13-7 to determine the range of random numbers that corresponds to 10 students showing up for office hours.
A)21 to 25
B)20 to 24
C)20 to 25
D)21 to 24
A professor dutifully holds six office hours per week as dictated by an archaic policy.Demand for office hours varies wildly as reflected in this historical data.
The duration of time to answer questions varies independently from the actual demand.Question duration is reflected in this table. Entries in the student demand and question duration tables that reflect a range in demand, i.e., 3-9 students per six hours or 4-9 minutes should be treated as collapsed entries in the table.Thus, a question duration of 4 minutes has a 0.05 probability, a question duration of 5 minutes also has a 0.05 probability, and so on up through 9 minutes and a 0.05 probability.This table contains random numbers for the number of students and duration of question for a 16-week period.
Use the question duration figure as the time required to answer questions for each student that week, so if three students arrive in week seven and the average duration is ten minutes, the total time spent answering questions that week is thirty minutes.Use the information in Table 13-7 to determine the range of random numbers that corresponds to 10 students showing up for office hours.
A)21 to 25
B)20 to 24
C)20 to 25
D)21 to 24
Unlock Deck
Unlock for access to all 94 flashcards in this deck.
Unlock Deck
k this deck
67
The number of machine breakdowns in a day is 0, 1, or 2, with probabilities 0.6, 0.3, and 0.1, respectively.The following random numbers have been generated: 13, 10, 02, 18, 31, 19, 32, 85, 31, 94.Use these numbers to generate the number of breakdowns for 10 consecutive days.What proportion of these days had at least one breakdown?
Unlock Deck
Unlock for access to all 94 flashcards in this deck.
Unlock Deck
k this deck
68
Table 13-6
Paul prepares a variety of Creole and Cajun dishes to the delight of his diners at his restaurant in the French Quarter.Demand for crawfish etouffee follows this historical distribution:
Each recipe of crawfish etouffee calls for two sticks of butter which the prep chef must buy down the block at a local grocery store.Paul would like to put in a special butter refrigerator and needs to estimate the capacity he would need if he orders twice a week from his butter supplier.He decides to simulate two weeks of this process using the historical distribution mapped to random numbers ranging from 01-00 and the random number table below.
What is the demand for etouffee on day 13 dictated by the random number shown in Table 13-6?
A)20
B)24
C)26
D)30
Paul prepares a variety of Creole and Cajun dishes to the delight of his diners at his restaurant in the French Quarter.Demand for crawfish etouffee follows this historical distribution:
Each recipe of crawfish etouffee calls for two sticks of butter which the prep chef must buy down the block at a local grocery store.Paul would like to put in a special butter refrigerator and needs to estimate the capacity he would need if he orders twice a week from his butter supplier.He decides to simulate two weeks of this process using the historical distribution mapped to random numbers ranging from 01-00 and the random number table below.What is the demand for etouffee on day 13 dictated by the random number shown in Table 13-6?
A)20
B)24
C)26
D)30
Unlock Deck
Unlock for access to all 94 flashcards in this deck.
Unlock Deck
k this deck
69
Table 13-7
A professor dutifully holds six office hours per week as dictated by an archaic policy.Demand for office hours varies wildly as reflected in this historical data.
The duration of time to answer questions varies independently from the actual demand.Question duration is reflected in this table.
Entries in the student demand and question duration tables that reflect a range in demand, i.e., 3-9 students per six hours or 4-9 minutes should be treated as collapsed entries in the table.Thus, a question duration of 4 minutes has a 0.05 probability, a question duration of 5 minutes also has a 0.05 probability, and so on up through 9 minutes and a 0.05 probability.
This table contains random numbers for the number of students and duration of question for a 16-week period.
Use the question duration figure as the time required to answer questions for each student that week, so if three students arrive in week seven and the average duration is ten minutes, the total time spent answering questions that week is thirty minutes.
What is the highest total time spent answering questions of all the weeks shown in Table 13-7?
A)150
B)154
C)158
D)162
A professor dutifully holds six office hours per week as dictated by an archaic policy.Demand for office hours varies wildly as reflected in this historical data.
The duration of time to answer questions varies independently from the actual demand.Question duration is reflected in this table. Entries in the student demand and question duration tables that reflect a range in demand, i.e., 3-9 students per six hours or 4-9 minutes should be treated as collapsed entries in the table.Thus, a question duration of 4 minutes has a 0.05 probability, a question duration of 5 minutes also has a 0.05 probability, and so on up through 9 minutes and a 0.05 probability.This table contains random numbers for the number of students and duration of question for a 16-week period.
Use the question duration figure as the time required to answer questions for each student that week, so if three students arrive in week seven and the average duration is ten minutes, the total time spent answering questions that week is thirty minutes.What is the highest total time spent answering questions of all the weeks shown in Table 13-7?
A)150
B)154
C)158
D)162
Unlock Deck
Unlock for access to all 94 flashcards in this deck.
Unlock Deck
k this deck
70
Customer arrivals adhere to the following probability distribution:
Create an appropriate table of interval of random numbers.
Create an appropriate table of interval of random numbers. Unlock Deck
Unlock for access to all 94 flashcards in this deck.
Unlock Deck
k this deck
71
Table 13-7
A professor dutifully holds six office hours per week as dictated by an archaic policy.Demand for office hours varies wildly as reflected in this historical data.
The duration of time to answer questions varies independently from the actual demand.Question duration is reflected in this table.
Entries in the student demand and question duration tables that reflect a range in demand, i.e., 3-9 students per six hours or 4-9 minutes should be treated as collapsed entries in the table.Thus, a question duration of 4 minutes has a 0.05 probability, a question duration of 5 minutes also has a 0.05 probability, and so on up through 9 minutes and a 0.05 probability.
This table contains random numbers for the number of students and duration of question for a 16-week period.
Use the question duration figure as the time required to answer questions for each student that week, so if three students arrive in week seven and the average duration is ten minutes, the total time spent answering questions that week is thirty minutes.
What is the number of students that show up in a six-hour period during week 3 according to the information contained in Table 13-7?
A)9
B)10
C)11
D)12
A professor dutifully holds six office hours per week as dictated by an archaic policy.Demand for office hours varies wildly as reflected in this historical data.
The duration of time to answer questions varies independently from the actual demand.Question duration is reflected in this table. Entries in the student demand and question duration tables that reflect a range in demand, i.e., 3-9 students per six hours or 4-9 minutes should be treated as collapsed entries in the table.Thus, a question duration of 4 minutes has a 0.05 probability, a question duration of 5 minutes also has a 0.05 probability, and so on up through 9 minutes and a 0.05 probability.This table contains random numbers for the number of students and duration of question for a 16-week period.
Use the question duration figure as the time required to answer questions for each student that week, so if three students arrive in week seven and the average duration is ten minutes, the total time spent answering questions that week is thirty minutes.What is the number of students that show up in a six-hour period during week 3 according to the information contained in Table 13-7?
A)9
B)10
C)11
D)12
Unlock Deck
Unlock for access to all 94 flashcards in this deck.
Unlock Deck
k this deck
72
The number of cars arriving at a self-service gasoline station during the last 50 hours of operation are as follows:
Create an appropriate table of intervals of random numbers.
Create an appropriate table of intervals of random numbers. Unlock Deck
Unlock for access to all 94 flashcards in this deck.
Unlock Deck
k this deck
73
Average daily sales of a product are 8 units.The actual number of sales each day is either 7, 8, or 9, with probabilities 0.3, 0.4, and 0.3, respectively.The lead time for delivery of this averages 4 days, although the time may be 3, 4, or 5 days, with probabilities 0.2, 0.6, and 0.2.The company plans to place an order when the inventory level drops to 32 units (based on the average demand and average lead time).The following random numbers have been generated: 60, 87, 46, 63 (set 1)and 52, 78, 13, 06, 99, 98, 80, 09, 67, 89, 45 (set 2).Use set 1 of these to generate lead times and use set 2 to simulate daily demand.Simulate 2 ordering periods with this and determine how often the company runs out of stock before the shipment arrives.Assume 32 units on-hand and an order was just placed.
Unlock Deck
Unlock for access to all 94 flashcards in this deck.
Unlock Deck
k this deck
74
Table 13-7
A professor dutifully holds six office hours per week as dictated by an archaic policy.Demand for office hours varies wildly as reflected in this historical data.
The duration of time to answer questions varies independently from the actual demand.Question duration is reflected in this table.
Entries in the student demand and question duration tables that reflect a range in demand, i.e., 3-9 students per six hours or 4-9 minutes should be treated as collapsed entries in the table.Thus, a question duration of 4 minutes has a 0.05 probability, a question duration of 5 minutes also has a 0.05 probability, and so on up through 9 minutes and a 0.05 probability.
This table contains random numbers for the number of students and duration of question for a 16-week period.
Use the question duration figure as the time required to answer questions for each student that week, so if three students arrive in week seven and the average duration is ten minutes, the total time spent answering questions that week is thirty minutes.
Use the information in Table 13-7 to determine the range of random numbers that corresponds to a seven-minute question.
A)40 to 45
B)41 to 45
C)40 to 44
D)41 to 44
A professor dutifully holds six office hours per week as dictated by an archaic policy.Demand for office hours varies wildly as reflected in this historical data.
The duration of time to answer questions varies independently from the actual demand.Question duration is reflected in this table. Entries in the student demand and question duration tables that reflect a range in demand, i.e., 3-9 students per six hours or 4-9 minutes should be treated as collapsed entries in the table.Thus, a question duration of 4 minutes has a 0.05 probability, a question duration of 5 minutes also has a 0.05 probability, and so on up through 9 minutes and a 0.05 probability.This table contains random numbers for the number of students and duration of question for a 16-week period.
Use the question duration figure as the time required to answer questions for each student that week, so if three students arrive in week seven and the average duration is ten minutes, the total time spent answering questions that week is thirty minutes.Use the information in Table 13-7 to determine the range of random numbers that corresponds to a seven-minute question.
A)40 to 45
B)41 to 45
C)40 to 44
D)41 to 44
Unlock Deck
Unlock for access to all 94 flashcards in this deck.
Unlock Deck
k this deck
75
Table 13-7
A professor dutifully holds six office hours per week as dictated by an archaic policy.Demand for office hours varies wildly as reflected in this historical data.
The duration of time to answer questions varies independently from the actual demand.Question duration is reflected in this table.
Entries in the student demand and question duration tables that reflect a range in demand, i.e., 3-9 students per six hours or 4-9 minutes should be treated as collapsed entries in the table.Thus, a question duration of 4 minutes has a 0.05 probability, a question duration of 5 minutes also has a 0.05 probability, and so on up through 9 minutes and a 0.05 probability.
This table contains random numbers for the number of students and duration of question for a 16-week period.
Use the question duration figure as the time required to answer questions for each student that week, so if three students arrive in week seven and the average duration is ten minutes, the total time spent answering questions that week is thirty minutes.
What is the total duration of questions asked during week 3 according to the information contained in Table 13-7?
A)120
B)132
C)144
D)156
A professor dutifully holds six office hours per week as dictated by an archaic policy.Demand for office hours varies wildly as reflected in this historical data.
The duration of time to answer questions varies independently from the actual demand.Question duration is reflected in this table. Entries in the student demand and question duration tables that reflect a range in demand, i.e., 3-9 students per six hours or 4-9 minutes should be treated as collapsed entries in the table.Thus, a question duration of 4 minutes has a 0.05 probability, a question duration of 5 minutes also has a 0.05 probability, and so on up through 9 minutes and a 0.05 probability.This table contains random numbers for the number of students and duration of question for a 16-week period.
Use the question duration figure as the time required to answer questions for each student that week, so if three students arrive in week seven and the average duration is ten minutes, the total time spent answering questions that week is thirty minutes.What is the total duration of questions asked during week 3 according to the information contained in Table 13-7?
A)120
B)132
C)144
D)156
Unlock Deck
Unlock for access to all 94 flashcards in this deck.
Unlock Deck
k this deck
76
Table 13-6
Paul prepares a variety of Creole and Cajun dishes to the delight of his diners at his restaurant in the French Quarter.Demand for crawfish etouffee follows this historical distribution:
Each recipe of crawfish etouffee calls for two sticks of butter which the prep chef must buy down the block at a local grocery store.Paul would like to put in a special butter refrigerator and needs to estimate the capacity he would need if he orders twice a week from his butter supplier.He decides to simulate two weeks of this process using the historical distribution mapped to random numbers ranging from 01-00 and the random number table below.
What is the total demand for butter during the first week for the scenario shown in Table 13-6?
A)340 sticks
B)265 sticks
C)405 sticks
D)384 sticks
Paul prepares a variety of Creole and Cajun dishes to the delight of his diners at his restaurant in the French Quarter.Demand for crawfish etouffee follows this historical distribution:
Each recipe of crawfish etouffee calls for two sticks of butter which the prep chef must buy down the block at a local grocery store.Paul would like to put in a special butter refrigerator and needs to estimate the capacity he would need if he orders twice a week from his butter supplier.He decides to simulate two weeks of this process using the historical distribution mapped to random numbers ranging from 01-00 and the random number table below.What is the total demand for butter during the first week for the scenario shown in Table 13-6?
A)340 sticks
B)265 sticks
C)405 sticks
D)384 sticks
Unlock Deck
Unlock for access to all 94 flashcards in this deck.
Unlock Deck
k this deck
77
Table 13-6
Paul prepares a variety of Creole and Cajun dishes to the delight of his diners at his restaurant in the French Quarter.Demand for crawfish etouffee follows this historical distribution:
Each recipe of crawfish etouffee calls for two sticks of butter which the prep chef must buy down the block at a local grocery store.Paul would like to put in a special butter refrigerator and needs to estimate the capacity he would need if he orders twice a week from his butter supplier.He decides to simulate two weeks of this process using the historical distribution mapped to random numbers ranging from 01-00 and the random number table below.
What is the total demand for butter during the second week for the scenario shown in Table 13-6?
A)340 sticks
B)265 sticks
C)405 sticks
D)384 sticks
Paul prepares a variety of Creole and Cajun dishes to the delight of his diners at his restaurant in the French Quarter.Demand for crawfish etouffee follows this historical distribution:
Each recipe of crawfish etouffee calls for two sticks of butter which the prep chef must buy down the block at a local grocery store.Paul would like to put in a special butter refrigerator and needs to estimate the capacity he would need if he orders twice a week from his butter supplier.He decides to simulate two weeks of this process using the historical distribution mapped to random numbers ranging from 01-00 and the random number table below.What is the total demand for butter during the second week for the scenario shown in Table 13-6?
A)340 sticks
B)265 sticks
C)405 sticks
D)384 sticks
Unlock Deck
Unlock for access to all 94 flashcards in this deck.
Unlock Deck
k this deck
78
Consider the interval of random numbers presented below.The following random numbers have been generated: 99, 98, 26, 09, 49, 52, 33, 89, 21, 37.Simulate 10 hours of arrivals at this gas station.What is the average number of arrivals during this period?
Unlock Deck
Unlock for access to all 94 flashcards in this deck.
Unlock Deck
k this deck
79
Table 13-6
Paul prepares a variety of Creole and Cajun dishes to the delight of his diners at his restaurant in the French Quarter.Demand for crawfish etouffee follows this historical distribution:
Each recipe of crawfish etouffee calls for two sticks of butter which the prep chef must buy down the block at a local grocery store.Paul would like to put in a special butter refrigerator and needs to estimate the capacity he would need if he orders twice a week from his butter supplier.He decides to simulate two weeks of this process using the historical distribution mapped to random numbers ranging from 01-00 and the random number table below.
Use the information in Table 13-6 to determine the range of random numbers corresponding to demand for 30 orders per day.
A)90-99
B)91-00
C)90-100
D)91-100
Paul prepares a variety of Creole and Cajun dishes to the delight of his diners at his restaurant in the French Quarter.Demand for crawfish etouffee follows this historical distribution:
Each recipe of crawfish etouffee calls for two sticks of butter which the prep chef must buy down the block at a local grocery store.Paul would like to put in a special butter refrigerator and needs to estimate the capacity he would need if he orders twice a week from his butter supplier.He decides to simulate two weeks of this process using the historical distribution mapped to random numbers ranging from 01-00 and the random number table below.Use the information in Table 13-6 to determine the range of random numbers corresponding to demand for 30 orders per day.
A)90-99
B)91-00
C)90-100
D)91-100
Unlock Deck
Unlock for access to all 94 flashcards in this deck.
Unlock Deck
k this deck
80
A certain grocery store has noted the following figures with regard to the number of people who arrive at its three checkout stands ready to check out, and the time it takes to check out the individuals.
Create an appropriate table of interval of random numbers for both variables.
Create an appropriate table of interval of random numbers for both variables. Unlock Deck
Unlock for access to all 94 flashcards in this deck.
Unlock Deck
k this deck
Unlock Deck
Unlock for access to all 94 flashcards in this deck.


