Deck 11: Industry and Manufacturing
Full screen (f)
Question
Question
Question

This map of railway diffusion indicates that during the Industrial Revolution
A) nearly all of Eastern Europe was connected by rail in 1848.
B) rail lines connected Paris to France's southern coast by 1848.
C) France had a more comprehensive rail network than the United Kingdom in 1848.
D) Poland had no rail lines in 1848.
E) rail lines connected London to many parts of the island of Britain by 1848.
Question
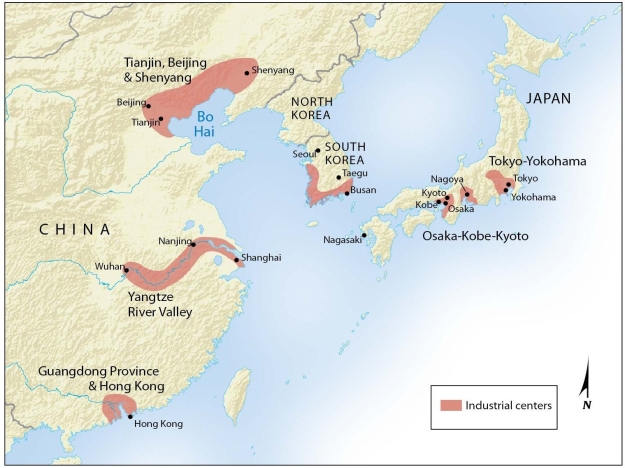
The map of East Asia's industrial areas indicates that the chief concentrations of manufacturing in the region include
A) the White River valley.
B) the river valley east of Wuhan.
C) the river valley east of Shanghai.
D) the western coast of Japan and eastern coast of Korea.
E) central China.
Question
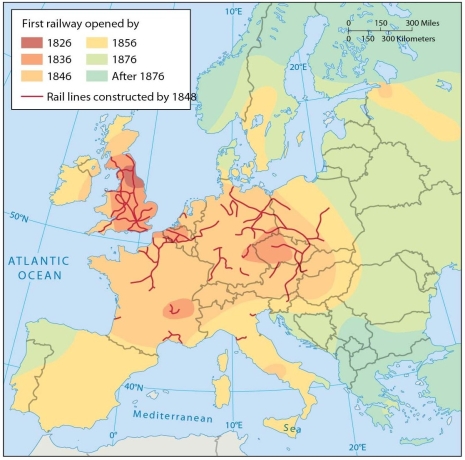
An analysis of this map indicates that railways
A) were not built in Russia until 1836.
B) were not built in France until 1826.
C) were not built in Russia until after 1876.
D) were built in Russia, France, and Serbia by 1856.
E) were not built in Greece until after 1876.
Question
Question
Question
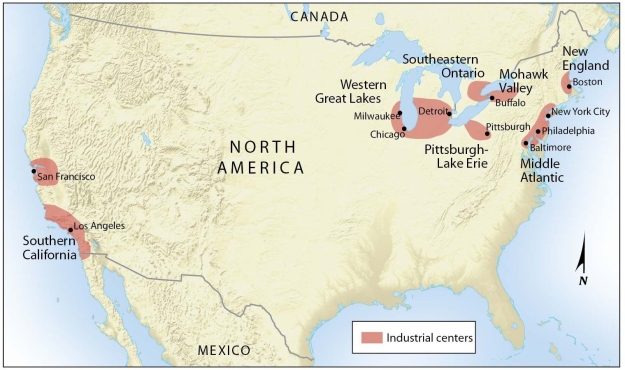
According to the map, Canada's most important industrial area is
A) Vancouver, British Columbia.
B) the St. Lawrence Valley and Ontario Peninsula.
C) the northern shore of Lake Superior.
D) the sea ports of Nova Scotia.
E) the entire southern border shared with the United States.
Question

An analysis of this map of Europe indicates that railways
A) were more concentrated in France and Germany before they appeared in the United Kingdom.
B) tended to be built first in Eastern Europe before spreading westward.
C) were built in France before they were built in the United Kingdom.
D) in the United Kingdom first appeared near London and were later built in northern England.
E) were built in northern England before they appeared in southern England.
Question
Question
Question
Question
Question
Question

The map of East Asia's industrial areas indicates that the region's chief manufacturing bases include
A) the Rhine-Ruhr valley.
B) parts of southeastern China.
C) parts of northwestern China.
D) northern Japan.
E) South Korea.
Question
Question
Question

The map of North America's industrial areas shows that
A) industry is dispersed evenly throughout the United States and Canada.
B) the industrial regions of California are more extensive than those of the Midwest and the Northeast combined.
C) Canada's far west and the U.S. South have become the continent's principal industrial zones.
D) Canada's industrial areas are nearly as extensive as those of the northeastern United States.
E) much of the region's industry is concentrated around or near the Great Lakes.
Question
Question
Question
Question
Question
Question
Question
Question
Question
Question
Question
Question
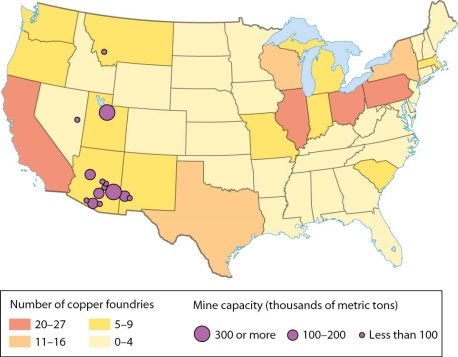
An analysis of this map of the copper industry in the United States indicates that
A) New Mexico has more foundries than Texas.
B) more copper is mined in Utah than in Arizona, Nevada, and Montana.
C) the largest numbers of foundries are in California, Illinois, Ohio, and Pennsylvania.
D) the largest numbers of foundries are in California, Illinois, Arizona, Texas, Florida, and Oregon.
E) the largest numbers of foundries are in Arizona, Nevada, New Mexico, and Montana.
Question
Question
Question
Question
Question
Question
Question

An analysis of this map of the copper industry in the United States indicates that
A) New Mexico has more foundries than Texas.
B) more copper is smelted in Utah than in Arizona, Nevada, and Montana.
C) more copper is mined in Utah, Arizona, Nevada, New Mexico, and Montana.
D) the largest numbers of copper smelters are in California, Illinois, Arizona, and Florida.
E) the largest numbers of copper smelters are in California, Arizona, and Utah.
Question
Question
Question
Question
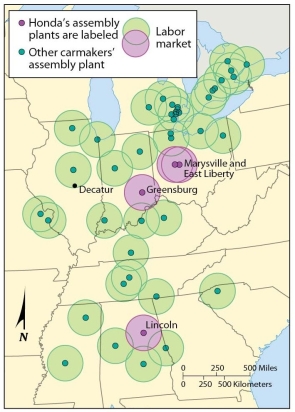
As indicated on this map of automobile assembly plants, in an effort to reduce labor competition and thus keep wages lower, there are only
A) three plants in Tennessee, one in South Carolina, two in Mississippi, and three in Illinois.
B) three plants in the Midwest, four plants in the Northeast, and five plants in the South.
C) two plants in the Midwest and more than 20 in the South.
D) four plants in Tennessee, one in South Carolina, three in Mississippi, and three in Illinois.
E) three plants in Tennessee, three in Kentucky, one in South Carolina, and four in Mississippi.
Question
Question
Question
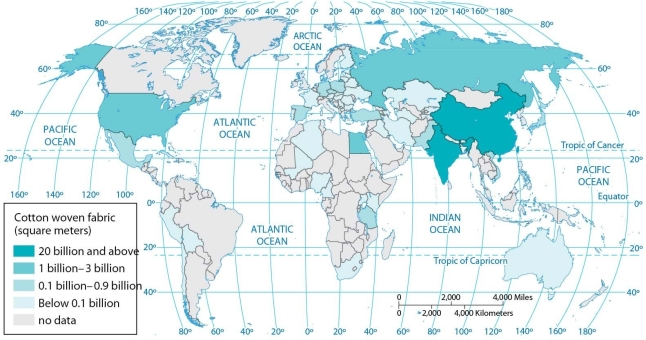
According to this map of cotton weaving distribution, between 1 billion and 3 billion square meters of fabric are produced annually in both
A) the United States and Canada.
B) the United States and Mexico.
C) Russia and Australia.
D) China and India.
E) the United States and Egypt.
Question
Question
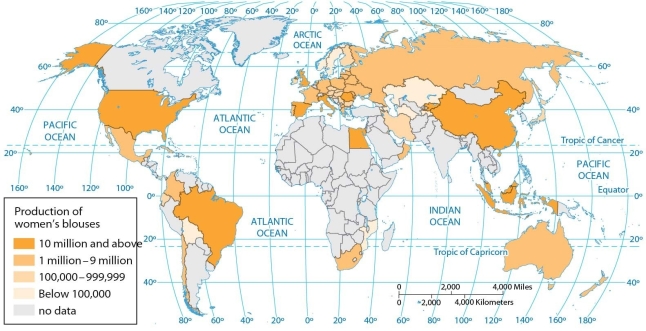
As indicated on this map, the world leaders in blouse production include the United States, China,
A) Russia, South Africa, and Australia.
B) Pakistan, and India.
C) Egypt, Bulgaria, Romania, and Turkey.
D) Mexico, South Africa, and Australia.
E) Egypt, Spain, and Brazil.
Question
Question
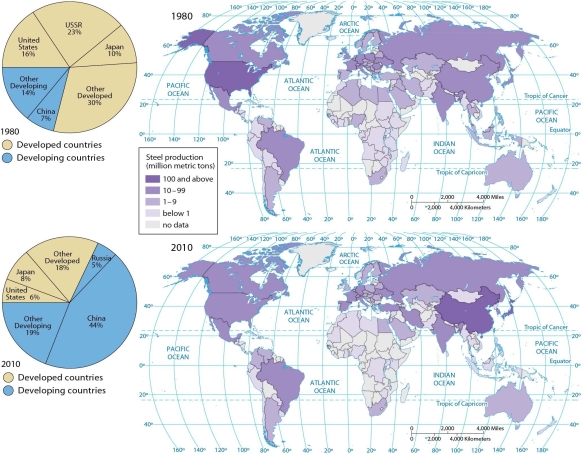
According to these charts, the U.S. share of global steel production
A) decreased from 30 percent in 1980 to 18 percent in 2010.
B) decreased from 44 percent in 1980 to 7 percent in 2010.
C) increased from 16 percent in 1980 to 19 percent in 2010.
D) decreased from 16 percent in 1980 to 8 percent in 2010.
E) decreased from 16 percent in 1980 to 6 percent in 2010.
Question
Question
Question

According to these pie charts, between 1980 and 2010 the share of global steel production from developing countries
A) increased from 7 percent to 44 percent.
B) increased from 14 percent to 19 percent of the total, if Russia is considered a developing country.
C) increased from 5 percent to 23 percent of the total, if Russia is considered a developing country.
D) decreased from 68 percent to 21 percent, if Russia is considered a developing country.
E) increased from 21 percent to 68 percent of the total, if Russia is considered a developing country.
Question
Question
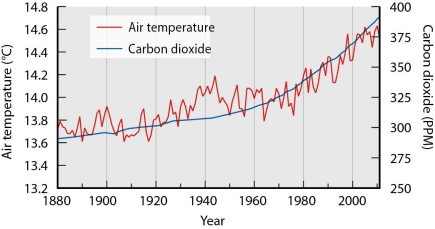
According to this graph, carbon dioxide emissions were approximately 300 PPM
A) in the year 1900 and 400 PPM in the year 2000.
B) in the year 1900 and 375 PPM in the year 2000.
C) in the year 1980 and 375 PPM in the year 2000.
D) in the year 1900 and 350 PPM in the year 2000.
E) in the year 1950 and 400 PPM in the year 1980.
Question
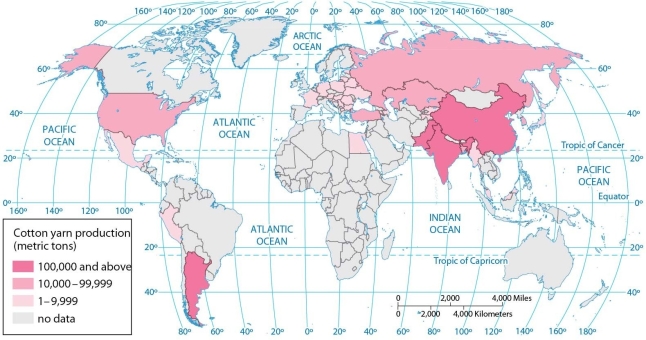
According to this map of cotton yarn production, after China, India, and Pakistan the world leaders in yarn production include
A) Argentina, Russia, and Australia.
B) Argentina, Brazil, Peru, Egypt, the United States, Turkey, Russia, and Australia.
C) Egypt, France, Germany, Belgium, and Poland.
D) Argentina, the United States, Iraq, Iran, and Russia.
E) Argentina, the United States, Turkey, Kazakhstan, and Russia.
Question
Question
Question
Question
Question
Question
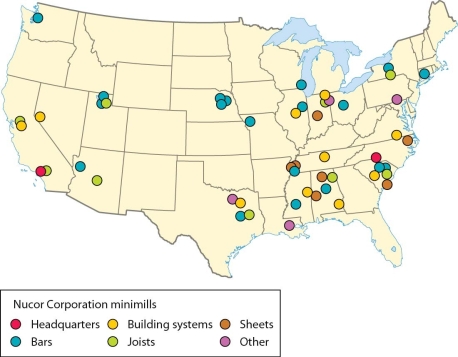
As indicated on the map of minimill facilities in the U.S.,
A) minimills are primarily situated close to Northeastern markets.
B) most Nucor operations are concentrated in Mississippi, California, Illinois, Kentucky, and Maine.
C) most Nucor operations are concentrated in Mississippi, Alabama, North Carolina, and Florida.
D) minimills operate in nearly every U.S. state.
E) Nucor has operations in at least 20 different states.
Question
Question
Question
Question
Question
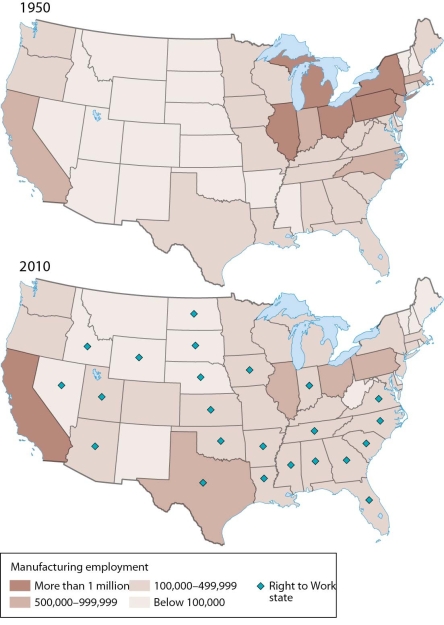
An analysis of these maps showing changes in U.S. manufacturing from 1950 to 2010 indicates that
A) the percentage of manufacturing jobs increased in California.
B) the percentage of manufacturing jobs decreased only in the Midwest and Northeast.
C) the number of manufacturing jobs increased only in "right-to-work" states.
D) the number of manufacturing jobs increased markedly in Ohio, Michigan, New York, and Pennsylvania.
E) the number of manufacturing jobs decreased markedly in Ohio, Michigan, New York, and Pennsylvania.
Question
Question
Question
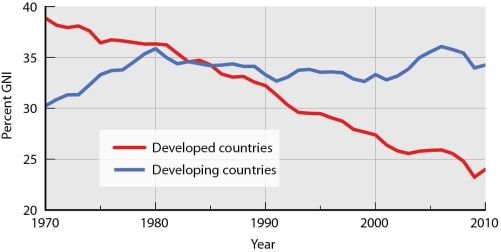
The chart on manufacturing value as a percentage of GDP indicates that the share of manufacturing in developed countries
A) began to be surpassed by manufacturing in developing countries in the mid-1990s.
B) was less than manufacturing in developing countries in the mid-1970s.
C) was greater than manufacturing in developing countries in the late 1980s.
D) was roughly equal to manufacturing in developing countries in the early 1990s.
E) was roughly equal to manufacturing in developing countries in the early 1980s.
Question
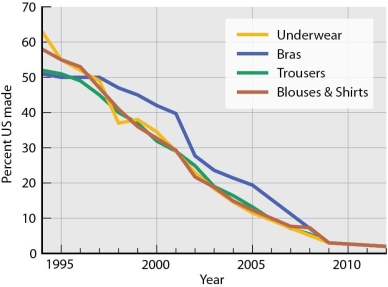
This chart regarding U.S.-made clothing indicates that the percentage of U.S.-made blouses and skirts being sold
A) decreased from about 38 percent in 2000 to about 3 percent in 2010.
B) decreased from about 25 percent in 2000 to about 5 percent in 2010.
C) decreased from about 25 percent in 2000 to about 3 percent in 2010.
D) decreased from about 30 percent in 2000 to about 1 percent in 2010.
E) decreased from about 32 percent in 2000 to about 3 percent in 2010.
Question
Question
Question

This map of rail diffusion in the Industrial Revolution indicates that Germany was served by several rail lines by 1848.
Question
Question
Question

An analysis of these maps showing changes in U.S. manufacturing from 1950 to 2010 indicates that
A) the percentage of manufacturing jobs remained largely unchanged.
B) the number of manufacturing jobs increased in nearly all "right-to-work" states.
C) the number of manufacturing jobs in Indiana increased when it became a "right-to-work" state.
D) the number of manufacturing jobs increased in most "right-to-work" states and decreased in most other states.
E) the number of manufacturing jobs increased in California and Colorado, which are not "right-to-work" states.
Question
Question
Question
Question
Question

This map of rail diffusion in the Industrial Revolution indicates that Greece obtained railways before Italy.

Unlock Deck
Sign up to unlock the cards in this deck!
Unlock Deck
Unlock Deck
1/118
Play
Full screen (f)
Deck 11: Industry and Manufacturing
1
Outside of the three world regions where industry is concentrated, the next two largest industrial producing countries are
A) India and Pakistan.
B) Brazil and Canada.
C) Russia and Brazil.
D) China and India.
E) Brazil and India.
A) India and Pakistan.
B) Brazil and Canada.
C) Russia and Brazil.
D) China and India.
E) Brazil and India.
E
2
The Po River basin in Italy
A) contains one-fourth of the country's industry.
B) has cheaper labor compared to southern Italy and the island of Sicily.
C) has expensive hydroelectricity from the Alps but inexpensive nuclear energy from France.
D) is Southern Europe's newest industrial area.
E) has inexpensive hydroelectricity from the Alps.
E
3
This map of railway diffusion indicates that during the Industrial Revolution
A) nearly all of Eastern Europe was connected by rail in 1848.
B) rail lines connected Paris to France's southern coast by 1848.
C) France had a more comprehensive rail network than the United Kingdom in 1848.
D) Poland had no rail lines in 1848.
E) rail lines connected London to many parts of the island of Britain by 1848.
E
4
The map of East Asia's industrial areas indicates that the chief concentrations of manufacturing in the region include
A) the White River valley.
B) the river valley east of Wuhan.
C) the river valley east of Shanghai.
D) the western coast of Japan and eastern coast of Korea.
E) central China.
Unlock Deck
Unlock for access to all 118 flashcards in this deck.
Unlock Deck
k this deck
5
An analysis of this map indicates that railways
A) were not built in Russia until 1836.
B) were not built in France until 1826.
C) were not built in Russia until after 1876.
D) were built in Russia, France, and Serbia by 1856.
E) were not built in Greece until after 1876.
Unlock Deck
Unlock for access to all 118 flashcards in this deck.
Unlock Deck
k this deck
6
In the 1700s, water pollution increased significantly when the chemical industry began to contribute to the textile industry through methods of
A) bleaching and processing.
B) dyeing and purification.
C) food processing and purification.
D) bleaching and dyeing.
E) dyeing and the creation of synthetic fabrics.
A) bleaching and processing.
B) dyeing and purification.
C) food processing and purification.
D) bleaching and dyeing.
E) dyeing and the creation of synthetic fabrics.
Unlock Deck
Unlock for access to all 118 flashcards in this deck.
Unlock Deck
k this deck
7
The main source of power for steam engines and blast ovens is produced from
A) coal.
B) dross.
C) iron ore.
D) nuclear power.
E) biomass fuels.
A) coal.
B) dross.
C) iron ore.
D) nuclear power.
E) biomass fuels.
Unlock Deck
Unlock for access to all 118 flashcards in this deck.
Unlock Deck
k this deck
8
According to the map, Canada's most important industrial area is
A) Vancouver, British Columbia.
B) the St. Lawrence Valley and Ontario Peninsula.
C) the northern shore of Lake Superior.
D) the sea ports of Nova Scotia.
E) the entire southern border shared with the United States.
Unlock Deck
Unlock for access to all 118 flashcards in this deck.
Unlock Deck
k this deck
9
An analysis of this map of Europe indicates that railways
A) were more concentrated in France and Germany before they appeared in the United Kingdom.
B) tended to be built first in Eastern Europe before spreading westward.
C) were built in France before they were built in the United Kingdom.
D) in the United Kingdom first appeared near London and were later built in northern England.
E) were built in northern England before they appeared in southern England.
Unlock Deck
Unlock for access to all 118 flashcards in this deck.
Unlock Deck
k this deck
10
The cottage industry system involved manufacturing
A) of hand-made luxury goods.
B) in the home.
C) of steam engines and other cottage-sized machines.
D) in small factories.
E) cheeses and pastries.
A) of hand-made luxury goods.
B) in the home.
C) of steam engines and other cottage-sized machines.
D) in small factories.
E) cheeses and pastries.
Unlock Deck
Unlock for access to all 118 flashcards in this deck.
Unlock Deck
k this deck
11
Western Europe's principal industrial areas include all but which of the following?
A) the United Kingdom
B) the Rhine-Ruhr valley
C) the Mid-Rhine
D) Northern Italy
E) Portugal and western Spain
A) the United Kingdom
B) the Rhine-Ruhr valley
C) the Mid-Rhine
D) Northern Italy
E) Portugal and western Spain
Unlock Deck
Unlock for access to all 118 flashcards in this deck.
Unlock Deck
k this deck
12
Prior to the Industrial Revolution, industry was geographically
A) clustered.
B) concentrated.
C) dispersed.
D) random.
E) nonexistent.
A) clustered.
B) concentrated.
C) dispersed.
D) random.
E) nonexistent.
Unlock Deck
Unlock for access to all 118 flashcards in this deck.
Unlock Deck
k this deck
13
Given the earlier history of the chemical industry, we can hypothesize that its 20th-century contributions to the textile industry began to include
A) bleaching and processing.
B) dyeing and water purification.
C) food processing and purification.
D) the creation of synthetic fabrics.
E) bleaching and dyeing.
A) bleaching and processing.
B) dyeing and water purification.
C) food processing and purification.
D) the creation of synthetic fabrics.
E) bleaching and dyeing.
Unlock Deck
Unlock for access to all 118 flashcards in this deck.
Unlock Deck
k this deck
14
The Industrial Revolution began in
A) Great Britain.
B) Japan.
C) Russia.
D) the United States.
E) the Fertile Crescent.
A) Great Britain.
B) Japan.
C) Russia.
D) the United States.
E) the Fertile Crescent.
Unlock Deck
Unlock for access to all 118 flashcards in this deck.
Unlock Deck
k this deck
15
The map of East Asia's industrial areas indicates that the region's chief manufacturing bases include
A) the Rhine-Ruhr valley.
B) parts of southeastern China.
C) parts of northwestern China.
D) northern Japan.
E) South Korea.
Unlock Deck
Unlock for access to all 118 flashcards in this deck.
Unlock Deck
k this deck
16
Approximately three-fourths of the world's industrial production is concentrated in three regions, including which of the following?
A) Eastern North America and Southeast Asia
B) Eastern Europe and southern Europe
C) northwestern Europe and eastern South America
D) East Asia and Southwest Asia
E) eastern North America and northwestern Europe
A) Eastern North America and Southeast Asia
B) Eastern Europe and southern Europe
C) northwestern Europe and eastern South America
D) East Asia and Southwest Asia
E) eastern North America and northwestern Europe
Unlock Deck
Unlock for access to all 118 flashcards in this deck.
Unlock Deck
k this deck
17
The Industrial Revolution began in
A) the late 1500s.
B) the late 1600s.
C) the late 1700s.
D) the late 1800s.
E) the late 1900s.
A) the late 1500s.
B) the late 1600s.
C) the late 1700s.
D) the late 1800s.
E) the late 1900s.
Unlock Deck
Unlock for access to all 118 flashcards in this deck.
Unlock Deck
k this deck
18
The map of North America's industrial areas shows that
A) industry is dispersed evenly throughout the United States and Canada.
B) the industrial regions of California are more extensive than those of the Midwest and the Northeast combined.
C) Canada's far west and the U.S. South have become the continent's principal industrial zones.
D) Canada's industrial areas are nearly as extensive as those of the northeastern United States.
E) much of the region's industry is concentrated around or near the Great Lakes.
Unlock Deck
Unlock for access to all 118 flashcards in this deck.
Unlock Deck
k this deck
19
What mining region has the most varied mineral deposits of the world, with over 1,000 minerals?
A) the Ural mountains
B) the Tibetan plateau
C) the mountains of central Thailand
D) the Chilean Andes
E) South Africa
A) the Ural mountains
B) the Tibetan plateau
C) the mountains of central Thailand
D) the Chilean Andes
E) South Africa
Unlock Deck
Unlock for access to all 118 flashcards in this deck.
Unlock Deck
k this deck
20
The most important transportation improvement in the eighteenth century was the
A) canal.
B) automobile.
C) railroad.
D) steam engine.
E) horse collar.
A) canal.
B) automobile.
C) railroad.
D) steam engine.
E) horse collar.
Unlock Deck
Unlock for access to all 118 flashcards in this deck.
Unlock Deck
k this deck
21
A copper concentration mill tends to locate near a copper mine because it is a
A) bulk-reducing industry.
B) perishable industry.
C) bulk-gaining industry.
D) specialized manufacturer.
E) fabrication concentration point.
A) bulk-reducing industry.
B) perishable industry.
C) bulk-gaining industry.
D) specialized manufacturer.
E) fabrication concentration point.
Unlock Deck
Unlock for access to all 118 flashcards in this deck.
Unlock Deck
k this deck
22
Proximity to Russian consumers is the most significant industrial asset of which region?
A) Moscow
B) Kuznetsk
C) Urals
D) Volga
E) Kamchatka
A) Moscow
B) Kuznetsk
C) Urals
D) Volga
E) Kamchatka
Unlock Deck
Unlock for access to all 118 flashcards in this deck.
Unlock Deck
k this deck
23
The shift in steel production locations in the United States from the mid-nineteenth century until the mid-twentieth century can best be described as
A) starting in the Pittsburgh area and then migrating towards the Midwest before ending up on the East and West coasts, as well as the Chicago area.
B) starting in the Pittsburgh area and then migrating towards the East and West coasts before moving to the South and Southeast.
C) starting on the East and West coasts and then migrating towards the Midwest before ending up in the Pittsburgh area, as indicated by the football team called the Pittsburgh Steelers.
D) starting on the East and West coasts and then migrating towards Pittsburgh before ending in the Midwest.
E) starting in the Midwest and then migrating towards Pittsburgh before ending up on the East and West coasts.
Unlock Deck
Unlock for access to all 118 flashcards in this deck.
Unlock Deck
k this deck
24
Minimills are more likely than integrated steel mills to select locations because of access to
A) government subsidies.
B) unskilled labor.
C) markets.
D) raw materials.
E) fluid capital.
A) government subsidies.
B) unskilled labor.
C) markets.
D) raw materials.
E) fluid capital.
Unlock Deck
Unlock for access to all 118 flashcards in this deck.
Unlock Deck
k this deck
25
Producers of automobiles select assembly plant locations primarily for their closer access to
A) government subsidies.
B) labor markets.
C) markets for finished automobiles.
D) raw materials.
E) water transportation.
A) government subsidies.
B) labor markets.
C) markets for finished automobiles.
D) raw materials.
E) water transportation.
Unlock Deck
Unlock for access to all 118 flashcards in this deck.
Unlock Deck
k this deck
26
Fabricated metal production is an example of a
A) perishable industry.
B) specialized industry.
C) bulk-gaining industry.
D) communications-oriented industry.
E) labor intensive industry.
A) perishable industry.
B) specialized industry.
C) bulk-gaining industry.
D) communications-oriented industry.
E) labor intensive industry.
Unlock Deck
Unlock for access to all 118 flashcards in this deck.
Unlock Deck
k this deck
27
Situation costs are critical to a firm that wishes to
A) avoid skilled laborers.
B) minimize production costs inside the plant.
C) minimize transport costs.
D) identify unique characteristics of a particular industry.
E) utilize a new technology.
A) avoid skilled laborers.
B) minimize production costs inside the plant.
C) minimize transport costs.
D) identify unique characteristics of a particular industry.
E) utilize a new technology.
Unlock Deck
Unlock for access to all 118 flashcards in this deck.
Unlock Deck
k this deck
28
The U.S. steel industry moved westward in the nineteenth century primarily because of better access to
A) coal.
B) iron ore.
C) labor.
D) transport.
E) markets.
A) coal.
B) iron ore.
C) labor.
D) transport.
E) markets.
Unlock Deck
Unlock for access to all 118 flashcards in this deck.
Unlock Deck
k this deck
29
The step of the copper production process that involves the crushing and grinding of particles is
A) concentration.
B) refining.
C) mining.
D) smelting.
E) transportation.
A) concentration.
B) refining.
C) mining.
D) smelting.
E) transportation.
Unlock Deck
Unlock for access to all 118 flashcards in this deck.
Unlock Deck
k this deck
30
An analysis of this map of the copper industry in the United States indicates that
A) New Mexico has more foundries than Texas.
B) more copper is mined in Utah than in Arizona, Nevada, and Montana.
C) the largest numbers of foundries are in California, Illinois, Ohio, and Pennsylvania.
D) the largest numbers of foundries are in California, Illinois, Arizona, Texas, Florida, and Oregon.
E) the largest numbers of foundries are in Arizona, Nevada, New Mexico, and Montana.
Unlock Deck
Unlock for access to all 118 flashcards in this deck.
Unlock Deck
k this deck
31
New U.S. automobile assembly plants have been built primarily in the
A) Midwest and South, to minimize national distribution costs and reduce labor competition.
B) Northeast and Midwest, to minimize access to labor markets and maximize access to Northeastern markets.
C) Sunbelt, to minimize labor costs.
D) West, to maximize access to Japan, South Korea, and China.
E) Southeast, to avoid winter production costs.
Unlock Deck
Unlock for access to all 118 flashcards in this deck.
Unlock Deck
k this deck
32
Metal fabrication plants are an example of a bulk-gaining industry because
A) the mills are near the mines.
B) separate parts are combined to make more complex and massive products.
C) refineries import most material from other countries.
D) parts suppliers package shipments in bulk containers for processing in the plants.
E) parts suppliers supply components with just-in-time management.
Unlock Deck
Unlock for access to all 118 flashcards in this deck.
Unlock Deck
k this deck
33
The world's chief source for copper is
A) Chile.
B) Arizona.
C) China.
D) Brazil.
E) Cuba.
A) Chile.
B) Arizona.
C) China.
D) Brazil.
E) Cuba.
Unlock Deck
Unlock for access to all 118 flashcards in this deck.
Unlock Deck
k this deck
34
Eastern North America became the continent's manufacturing center in part because it had access to the continent's
A) largest markets.
B) most extensive sources of essential raw materials.
C) newest highway systems.
D) most advantageous climate.
E) oceangoing transportation links to Asia.
A) largest markets.
B) most extensive sources of essential raw materials.
C) newest highway systems.
D) most advantageous climate.
E) oceangoing transportation links to Asia.
Unlock Deck
Unlock for access to all 118 flashcards in this deck.
Unlock Deck
k this deck
35
The only step of the copper production process that is not significantly bulk-reducing is
A) refining.
B) concentration.
C) mining.
D) smelting.
E) ore extraction.
A) refining.
B) concentration.
C) mining.
D) smelting.
E) ore extraction.
Unlock Deck
Unlock for access to all 118 flashcards in this deck.
Unlock Deck
k this deck
36
The Chicago area became a significant asset for the Western Great Lakes region owing to its steel industries and its
A) access to the nation's transportation network.
B) large market area.
C) greater distance from raw materials essential for the steel industry.
D) skilled labor force.
E) cheap migrant labor.
A) access to the nation's transportation network.
B) large market area.
C) greater distance from raw materials essential for the steel industry.
D) skilled labor force.
E) cheap migrant labor.
Unlock Deck
Unlock for access to all 118 flashcards in this deck.
Unlock Deck
k this deck
37
An analysis of this map of the copper industry in the United States indicates that
A) New Mexico has more foundries than Texas.
B) more copper is smelted in Utah than in Arizona, Nevada, and Montana.
C) more copper is mined in Utah, Arizona, Nevada, New Mexico, and Montana.
D) the largest numbers of copper smelters are in California, Illinois, Arizona, and Florida.
E) the largest numbers of copper smelters are in California, Arizona, and Utah.
Unlock Deck
Unlock for access to all 118 flashcards in this deck.
Unlock Deck
k this deck
38
Because the motor vehicle assembly industry is typically described as a bulk-gaining industry as well as a just-in-time delivery system, the most important factor when selecting a location for a new Toyota or Honda assembly plant in the United States was
A) minimizing the cost of shipping finished vehicles to its customers.
B) minimizing the cost of shipping inputs and outputs in relation to customers.
C) maximizing delivery time to customers.
D) the location of railroads.
E) the location of waterways.
A) minimizing the cost of shipping finished vehicles to its customers.
B) minimizing the cost of shipping inputs and outputs in relation to customers.
C) maximizing delivery time to customers.
D) the location of railroads.
E) the location of waterways.
Unlock Deck
Unlock for access to all 118 flashcards in this deck.
Unlock Deck
k this deck
39
In addition to integrated mills, about one-fourth of U.S. steel production is now attributed to
A) minimills which utilize scrap metal in many U.S. locations.
B) traditional mills in the South and Southeast.
C) minimills which have revitalized the old steel producing center of Pittsburgh.
D) nuclear-pellet generating plants in the Northeast.
E) scrap metal from materials transported to the United States from China.
Unlock Deck
Unlock for access to all 118 flashcards in this deck.
Unlock Deck
k this deck
40
Beer bottling is an example of a
A) perishable industry.
B) specialized industry.
C) bulk-gaining industry.
D) communications-oriented industry.
E) labor intensive industry.
A) perishable industry.
B) specialized industry.
C) bulk-gaining industry.
D) communications-oriented industry.
E) labor intensive industry.
Unlock Deck
Unlock for access to all 118 flashcards in this deck.
Unlock Deck
k this deck
41
As indicated on this map of automobile assembly plants, in an effort to reduce labor competition and thus keep wages lower, there are only
A) three plants in Tennessee, one in South Carolina, two in Mississippi, and three in Illinois.
B) three plants in the Midwest, four plants in the Northeast, and five plants in the South.
C) two plants in the Midwest and more than 20 in the South.
D) four plants in Tennessee, one in South Carolina, three in Mississippi, and three in Illinois.
E) three plants in Tennessee, three in Kentucky, one in South Carolina, and four in Mississippi.
Unlock Deck
Unlock for access to all 118 flashcards in this deck.
Unlock Deck
k this deck
42
In Western Europe, ________ has experienced the most rapid manufacturing growth since the late twentieth century, especially after joining the European Union.
A) Denmark
B) Germany
C) France
D) Italy
E) Spain
A) Denmark
B) Germany
C) France
D) Italy
E) Spain
Unlock Deck
Unlock for access to all 118 flashcards in this deck.
Unlock Deck
k this deck
43
A company which uses more than one ________ will often locate near break-of-bulk points.
A) mode of transport
B) consumer market
C) raw material
D) type of labor
E) energy supply
A) mode of transport
B) consumer market
C) raw material
D) type of labor
E) energy supply
Unlock Deck
Unlock for access to all 118 flashcards in this deck.
Unlock Deck
k this deck
44
According to this map of cotton weaving distribution, between 1 billion and 3 billion square meters of fabric are produced annually in both
A) the United States and Canada.
B) the United States and Mexico.
C) Russia and Australia.
D) China and India.
E) the United States and Egypt.
Unlock Deck
Unlock for access to all 118 flashcards in this deck.
Unlock Deck
k this deck
45
In order to become a global industrial power, Japan had to overcome which of the following problems?
A) high labor costs
B) abundant energy sources
C) distance from consumers
D) weak consumer demand
E) proximity to China
A) high labor costs
B) abundant energy sources
C) distance from consumers
D) weak consumer demand
E) proximity to China
Unlock Deck
Unlock for access to all 118 flashcards in this deck.
Unlock Deck
k this deck
46
As indicated on this map, the world leaders in blouse production include the United States, China,
A) Russia, South Africa, and Australia.
B) Pakistan, and India.
C) Egypt, Bulgaria, Romania, and Turkey.
D) Mexico, South Africa, and Australia.
E) Egypt, Spain, and Brazil.
Unlock Deck
Unlock for access to all 118 flashcards in this deck.
Unlock Deck
k this deck
47
As a country's per capita income increases, its per capita carbon dioxide emissions
A) also decrease.
B) also increase.
C) begin to decrease, at first slowly and then rapidly.
D) remain about the same.
E) increase for a few years, then remain stable, and then begin to decrease.
A) also decrease.
B) also increase.
C) begin to decrease, at first slowly and then rapidly.
D) remain about the same.
E) increase for a few years, then remain stable, and then begin to decrease.
Unlock Deck
Unlock for access to all 118 flashcards in this deck.
Unlock Deck
k this deck
48
According to these charts, the U.S. share of global steel production
A) decreased from 30 percent in 1980 to 18 percent in 2010.
B) decreased from 44 percent in 1980 to 7 percent in 2010.
C) increased from 16 percent in 1980 to 19 percent in 2010.
D) decreased from 16 percent in 1980 to 8 percent in 2010.
E) decreased from 16 percent in 1980 to 6 percent in 2010.
Unlock Deck
Unlock for access to all 118 flashcards in this deck.
Unlock Deck
k this deck
49
Containerization was developed to facilitate long-distance transport by ________ before transferring to trucks and trains.
A) truck
B) train
C) ship
D) airplane
E) rocket
A) truck
B) train
C) ship
D) airplane
E) rocket
Unlock Deck
Unlock for access to all 118 flashcards in this deck.
Unlock Deck
k this deck
50
Despite the risks to the environment, the U.S. Gulf Coast has become an important industrial area because of
A) shrimp trawling and seafood processing.
B) just-in-time inventory management.
C) proximity to markets in Southwest Asia.
D) access to oil imports from Mexico and Venezuela.
E) access to oil and natural gas fields.
A) shrimp trawling and seafood processing.
B) just-in-time inventory management.
C) proximity to markets in Southwest Asia.
D) access to oil imports from Mexico and Venezuela.
E) access to oil and natural gas fields.
Unlock Deck
Unlock for access to all 118 flashcards in this deck.
Unlock Deck
k this deck
51
According to these pie charts, between 1980 and 2010 the share of global steel production from developing countries
A) increased from 7 percent to 44 percent.
B) increased from 14 percent to 19 percent of the total, if Russia is considered a developing country.
C) increased from 5 percent to 23 percent of the total, if Russia is considered a developing country.
D) decreased from 68 percent to 21 percent, if Russia is considered a developing country.
E) increased from 21 percent to 68 percent of the total, if Russia is considered a developing country.
Unlock Deck
Unlock for access to all 118 flashcards in this deck.
Unlock Deck
k this deck
52
Although transportation costs rise because breaks in transportation, we can surmise that over very long distances the lowest-cost form of transporting goods is by
A) truck.
B) train.
C) ship.
D) airplane.
E) rocket.
A) truck.
B) train.
C) ship.
D) airplane.
E) rocket.
Unlock Deck
Unlock for access to all 118 flashcards in this deck.
Unlock Deck
k this deck
53
According to this graph, carbon dioxide emissions were approximately 300 PPM
A) in the year 1900 and 400 PPM in the year 2000.
B) in the year 1900 and 375 PPM in the year 2000.
C) in the year 1980 and 375 PPM in the year 2000.
D) in the year 1900 and 350 PPM in the year 2000.
E) in the year 1950 and 400 PPM in the year 1980.
Unlock Deck
Unlock for access to all 118 flashcards in this deck.
Unlock Deck
k this deck
54
According to this map of cotton yarn production, after China, India, and Pakistan the world leaders in yarn production include
A) Argentina, Russia, and Australia.
B) Argentina, Brazil, Peru, Egypt, the United States, Turkey, Russia, and Australia.
C) Egypt, France, Germany, Belgium, and Poland.
D) Argentina, the United States, Iraq, Iran, and Russia.
E) Argentina, the United States, Turkey, Kazakhstan, and Russia.
Unlock Deck
Unlock for access to all 118 flashcards in this deck.
Unlock Deck
k this deck
55
The Tennessee Valley Authority brought
A) temporary relief in the form of government construction jobs to people in Tennessee in the 1920s and 1930s.
B) irrigation systems to much of the rural South in the 1930s.
C) electricity to much of the rural South, Midwest, and East Coast in the 1930s.
D) electricity to much of the rural South in the 1930s.
E) electricity to much of the rural West, South, and Midwest in the 1930s.
Unlock Deck
Unlock for access to all 118 flashcards in this deck.
Unlock Deck
k this deck
56
Both Europe and the United States have seen interregional shifts of manufacturing, but one difference is
A) in the United States, government policies have encouraged relocation.
B) in Europe, government policies have encouraged relocation.
C) the concentration of industries in Europe and diffusion in the United States.
D) the concentration of industries in the United States and diffusion in Europe.
E) movement to the west in Europe and to the east in the United States.
Unlock Deck
Unlock for access to all 118 flashcards in this deck.
Unlock Deck
k this deck
57
Compared to other industries, aluminum manufacturers are more likely to locate near sources of
A) low-cost labor.
B) low-cost coal-fired power plants.
C) low-cost hydroelectricity.
D) aluminum oxide.
E) fluid capital and transportation infrastructure.
A) low-cost labor.
B) low-cost coal-fired power plants.
C) low-cost hydroelectricity.
D) aluminum oxide.
E) fluid capital and transportation infrastructure.
Unlock Deck
Unlock for access to all 118 flashcards in this deck.
Unlock Deck
k this deck
58
Although many factory laborers in MDCs are paid $________ per hour, factory laborers in LDCs may be paid less than $________ per hour.
A) 35; 1
B) 75; 15
C) 35; 10
D) 100; 20
E) 45; 2
A) 35; 1
B) 75; 15
C) 35; 10
D) 100; 20
E) 45; 2
Unlock Deck
Unlock for access to all 118 flashcards in this deck.
Unlock Deck
k this deck
59
The average temperature of Earth's surface has increased by about
A) 2°C since 1980.
B) 1°C since 1880.
C) 2°C since 1880.
D) 3°C since 1880.
E) 2°C since 1680.
A) 2°C since 1980.
B) 1°C since 1880.
C) 2°C since 1880.
D) 3°C since 1880.
E) 2°C since 1680.
Unlock Deck
Unlock for access to all 118 flashcards in this deck.
Unlock Deck
k this deck
60
As indicated on the map of minimill facilities in the U.S.,
A) minimills are primarily situated close to Northeastern markets.
B) most Nucor operations are concentrated in Mississippi, California, Illinois, Kentucky, and Maine.
C) most Nucor operations are concentrated in Mississippi, Alabama, North Carolina, and Florida.
D) minimills operate in nearly every U.S. state.
E) Nucor has operations in at least 20 different states.
Unlock Deck
Unlock for access to all 118 flashcards in this deck.
Unlock Deck
k this deck
61
Wood became the main energy source during the Industrial Revolution due to overuse and depletion of coal reserves.
Unlock Deck
Unlock for access to all 118 flashcards in this deck.
Unlock Deck
k this deck
62
Industry is uniformly distributed across Earth.
Unlock Deck
Unlock for access to all 118 flashcards in this deck.
Unlock Deck
k this deck
63
Mexico's maquiladora plants
A) are distributed evenly across central Mexico.
B) rely on high tariffs that suppress U.S. sales.
C) are using obsolete production processes compared with most U.S. assembly plants.
D) may be taking advantage of lax environmental enforcement.
E) cannot find enough laborers to manufacture products in northern Mexico.
Unlock Deck
Unlock for access to all 118 flashcards in this deck.
Unlock Deck
k this deck
64
The invention of the steam engine in 1769 by James Watt is considered the most important invention for the development of factories at the beginning of the Industrial Revolution.
Unlock Deck
Unlock for access to all 118 flashcards in this deck.
Unlock Deck
k this deck
65
An analysis of these maps showing changes in U.S. manufacturing from 1950 to 2010 indicates that
A) the percentage of manufacturing jobs increased in California.
B) the percentage of manufacturing jobs decreased only in the Midwest and Northeast.
C) the number of manufacturing jobs increased only in "right-to-work" states.
D) the number of manufacturing jobs increased markedly in Ohio, Michigan, New York, and Pennsylvania.
E) the number of manufacturing jobs decreased markedly in Ohio, Michigan, New York, and Pennsylvania.
Unlock Deck
Unlock for access to all 118 flashcards in this deck.
Unlock Deck
k this deck
66
Twenty-three U.S. states have so-called "right-to-work" laws that
A) are more numerous and anti-union in northern states than in southern states.
B) send a powerful signal to employers that workers have the right to join a labor union, whether or not this unionization might cause inconveniences for management.
C) make it much more difficult for employers to limit wages, cut health benefits, and stop unions from forming.
D) fight the efforts of factory management to break unions and keep future unions from forming.
E) cause a great deal of trouble for labor unions attempting to organize workers and bargain with employers.
Unlock Deck
Unlock for access to all 118 flashcards in this deck.
Unlock Deck
k this deck
67
The Rhine-Ruhr River valley in Europe is near large deposits of coal.
Unlock Deck
Unlock for access to all 118 flashcards in this deck.
Unlock Deck
k this deck
68
The chart on manufacturing value as a percentage of GDP indicates that the share of manufacturing in developed countries
A) began to be surpassed by manufacturing in developing countries in the mid-1990s.
B) was less than manufacturing in developing countries in the mid-1970s.
C) was greater than manufacturing in developing countries in the late 1980s.
D) was roughly equal to manufacturing in developing countries in the early 1990s.
E) was roughly equal to manufacturing in developing countries in the early 1980s.
Unlock Deck
Unlock for access to all 118 flashcards in this deck.
Unlock Deck
k this deck
69
This chart regarding U.S.-made clothing indicates that the percentage of U.S.-made blouses and skirts being sold
A) decreased from about 38 percent in 2000 to about 3 percent in 2010.
B) decreased from about 25 percent in 2000 to about 5 percent in 2010.
C) decreased from about 25 percent in 2000 to about 3 percent in 2010.
D) decreased from about 30 percent in 2000 to about 1 percent in 2010.
E) decreased from about 32 percent in 2000 to about 3 percent in 2010.
Unlock Deck
Unlock for access to all 118 flashcards in this deck.
Unlock Deck
k this deck
70
Mexico's maquiladora plants
A) must operate far from the U.S.-Mexico border.
B) employ more than five million laborers.
C) have an advantage of proximity to Latin American markets.
D) have an advantage of proximity to U.S. markets.
E) have grown in number as factories have been closed in China.
A) must operate far from the U.S.-Mexico border.
B) employ more than five million laborers.
C) have an advantage of proximity to Latin American markets.
D) have an advantage of proximity to U.S. markets.
E) have grown in number as factories have been closed in China.
Unlock Deck
Unlock for access to all 118 flashcards in this deck.
Unlock Deck
k this deck
71
About three-fourths of world industrial production is clustered in three regions.
Unlock Deck
Unlock for access to all 118 flashcards in this deck.
Unlock Deck
k this deck
72
This map of rail diffusion in the Industrial Revolution indicates that Germany was served by several rail lines by 1848.
Unlock Deck
Unlock for access to all 118 flashcards in this deck.
Unlock Deck
k this deck
73
What two location factors influence more industries to remain in the northeastern United States and northwestern Europe?
A) global communications and fluid capital
B) cheap labor and high consumer demand
C) availability of raw materials and cheap energy
D) fluid capital and advantageous tariffs
E) skilled labor and rapid delivery to market
A) global communications and fluid capital
B) cheap labor and high consumer demand
C) availability of raw materials and cheap energy
D) fluid capital and advantageous tariffs
E) skilled labor and rapid delivery to market
Unlock Deck
Unlock for access to all 118 flashcards in this deck.
Unlock Deck
k this deck
74
In contrast to Fordist production, Post-Fordist production is more likely to
A) introduce more flexible work rules.
B) place more importance on site factors.
C) assign each worker one task.
D) include repetitive tasks.
E) require larger inventories of parts and components.
A) introduce more flexible work rules.
B) place more importance on site factors.
C) assign each worker one task.
D) include repetitive tasks.
E) require larger inventories of parts and components.
Unlock Deck
Unlock for access to all 118 flashcards in this deck.
Unlock Deck
k this deck
75
An analysis of these maps showing changes in U.S. manufacturing from 1950 to 2010 indicates that
A) the percentage of manufacturing jobs remained largely unchanged.
B) the number of manufacturing jobs increased in nearly all "right-to-work" states.
C) the number of manufacturing jobs in Indiana increased when it became a "right-to-work" state.
D) the number of manufacturing jobs increased in most "right-to-work" states and decreased in most other states.
E) the number of manufacturing jobs increased in California and Colorado, which are not "right-to-work" states.
Unlock Deck
Unlock for access to all 118 flashcards in this deck.
Unlock Deck
k this deck
76
Maintaining control over all phases of a highly complex production process, as opposed to outsourcing, is known as
A) vertical integration.
B) the new international division of labor.
C) convergence.
D) right-to-work.
E) outsourcing.
A) vertical integration.
B) the new international division of labor.
C) convergence.
D) right-to-work.
E) outsourcing.
Unlock Deck
Unlock for access to all 118 flashcards in this deck.
Unlock Deck
k this deck
77
Prior to the Industrial Revolution, cottage industries were most common.
Unlock Deck
Unlock for access to all 118 flashcards in this deck.
Unlock Deck
k this deck
78
The dominant industrial power in the nineteenth century was Great Britain.
Unlock Deck
Unlock for access to all 118 flashcards in this deck.
Unlock Deck
k this deck
79
The new international division of labor reflects the growing importance of
A) outsourcing.
B) vertical integration.
C) access to raw materials.
D) new infrastructure.
E) just-in-time inventory management.
A) outsourcing.
B) vertical integration.
C) access to raw materials.
D) new infrastructure.
E) just-in-time inventory management.
Unlock Deck
Unlock for access to all 118 flashcards in this deck.
Unlock Deck
k this deck
80
This map of rail diffusion in the Industrial Revolution indicates that Greece obtained railways before Italy.
Unlock Deck
Unlock for access to all 118 flashcards in this deck.
Unlock Deck
k this deck
Unlock Deck
Unlock for access to all 118 flashcards in this deck.


