Deck 2: The Economic Problem
Full screen (f)
Question
Question
Question
Question
Question
Use the figure below to answer the following questions.
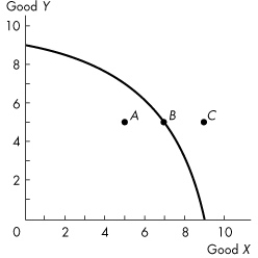 Figure 2.1.1
Refer to the production possibilities frontier in Figure 2.1.1.Which one of the following statements is true about point A?
A)It is unattainable.
B)It is preferred to point B.
C)Although no more of good Y can be produced, more of good X can be produced.
D)Although no more of good X can be produced, more of good Y can be produced.
E)Resources are either unused or misallocated or both.
Figure 2.1.1Refer to the production possibilities frontier in Figure 2.1.1.Which one of the following statements is true about point A?
A)It is unattainable.
B)It is preferred to point B.
C)Although no more of good Y can be produced, more of good X can be produced.
D)Although no more of good X can be produced, more of good Y can be produced.
E)Resources are either unused or misallocated or both.
Question
Question
Figure 2.1.1Complete the following sentence.In Figure 2.1.1,
A)some resources must be unused at point C.
B)movement from A to B would require a technological advance.
C)point B is a point of production efficiency.
D)the concept of decreasing opportunity cost is illustrated.
E)movement from C to B would require a technological improvement.
Question
Question
Question
Question
Question
Question
Question
Figure 2.1.1Refer to the production possibilities frontier in Figure 2.1.1.Which one of the following is true about point C?
A)It is attainable and inefficient.
B)It is unattainable.
C)It is attainable only if the opportunity cost of producing X increases.
D)It is attainable only if the opportunity cost of producing X decreases.
E)It is efficient and attainable.
Question
Question
Question
Question
Question
Question
Question
Use the figure below to answer the following questions.
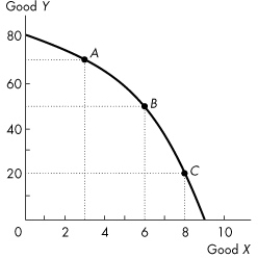 Figure 2.1.2
Refer to the production possibilities frontier in Figure 2.1.2.Suppose that 50 units of Y are produced.Then
A)resources are not being fully utilized.
B)9 units of X can be produced if all resources are used and assigned to the task for which they are the best match.
C)7 units of X are being produced.
D)6 units of X can be produced if all resources are used and assigned to the task for which they are the best match.
E)6 units of X are being produced.
Figure 2.1.2Refer to the production possibilities frontier in Figure 2.1.2.Suppose that 50 units of Y are produced.Then
A)resources are not being fully utilized.
B)9 units of X can be produced if all resources are used and assigned to the task for which they are the best match.
C)7 units of X are being produced.
D)6 units of X can be produced if all resources are used and assigned to the task for which they are the best match.
E)6 units of X are being produced.
Question
Figure 2.1.2Consider the production possibilities frontier in Figure 2.1.2.Which of the following statements is false?
A)Points inside the production possibilities frontier indicate wasted or misallocated resources.
B)The opportunity cost of producing X increases as production of X increases.
C)The opportunity cost of producing Y increases as production of Y increases.
D)Resources are not equally useful in the production of X and Y.
E)Production at point A shifts the production possibilities frontier outward.
Question
Use the figure below to answer the following questions.
Figure 2.1.2
Refer to the production possibilities frontier in Figure 2.1.2.At point C, what is the opportunity cost of increasing the production of Y from 20 to 50 units?
A)2 units of X
B)30 units of Y
C)20 units of Y
D)6 units of X
E)8 units of X
Figure 2.1.2Refer to the production possibilities frontier in Figure 2.1.2.At point C, what is the opportunity cost of increasing the production of Y from 20 to 50 units?
A)2 units of X
B)30 units of Y
C)20 units of Y
D)6 units of X
E)8 units of X
Question
Question
Question
Use the figure below to answer the following questions.
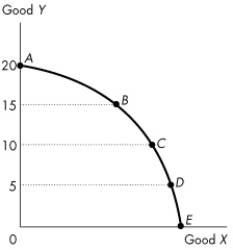 Figure 2.1.3
Figure 2.1.3 illustrates Mary's production possibilities frontier.If Mary wants to move from point B to point C, Mary must
A)give up some of good X to obtain more of good Y.
B)increase capital.
C)improve technology.
D)pay more for her factors of production.
E)give up some of good Y to obtain more of good X.
Figure 2.1.3Figure 2.1.3 illustrates Mary's production possibilities frontier.If Mary wants to move from point B to point C, Mary must
A)give up some of good X to obtain more of good Y.
B)increase capital.
C)improve technology.
D)pay more for her factors of production.
E)give up some of good Y to obtain more of good X.
Question
Use the figure below to answer the following questions.
Figure 2.1.2
Refer to the production possibilities frontier in Figure 2.1.2.At point A, the opportunity cost of producing 3 more units of X is
A)zero units of Y.
B)30 units of Y.
C)20 units of Y.
D)10 units of Y.
E)3 units of X.
Figure 2.1.2Refer to the production possibilities frontier in Figure 2.1.2.At point A, the opportunity cost of producing 3 more units of X is
A)zero units of Y.
B)30 units of Y.
C)20 units of Y.
D)10 units of Y.
E)3 units of X.
Question
Use the figure below to answer the following questions.
Figure 2.1.2
Refer to the production possibilities frontier in Figure 2.1.2.At point C, the opportunity cost of producing one more unit of X is
A)8 units of X.
B)20 units of X.
C)20 units of Y.
D)1 unit of X.
E)1 unit of Y.
Figure 2.1.2Refer to the production possibilities frontier in Figure 2.1.2.At point C, the opportunity cost of producing one more unit of X is
A)8 units of X.
B)20 units of X.
C)20 units of Y.
D)1 unit of X.
E)1 unit of Y.
Question
Question
Question
Question
Question
Use the figure below to answer the following questions.
Figure 2.1.3
Figure 2.1.3 illustrates Mary's production possibilities frontier.If Mary wants to move from point D to point C, Mary must
A)improve technology.
B)give up some of good Y to obtain more of good X.
C)hire more workers.
D)give up some of good X to obtain more of good Y.
E)increase capital.
Figure 2.1.3Figure 2.1.3 illustrates Mary's production possibilities frontier.If Mary wants to move from point D to point C, Mary must
A)improve technology.
B)give up some of good Y to obtain more of good X.
C)hire more workers.
D)give up some of good X to obtain more of good Y.
E)increase capital.
Question
Question
Use the table below to answer the following questions.
Table 2.1.1
The following table gives points on the production possibilities frontier for goods X and Y.
Refer to Table 2.1.1.What is true at point C?
A)If 8 units of X are produced, then at most 28 units of Y can be produced.
B)If 8 units of X are produced, then at least 28 units of Y can be produced.
C)If 8 units of X are produced, then only 36 units of Y can be produced.
D)If 28 units of Y are produced, then more than 8 units of X can be produced.
E)Some resources are unemployed.
Question
Use the figure below to answer the following questions.
Figure 2.1.3
Refer to the production possibilities frontier in Figure 2.1.3.The opportunity cost of moving from C to B will be
A)less than moving from D to C but greater than moving from B to A.
B)greater than moving from D to C but less than moving from B to A.
C)the same as moving from D to C or moving from B to A.
D)greater than moving either from D to C or from B to A.
E)less than moving from E to D.
Figure 2.1.3Refer to the production possibilities frontier in Figure 2.1.3.The opportunity cost of moving from C to B will be
A)less than moving from D to C but greater than moving from B to A.
B)greater than moving from D to C but less than moving from B to A.
C)the same as moving from D to C or moving from B to A.
D)greater than moving either from D to C or from B to A.
E)less than moving from E to D.
Question
Use the figure below to answer the following questions.
Figure 2.1.2
Refer to the production possibilities frontier in Figure 2.1.2.If 6 units of X are produced, then
A)50 units of Y must be produced, regardless of resource utilization.
B)50 units of Y can be produced if all resources are used and assigned to the task for which they are the best match.
C)60 units of Y can be produced with some resources not fully used.
D)40 units of Y cannot be produced unless production of X is increased.
E)40 units of Y cannot be produced unless production of X is decreased.
Figure 2.1.2Refer to the production possibilities frontier in Figure 2.1.2.If 6 units of X are produced, then
A)50 units of Y must be produced, regardless of resource utilization.
B)50 units of Y can be produced if all resources are used and assigned to the task for which they are the best match.
C)60 units of Y can be produced with some resources not fully used.
D)40 units of Y cannot be produced unless production of X is increased.
E)40 units of Y cannot be produced unless production of X is decreased.
Question
Use the figure below to answer the following questions.
Figure 2.1.2
Refer to the production possibilities frontier in Figure 2.1.2.At point A, the opportunity cost of increasing production of Y to 80 units is
A)3 units of X.
B)10 units of Y.
C)80 units of Y.
D)1 unit of X.
E)2 units of X.
Figure 2.1.2Refer to the production possibilities frontier in Figure 2.1.2.At point A, the opportunity cost of increasing production of Y to 80 units is
A)3 units of X.
B)10 units of Y.
C)80 units of Y.
D)1 unit of X.
E)2 units of X.
Question
Question
Question
Use the figure below to answer the following question.
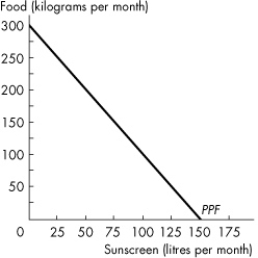 Figure 2.1.5
The graph in Figure 2.1.5 shows Sunland's PPF for food and sunscreen.Sunland faces _______ opportunity cost of food and _______ opportunity of sunscreen.
A)a decreasing; a decreasing
B)a constant; a constant
C)an increasing; an increasing
D)a decreasing; an increasing
E)an increasing; a decreasing
Figure 2.1.5The graph in Figure 2.1.5 shows Sunland's PPF for food and sunscreen.Sunland faces _______ opportunity cost of food and _______ opportunity of sunscreen.
A)a decreasing; a decreasing
B)a constant; a constant
C)an increasing; an increasing
D)a decreasing; an increasing
E)an increasing; a decreasing
Question
Use the table below to answer the following questions.
Table 2.1.1
The following table gives points on the production possibilities frontier for goods X and Y.
The data in Table 2.1.1 illustrate that
A)the opportunity cost of producing an additional unit of Y increases as the production of Y increases.
B)the producer has a comparative advantage in the production of Y.
C)the producer has a comparative advantage in the production of X.
D)the opportunity cost of producing an additional unit of Y decreases as the production of Y increases.
E)the opportunity cost of producing an additional unit of Y is constant as the production of X increases.
Question
Use the figure below to answer the following questions.
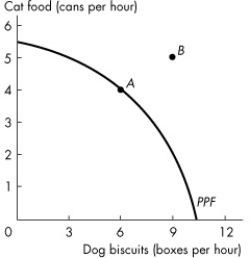 Figure 2.1.6
Figure 2.1.6 shows the production possibilities frontier for a firm that produces pet food.This PPF _______ illustrate scarcity because _______.
A)does; as more is produced, consumers must pay a higher price
B)does not; the PPF is downward sloping
C)does not; the firm can produce any quantity it wants if it is willing to charge a high enough price
D)does not; scarcity does not occur in the market for pet food
E)does; the firm cannot produce points outside the frontier, and as the firm moves along the PPF, it cannot produce more dog biscuits without producing less cat food
Figure 2.1.6Figure 2.1.6 shows the production possibilities frontier for a firm that produces pet food.This PPF _______ illustrate scarcity because _______.
A)does; as more is produced, consumers must pay a higher price
B)does not; the PPF is downward sloping
C)does not; the firm can produce any quantity it wants if it is willing to charge a high enough price
D)does not; scarcity does not occur in the market for pet food
E)does; the firm cannot produce points outside the frontier, and as the firm moves along the PPF, it cannot produce more dog biscuits without producing less cat food
Question
Question
Use the table below to answer the following questions.
Table 2.1.1
The following table gives points on the production possibilities frontier for goods X and Y.
From the data in Table 2.1.1, the production of 7 units of X and 28 units of Y is
A)unattainable.
B)attainable but leaves some resources wasted or misallocated or both.
C)on the PPF between points C and D.
D)outside the PPF.
E)on the PPF between points B and C.
Question
Use the table below to answer the following questions.
Table 2.1.1
The following table gives points on the production possibilities frontier for goods X and Y.
Refer to Table 2.1.1.As the production of X increases,
A)the production of Y increases.
B)the amount of X produced increases at an increasing rate.
C)unemployment increases.
D)the opportunity cost of each additional unit of X produced increases.
E)the opportunity cost of each additional unit of X produced decreases.
Question
Use the table below to answer the following question.
Table 2.1.4
Consider the following production possibilities for a student for the typical week:
Refer to Table 2.1.4.Complete the following sentence.The production possibilities frontier in the table shows
A)under- utilization of resources.
B)decreasing opportunity cost.
C)constant opportunity cost.
D)learning- by- doing.
E)increasing opportunity cost.
Question
Table 2.1.1
The following table gives points on the production possibilities frontier for goods X and Y.
From the data in Table 2.1.1, the production of 10 units of X and 28 units of Y is
A)inside the PPF.
B)attainable but inefficient.
C)on the production possibilities frontier between points C and D.
D)attainable but leaves some resources misallocated.
E)unattainable.
Question
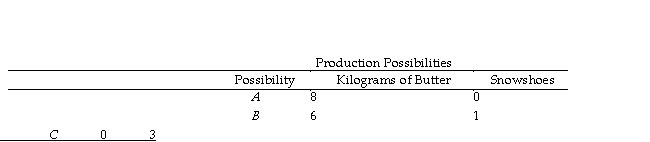
Table 2.1.2
Refer to Table 2.1.2.In moving from combination B to combination C, the opportunity cost of producing one additional snowshoe is
A)1/6 kilogram of butter.
B)2 kilograms of butter.
C)3 kilograms of butter.
D)1/2 kilogram of butter.
E)6 kilograms of butter.
Question
Question
Table 2.1.1
The following table gives points on the production possibilities frontier for goods X and Y.
The production possibilities frontier corresponding to the data in Table 2.1.1 is
A)negatively sloped and linear.
B)positively sloped and bowed outward.
C)negatively sloped and bowed outward.
D)negatively sloped and bowed inward.
E)positively sloped and linear.
Question
Use the figure below to answer the following questions.
Figure 2.1.6
Figure 2.1.6 shows the production possibilities frontier for a firm that produces pet food.Point A is and point B is _______ .
A)attainable; unattainable.
B)attainable; attainable.
C)inefficient; efficient
D)unattainable; attainable.
E)unattainable; unattainable.
Figure 2.1.6Figure 2.1.6 shows the production possibilities frontier for a firm that produces pet food.Point A is and point B is _______ .
A)attainable; unattainable.
B)attainable; attainable.
C)inefficient; efficient
D)unattainable; attainable.
E)unattainable; unattainable.
Question
Use the table below to answer the following questions.
Table 2.1.1
The following table gives points on the production possibilities frontier for goods X and Y.
The economy illustrated by the data in Table 2.1.1 exhibits
A)constant opportunity cost in the production of X.
B)increasing opportunity cost.
C)constant opportunity cost in the production of Y.
D)initially increasing, then decreasing opportunity cost.
E)decreasing opportunity cost.
Question
Use the table below to answer the following questions.
Table 2.1.1
The following table gives points on the production possibilities frontier for goods X and Y.
Refer to Table 2.1.1.The opportunity cost of increasing the production of Y from 16 to 36 units is
A)8 units of X.
B)4 units of X.
C)16 units of X.
D)12 units of X.
E)20 units of Y.
Table 2.1.1
The following table gives points on the production possibilities frontier for goods X and Y.
Refer to Table 2.1.1.The opportunity cost of increasing the production of Y from 16 to 36 units is
A)8 units of X.
B)4 units of X.
C)16 units of X.
D)12 units of X.
E)20 units of Y.
Question
Table 2.1.2
Refer to Table 2.1.2.According to this production possibilities frontier,
A)a combination of 0 kilograms of butter and 4 snowshoes is attainable.
B)the opportunity cost of producing snowshoes increases as more snowshoes are produced.
C)resources are equally useful in all activities.
D)the opportunity cost of producing snowshoes decreases as more snowshoes are produced.
E)a combination of 6 kilograms of butter and 1 snowshoe is inefficient.
Question
Use the table below to answer the following question.
Table 2.1.3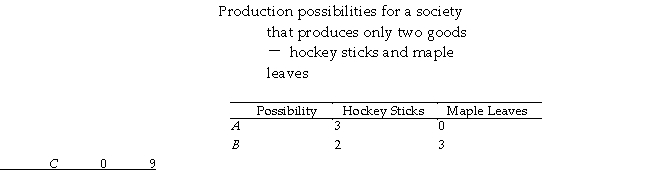
Refer to Table 2.1.3.In moving from combination C to combination B, the opportunity cost of producing one additional hockey stick is
A)1/6 maple leaves.
B)1/2 maple leaves.
C)2 maple leaves.
D)3 maple leaves.
E)6 maple leaves.
Table 2.1.3
Refer to Table 2.1.3.In moving from combination C to combination B, the opportunity cost of producing one additional hockey stick is
A)1/6 maple leaves.
B)1/2 maple leaves.
C)2 maple leaves.
D)3 maple leaves.
E)6 maple leaves.
Question
Question
Use the table below to answer the following questions.
Table 2.1.1
The following table gives points on the production possibilities frontier for goods X and Y.
Refer to Table 2.1.1.The opportunity cost of increasing the production of X from 8 to 12 units is
A)12 units of Y.
B)16 units of Y.
C)4 units of Y.
D)8 units of Y.
E)4 units of X.
Table 2.1.1
The following table gives points on the production possibilities frontier for goods X and Y.
Refer to Table 2.1.1.The opportunity cost of increasing the production of X from 8 to 12 units is
A)12 units of Y.
B)16 units of Y.
C)4 units of Y.
D)8 units of Y.
E)4 units of X.
Question
Use the figure below to answer the following question.
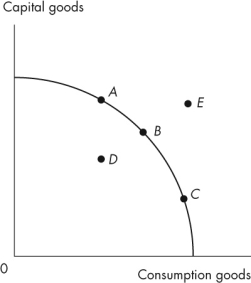 Figure 2.1.4
Refer to the production possibilities frontier in Figure 2.1.4.Which point is unattainable?
A)A
B)B
C)C
D)D
E)E
Figure 2.1.4Refer to the production possibilities frontier in Figure 2.1.4.Which point is unattainable?
A)A
B)B
C)C
D)D
E)E
Question
Question
Question
Question
Question
Question
Use the figure below to answer the following questions.
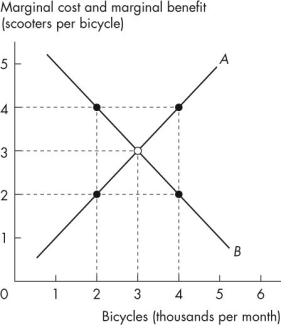 Figure 2.2.1
In Figure 2.2.1, the curve labelled A is the _______ curve and the curve labelled B is the _______ curve.
A)marginal benefit; marginal cost
B)marginal benefit; trade
C)marginal cost; trade
D)production possibilities; trade
E)marginal cost; marginal benefit
Figure 2.2.1In Figure 2.2.1, the curve labelled A is the _______ curve and the curve labelled B is the _______ curve.
A)marginal benefit; marginal cost
B)marginal benefit; trade
C)marginal cost; trade
D)production possibilities; trade
E)marginal cost; marginal benefit
Question
Use the figure below to answer the following questions.
Figure 2.2.1
In Figure 2.2.1, when 4,000 bicycles are produced each month,
A)fewer bicycles must be produced to reach the efficient level of output.
B)the marginal benefit from the 4,000th bicycle is greater than the marginal cost of the 4,000th bicycle.
C)the production of bicycles is efficient.
D)more bicycles must be produced to reach the efficient level of output.
E)the marginal benefit from the 4,000th bicycle equals the marginal cost of the 4th scooter.
Figure 2.2.1In Figure 2.2.1, when 4,000 bicycles are produced each month,
A)fewer bicycles must be produced to reach the efficient level of output.
B)the marginal benefit from the 4,000th bicycle is greater than the marginal cost of the 4,000th bicycle.
C)the production of bicycles is efficient.
D)more bicycles must be produced to reach the efficient level of output.
E)the marginal benefit from the 4,000th bicycle equals the marginal cost of the 4th scooter.
Question
Question
Use the table below to answer the following question.
Table 2.2.1

Refer to Table 2.2.1.Marginal benefit from food crops
A)equals 70 barrels of ethanol.
B)equals the marginal cost of food crops.
C)cannot be calculated from the table.
D)remains constant as the quantity of food crops increases from 1 tonne a day to 2 tonnes a day.
E)increases as the quantity of food crops increases from 1 tonne a day to 2 tonnes a day.
Table 2.2.1
Refer to Table 2.2.1.Marginal benefit from food crops
A)equals 70 barrels of ethanol.
B)equals the marginal cost of food crops.
C)cannot be calculated from the table.
D)remains constant as the quantity of food crops increases from 1 tonne a day to 2 tonnes a day.
E)increases as the quantity of food crops increases from 1 tonne a day to 2 tonnes a day.
Question
Question
Use the figure below to answer the following questions.
Figure 2.2.1
In Figure 2.2.1, the curve labelled B shows
A)the number of scooters that people must forgo to obtain another bicycle.
B)that the benefit from producing more bicycles is greater than the benefit from producing more scooters.
C)the number of bicycles that people are willing to forgo to obtain another scooter.
D)that the benefit from producing more scooters is greater than the benefit from producing more bicycles.
E)the number of scooters that people are willing to forgo to obtain another bicycle.
Figure 2.2.1In Figure 2.2.1, the curve labelled B shows
A)the number of scooters that people must forgo to obtain another bicycle.
B)that the benefit from producing more bicycles is greater than the benefit from producing more scooters.
C)the number of bicycles that people are willing to forgo to obtain another scooter.
D)that the benefit from producing more scooters is greater than the benefit from producing more bicycles.
E)the number of scooters that people are willing to forgo to obtain another bicycle.
Question
Question
Question
Question
Question
Question
Question
Question
Use the figure below to answer the following questions.
Figure 2.2.1
In Figure 2.2.1, when 2,000 bicycles are produced each month,
A)the marginal benefit from the 2,000th bicycle is greater than the marginal cost of the 2,000th bicycle.
B)the marginal benefit from the 2,000th bicycle equals the marginal cost of the second scooter.
C)fewer bicycles must be produced to reach the efficient level of output.
D)the production of bicycles is efficient.
E)the marginal benefit from the 2,000th bicycle equals the marginal cost of the 4th scooter.
Figure 2.2.1In Figure 2.2.1, when 2,000 bicycles are produced each month,
A)the marginal benefit from the 2,000th bicycle is greater than the marginal cost of the 2,000th bicycle.
B)the marginal benefit from the 2,000th bicycle equals the marginal cost of the second scooter.
C)fewer bicycles must be produced to reach the efficient level of output.
D)the production of bicycles is efficient.
E)the marginal benefit from the 2,000th bicycle equals the marginal cost of the 4th scooter.
Question
Question

Unlock Deck
Sign up to unlock the cards in this deck!
Unlock Deck
Unlock Deck
1/145
Play
Full screen (f)
Deck 2: The Economic Problem
1
If Harold can increase production of good X without decreasing production of any other good, then Harold
A)is producing inside his production possibilities frontier.
B)is producing on his production possibilities frontier.
C)prefers good X to any other good.
D)is producing outside his production possibilities frontier.
E)has a linear production possibilities frontier.
A)is producing inside his production possibilities frontier.
B)is producing on his production possibilities frontier.
C)prefers good X to any other good.
D)is producing outside his production possibilities frontier.
E)has a linear production possibilities frontier.
is producing inside his production possibilities frontier.
2
A tradeoff exists when
A)the PPF shifts outward.
B)we move from a point inside the PPF to a point on the PPF.
C)we move along the PPF.
D)the PPF shifts inward.
E)we move from a point on the PPF to a point within the PPF.
A)the PPF shifts outward.
B)we move from a point inside the PPF to a point on the PPF.
C)we move along the PPF.
D)the PPF shifts inward.
E)we move from a point on the PPF to a point within the PPF.
we move along the PPF.
3
Which of the following quotations best illustrates a tradeoff?
A)"If the firm reorganized its production process, it could produce more widgets and more gadgets."
B)"The firm has been able to lower costs due to its extensive experience in building widgets."
C)"The firm should sell more gadgets, even if it means hiring more workers."
D)"If the firm invests more in capital equipment, it can expand sales next year."
E)"The more and more gadgets the firm produces, the bigger the fall in widget production."
"The more and more gadgets the firm produces, the bigger the fall in widget production."
4
Opportunity cost of an action is
A)the highest- valued alternative forgone.
B)the best choice that can be made.
C)the absolute cost.
D)the comparative cost.
E)the money cost.
A)the highest- valued alternative forgone.
B)the best choice that can be made.
C)the absolute cost.
D)the comparative cost.
E)the money cost.
Unlock Deck
Unlock for access to all 145 flashcards in this deck.
Unlock Deck
k this deck
5
Use the figure below to answer the following questions.
Figure 2.1.1
Refer to the production possibilities frontier in Figure 2.1.1.Which one of the following statements is true about point A?
A)It is unattainable.
B)It is preferred to point B.
C)Although no more of good Y can be produced, more of good X can be produced.
D)Although no more of good X can be produced, more of good Y can be produced.
E)Resources are either unused or misallocated or both.
Figure 2.1.1Refer to the production possibilities frontier in Figure 2.1.1.Which one of the following statements is true about point A?
A)It is unattainable.
B)It is preferred to point B.
C)Although no more of good Y can be produced, more of good X can be produced.
D)Although no more of good X can be produced, more of good Y can be produced.
E)Resources are either unused or misallocated or both.
Unlock Deck
Unlock for access to all 145 flashcards in this deck.
Unlock Deck
k this deck
6
Which one of the following concepts is illustrated by a production possibilities frontier?
A)property rights
B)investment
C)profit
D)consumption
E)tradeoff
A)property rights
B)investment
C)profit
D)consumption
E)tradeoff
Unlock Deck
Unlock for access to all 145 flashcards in this deck.
Unlock Deck
k this deck
7
Figure 2.1.1Complete the following sentence.In Figure 2.1.1,
A)some resources must be unused at point C.
B)movement from A to B would require a technological advance.
C)point B is a point of production efficiency.
D)the concept of decreasing opportunity cost is illustrated.
E)movement from C to B would require a technological improvement.
Unlock Deck
Unlock for access to all 145 flashcards in this deck.
Unlock Deck
k this deck
8
If Harold must decrease production of some other good to increase production of good X, then Harold
A)has a linear production possibilities frontier.
B)is producing outside his production possibilities frontier.
C)is producing inside his production possibilities frontier.
D)is producing on his production possibilities frontier.
E)prefers good X to any other good.
A)has a linear production possibilities frontier.
B)is producing outside his production possibilities frontier.
C)is producing inside his production possibilities frontier.
D)is producing on his production possibilities frontier.
E)prefers good X to any other good.
Unlock Deck
Unlock for access to all 145 flashcards in this deck.
Unlock Deck
k this deck
9
The production possibilities frontier
A)is the boundary between what we want to consume and what we want to produce.
B)shows how production increases as prices rise.
C)is the boundary between attainable and unattainable levels of production.
D)shows prices at which production is possible and impossible.
E)illustrates why there need not be any scarcity in the world.
Unlock Deck
Unlock for access to all 145 flashcards in this deck.
Unlock Deck
k this deck
10
A point inside a production possibilities frontier
A)is unattainable.
B)indicates a point of production efficiency.
C)is preferred to a point on the production possibilities frontier.
D)indicates some wasted or misallocated resources.
E)illustrates the idea of opportunity cost.
A)is unattainable.
B)indicates a point of production efficiency.
C)is preferred to a point on the production possibilities frontier.
D)indicates some wasted or misallocated resources.
E)illustrates the idea of opportunity cost.
Unlock Deck
Unlock for access to all 145 flashcards in this deck.
Unlock Deck
k this deck
11
Ted chooses to study for his economics exam instead of going to the concert.The concert he will miss is Ted's _______ of studying for the exam.
A)opportunity cost
B)discretionary cost
C)comparative cost
D)monetary cost
E)absolute cost
A)opportunity cost
B)discretionary cost
C)comparative cost
D)monetary cost
E)absolute cost
Unlock Deck
Unlock for access to all 145 flashcards in this deck.
Unlock Deck
k this deck
12
A situation in which resources are either wasted or misallocated or both is illustrated by
A)a point above or to the right of the production possibilities frontier.
B)a point inside the production possibilities frontier.
C)any point on either the horizontal or the vertical axis.
D)a point on or inside the production possibilities frontier.
E)a point outside the production possibilities frontier.
Unlock Deck
Unlock for access to all 145 flashcards in this deck.
Unlock Deck
k this deck
13
Which one of the following concepts is not illustrated by a production possibilities frontier?
A)the tradeoff between producing one good versus another
B)attainable and unattainable points
C)opportunity cost
D)marginal benefit
E)scarcity
A)the tradeoff between producing one good versus another
B)attainable and unattainable points
C)opportunity cost
D)marginal benefit
E)scarcity
Unlock Deck
Unlock for access to all 145 flashcards in this deck.
Unlock Deck
k this deck
14
Figure 2.1.1Refer to the production possibilities frontier in Figure 2.1.1.Which one of the following is true about point C?
A)It is attainable and inefficient.
B)It is unattainable.
C)It is attainable only if the opportunity cost of producing X increases.
D)It is attainable only if the opportunity cost of producing X decreases.
E)It is efficient and attainable.
Unlock Deck
Unlock for access to all 145 flashcards in this deck.
Unlock Deck
k this deck
15
A medical clinic employs 10 workers.Each worker can produce a maximum of either 2 units of medical services or 5 units of administrative services a day.The production possibilities frontier of this firm shows
A)infinite opportunity cost.
B)constant opportunity cost.
C)increasing opportunity cost.
D)zero opportunity cost.
E)decreasing opportunity cost.
A)infinite opportunity cost.
B)constant opportunity cost.
C)increasing opportunity cost.
D)zero opportunity cost.
E)decreasing opportunity cost.
Unlock Deck
Unlock for access to all 145 flashcards in this deck.
Unlock Deck
k this deck
16
If Sam is producing at a point on his production possibilities frontier, then he
A)is unaffected by costs and technology.
B)is not subject to scarcity.
C)can produce more of both goods.
D)cannot produce any more of either good.
E)can increase the production of one good only by decreasing the production of the other.
A)is unaffected by costs and technology.
B)is not subject to scarcity.
C)can produce more of both goods.
D)cannot produce any more of either good.
E)can increase the production of one good only by decreasing the production of the other.
Unlock Deck
Unlock for access to all 145 flashcards in this deck.
Unlock Deck
k this deck
17
Production efficiency is achieved when
A)the production possibilities frontier shifts outward at a constant pace.
B)resources are not equally productive in all activities.
C)all resources are equally productive in all activities.
D)there are no tradeoffs.
E)we produce goods and services at the lowest possible cost.
A)the production possibilities frontier shifts outward at a constant pace.
B)resources are not equally productive in all activities.
C)all resources are equally productive in all activities.
D)there are no tradeoffs.
E)we produce goods and services at the lowest possible cost.
Unlock Deck
Unlock for access to all 145 flashcards in this deck.
Unlock Deck
k this deck
18
If Sam is producing at a point inside his production possibilities frontier, then he
A)must be doing the best he can with limited resources.
B)has a high opportunity cost of moving from this point.
C)is fully using all his resources and allocating his resources to their best use.
D)can increase production of both goods with zero opportunity cost.
E)is unaffected by costs and technology.
Unlock Deck
Unlock for access to all 145 flashcards in this deck.
Unlock Deck
k this deck
19
A production possibilities frontier is negatively sloped because
A)the quantity of a good purchased decreases as its price falls.
B)there is too little capital in the economy.
C)opportunity cost of production increases as more of a good is produced.
D)some resources are misallocated.
E)opportunity cost of production decreases as more of a good is produced.
A)the quantity of a good purchased decreases as its price falls.
B)there is too little capital in the economy.
C)opportunity cost of production increases as more of a good is produced.
D)some resources are misallocated.
E)opportunity cost of production decreases as more of a good is produced.
Unlock Deck
Unlock for access to all 145 flashcards in this deck.
Unlock Deck
k this deck
20
On a graph of a production possibilities frontier, opportunity cost is represented by
A)the slope of the production possibilities frontier.
B)the x- axis intercept.
C)a point on the horizontal axis.
D)a ray through the origin.
E)a point on the vertical axis.
A)the slope of the production possibilities frontier.
B)the x- axis intercept.
C)a point on the horizontal axis.
D)a ray through the origin.
E)a point on the vertical axis.
Unlock Deck
Unlock for access to all 145 flashcards in this deck.
Unlock Deck
k this deck
21
Use the figure below to answer the following questions.
Figure 2.1.2
Refer to the production possibilities frontier in Figure 2.1.2.Suppose that 50 units of Y are produced.Then
A)resources are not being fully utilized.
B)9 units of X can be produced if all resources are used and assigned to the task for which they are the best match.
C)7 units of X are being produced.
D)6 units of X can be produced if all resources are used and assigned to the task for which they are the best match.
E)6 units of X are being produced.
Figure 2.1.2Refer to the production possibilities frontier in Figure 2.1.2.Suppose that 50 units of Y are produced.Then
A)resources are not being fully utilized.
B)9 units of X can be produced if all resources are used and assigned to the task for which they are the best match.
C)7 units of X are being produced.
D)6 units of X can be produced if all resources are used and assigned to the task for which they are the best match.
E)6 units of X are being produced.
Unlock Deck
Unlock for access to all 145 flashcards in this deck.
Unlock Deck
k this deck
22
Figure 2.1.2Consider the production possibilities frontier in Figure 2.1.2.Which of the following statements is false?
A)Points inside the production possibilities frontier indicate wasted or misallocated resources.
B)The opportunity cost of producing X increases as production of X increases.
C)The opportunity cost of producing Y increases as production of Y increases.
D)Resources are not equally useful in the production of X and Y.
E)Production at point A shifts the production possibilities frontier outward.
Unlock Deck
Unlock for access to all 145 flashcards in this deck.
Unlock Deck
k this deck
23
Use the figure below to answer the following questions.
Figure 2.1.2
Refer to the production possibilities frontier in Figure 2.1.2.At point C, what is the opportunity cost of increasing the production of Y from 20 to 50 units?
A)2 units of X
B)30 units of Y
C)20 units of Y
D)6 units of X
E)8 units of X
Figure 2.1.2Refer to the production possibilities frontier in Figure 2.1.2.At point C, what is the opportunity cost of increasing the production of Y from 20 to 50 units?
A)2 units of X
B)30 units of Y
C)20 units of Y
D)6 units of X
E)8 units of X
Unlock Deck
Unlock for access to all 145 flashcards in this deck.
Unlock Deck
k this deck
24
If opportunity costs are increasing, then the production possibilities frontier is
A)a vertical line.
B)bowed outward with a negative slope.
C)a negatively sloped straight line.
D)a positively sloped straight line.
E)bowed outward with a positive slope.
A)a vertical line.
B)bowed outward with a negative slope.
C)a negatively sloped straight line.
D)a positively sloped straight line.
E)bowed outward with a positive slope.
Unlock Deck
Unlock for access to all 145 flashcards in this deck.
Unlock Deck
k this deck
25
A medical clinic employs 10 workers.Each worker can produce a maximum of either 2 units of medical services or 5 units of administrative services a day.One day, the clinic decides to produce 16 units of medical services and 5 units of administrative services.This output level is
A)unattainable.
B)inefficient.
C)efficient.
D)on the clinic's PPF.
E)attainable and efficient.
A)unattainable.
B)inefficient.
C)efficient.
D)on the clinic's PPF.
E)attainable and efficient.
Unlock Deck
Unlock for access to all 145 flashcards in this deck.
Unlock Deck
k this deck
26
Use the figure below to answer the following questions.
Figure 2.1.3
Figure 2.1.3 illustrates Mary's production possibilities frontier.If Mary wants to move from point B to point C, Mary must
A)give up some of good X to obtain more of good Y.
B)increase capital.
C)improve technology.
D)pay more for her factors of production.
E)give up some of good Y to obtain more of good X.
Figure 2.1.3Figure 2.1.3 illustrates Mary's production possibilities frontier.If Mary wants to move from point B to point C, Mary must
A)give up some of good X to obtain more of good Y.
B)increase capital.
C)improve technology.
D)pay more for her factors of production.
E)give up some of good Y to obtain more of good X.
Unlock Deck
Unlock for access to all 145 flashcards in this deck.
Unlock Deck
k this deck
27
Use the figure below to answer the following questions.
Figure 2.1.2
Refer to the production possibilities frontier in Figure 2.1.2.At point A, the opportunity cost of producing 3 more units of X is
A)zero units of Y.
B)30 units of Y.
C)20 units of Y.
D)10 units of Y.
E)3 units of X.
Figure 2.1.2Refer to the production possibilities frontier in Figure 2.1.2.At point A, the opportunity cost of producing 3 more units of X is
A)zero units of Y.
B)30 units of Y.
C)20 units of Y.
D)10 units of Y.
E)3 units of X.
Unlock Deck
Unlock for access to all 145 flashcards in this deck.
Unlock Deck
k this deck
28
Use the figure below to answer the following questions.
Figure 2.1.2
Refer to the production possibilities frontier in Figure 2.1.2.At point C, the opportunity cost of producing one more unit of X is
A)8 units of X.
B)20 units of X.
C)20 units of Y.
D)1 unit of X.
E)1 unit of Y.
Figure 2.1.2Refer to the production possibilities frontier in Figure 2.1.2.At point C, the opportunity cost of producing one more unit of X is
A)8 units of X.
B)20 units of X.
C)20 units of Y.
D)1 unit of X.
E)1 unit of Y.
Unlock Deck
Unlock for access to all 145 flashcards in this deck.
Unlock Deck
k this deck
29
If additional units of any good can be produced at a constant opportunity cost, the production possibilities frontier is
A)positively sloped and linear.
B)bowed inward and negatively sloped.
C)linear and negatively sloped.
D)bowed outward and negatively sloped.
E)horizontal.
A)positively sloped and linear.
B)bowed inward and negatively sloped.
C)linear and negatively sloped.
D)bowed outward and negatively sloped.
E)horizontal.
Unlock Deck
Unlock for access to all 145 flashcards in this deck.
Unlock Deck
k this deck
30
The fact that resources are not equally productive in all activities
A)implies that gains from specialization and trade are unlikely.
B)implies a linear production possibilities frontier.
C)follows from the law of demand.
D)implies that an economy should not produce certain goods.
E)implies that a production possibilities frontier will be bowed outward.
A)implies that gains from specialization and trade are unlikely.
B)implies a linear production possibilities frontier.
C)follows from the law of demand.
D)implies that an economy should not produce certain goods.
E)implies that a production possibilities frontier will be bowed outward.
Unlock Deck
Unlock for access to all 145 flashcards in this deck.
Unlock Deck
k this deck
31
A medical clinic employs 10 workers.Each worker can produce a maximum of either 2 units of medical services or 5 units of administrative services a day.The opportunity cost of one more unit of medical services is
A)5 units of administrative services.
B)0.4 units of administrative services.
C)1 unit of medical services.
D)2 units of administrative services.
E)2.5 units of administrative services.
A)5 units of administrative services.
B)0.4 units of administrative services.
C)1 unit of medical services.
D)2 units of administrative services.
E)2.5 units of administrative services.
Unlock Deck
Unlock for access to all 145 flashcards in this deck.
Unlock Deck
k this deck
32
The bowed- out concave) shape of a production possibilities frontier illustrates
A)the equal usefulness of resources in all activities.
B)increasing opportunity cost.
C)capital accumulation.
D)decreasing opportunity cost.
E)technological change.
A)the equal usefulness of resources in all activities.
B)increasing opportunity cost.
C)capital accumulation.
D)decreasing opportunity cost.
E)technological change.
Unlock Deck
Unlock for access to all 145 flashcards in this deck.
Unlock Deck
k this deck
33
Use the figure below to answer the following questions.
Figure 2.1.3
Figure 2.1.3 illustrates Mary's production possibilities frontier.If Mary wants to move from point D to point C, Mary must
A)improve technology.
B)give up some of good Y to obtain more of good X.
C)hire more workers.
D)give up some of good X to obtain more of good Y.
E)increase capital.
Figure 2.1.3Figure 2.1.3 illustrates Mary's production possibilities frontier.If Mary wants to move from point D to point C, Mary must
A)improve technology.
B)give up some of good Y to obtain more of good X.
C)hire more workers.
D)give up some of good X to obtain more of good Y.
E)increase capital.
Unlock Deck
Unlock for access to all 145 flashcards in this deck.
Unlock Deck
k this deck
34
A medical clinic employs 10 workers.Each worker can produce a maximum of either 2 units of medical services or 5 units of administrative services a day.One day, the clinic decides to produce 10 units of medical services and 30 units of administrative services.This output level is
A)unattainable.
B)on the clinic's PPF.
C)efficient.
D)inefficient.
E)attainable if each worker specializes in one service.
A)unattainable.
B)on the clinic's PPF.
C)efficient.
D)inefficient.
E)attainable if each worker specializes in one service.
Unlock Deck
Unlock for access to all 145 flashcards in this deck.
Unlock Deck
k this deck
35
Use the table below to answer the following questions.
Table 2.1.1
The following table gives points on the production possibilities frontier for goods X and Y.
Refer to Table 2.1.1.What is true at point C?
A)If 8 units of X are produced, then at most 28 units of Y can be produced.
B)If 8 units of X are produced, then at least 28 units of Y can be produced.
C)If 8 units of X are produced, then only 36 units of Y can be produced.
D)If 28 units of Y are produced, then more than 8 units of X can be produced.
E)Some resources are unemployed.
Unlock Deck
Unlock for access to all 145 flashcards in this deck.
Unlock Deck
k this deck
36
Use the figure below to answer the following questions.
Figure 2.1.3
Refer to the production possibilities frontier in Figure 2.1.3.The opportunity cost of moving from C to B will be
A)less than moving from D to C but greater than moving from B to A.
B)greater than moving from D to C but less than moving from B to A.
C)the same as moving from D to C or moving from B to A.
D)greater than moving either from D to C or from B to A.
E)less than moving from E to D.
Figure 2.1.3Refer to the production possibilities frontier in Figure 2.1.3.The opportunity cost of moving from C to B will be
A)less than moving from D to C but greater than moving from B to A.
B)greater than moving from D to C but less than moving from B to A.
C)the same as moving from D to C or moving from B to A.
D)greater than moving either from D to C or from B to A.
E)less than moving from E to D.
Unlock Deck
Unlock for access to all 145 flashcards in this deck.
Unlock Deck
k this deck
37
Use the figure below to answer the following questions.
Figure 2.1.2
Refer to the production possibilities frontier in Figure 2.1.2.If 6 units of X are produced, then
A)50 units of Y must be produced, regardless of resource utilization.
B)50 units of Y can be produced if all resources are used and assigned to the task for which they are the best match.
C)60 units of Y can be produced with some resources not fully used.
D)40 units of Y cannot be produced unless production of X is increased.
E)40 units of Y cannot be produced unless production of X is decreased.
Figure 2.1.2Refer to the production possibilities frontier in Figure 2.1.2.If 6 units of X are produced, then
A)50 units of Y must be produced, regardless of resource utilization.
B)50 units of Y can be produced if all resources are used and assigned to the task for which they are the best match.
C)60 units of Y can be produced with some resources not fully used.
D)40 units of Y cannot be produced unless production of X is increased.
E)40 units of Y cannot be produced unless production of X is decreased.
Unlock Deck
Unlock for access to all 145 flashcards in this deck.
Unlock Deck
k this deck
38
Use the figure below to answer the following questions.
Figure 2.1.2
Refer to the production possibilities frontier in Figure 2.1.2.At point A, the opportunity cost of increasing production of Y to 80 units is
A)3 units of X.
B)10 units of Y.
C)80 units of Y.
D)1 unit of X.
E)2 units of X.
Figure 2.1.2Refer to the production possibilities frontier in Figure 2.1.2.At point A, the opportunity cost of increasing production of Y to 80 units is
A)3 units of X.
B)10 units of Y.
C)80 units of Y.
D)1 unit of X.
E)2 units of X.
Unlock Deck
Unlock for access to all 145 flashcards in this deck.
Unlock Deck
k this deck
39
The existence of increasing opportunity cost
A)explains why some societies produce inside their production possibilities frontier.
B)explains why specialization is frequently useful.
C)follows from the existence of property rights.
D)explains why resources are scarce.
E)explains the bowed- out shape of the production possibilities frontier.
A)explains why some societies produce inside their production possibilities frontier.
B)explains why specialization is frequently useful.
C)follows from the existence of property rights.
D)explains why resources are scarce.
E)explains the bowed- out shape of the production possibilities frontier.
Unlock Deck
Unlock for access to all 145 flashcards in this deck.
Unlock Deck
k this deck
40
As we increase production of X, we must give up production of larger and larger amounts of Y to produce each additional unit of X.Select the best statement.
A)As a result, we should not specialize in the production of X.
B)We must be producing inside the production possibilities frontier.
C)The production possibilities frontier for X and Y is a straight line.
D)This illustrates increasing opportunity cost.
E)Good Y will be more highly regarded by consumers than good X.
Unlock Deck
Unlock for access to all 145 flashcards in this deck.
Unlock Deck
k this deck
41
Use the figure below to answer the following question.
Figure 2.1.5
The graph in Figure 2.1.5 shows Sunland's PPF for food and sunscreen.Sunland faces _______ opportunity cost of food and _______ opportunity of sunscreen.
A)a decreasing; a decreasing
B)a constant; a constant
C)an increasing; an increasing
D)a decreasing; an increasing
E)an increasing; a decreasing
Figure 2.1.5The graph in Figure 2.1.5 shows Sunland's PPF for food and sunscreen.Sunland faces _______ opportunity cost of food and _______ opportunity of sunscreen.
A)a decreasing; a decreasing
B)a constant; a constant
C)an increasing; an increasing
D)a decreasing; an increasing
E)an increasing; a decreasing
Unlock Deck
Unlock for access to all 145 flashcards in this deck.
Unlock Deck
k this deck
42
Use the table below to answer the following questions.
Table 2.1.1
The following table gives points on the production possibilities frontier for goods X and Y.
The data in Table 2.1.1 illustrate that
A)the opportunity cost of producing an additional unit of Y increases as the production of Y increases.
B)the producer has a comparative advantage in the production of Y.
C)the producer has a comparative advantage in the production of X.
D)the opportunity cost of producing an additional unit of Y decreases as the production of Y increases.
E)the opportunity cost of producing an additional unit of Y is constant as the production of X increases.
Unlock Deck
Unlock for access to all 145 flashcards in this deck.
Unlock Deck
k this deck
43
Use the figure below to answer the following questions.
Figure 2.1.6
Figure 2.1.6 shows the production possibilities frontier for a firm that produces pet food.This PPF _______ illustrate scarcity because _______.
A)does; as more is produced, consumers must pay a higher price
B)does not; the PPF is downward sloping
C)does not; the firm can produce any quantity it wants if it is willing to charge a high enough price
D)does not; scarcity does not occur in the market for pet food
E)does; the firm cannot produce points outside the frontier, and as the firm moves along the PPF, it cannot produce more dog biscuits without producing less cat food
Figure 2.1.6Figure 2.1.6 shows the production possibilities frontier for a firm that produces pet food.This PPF _______ illustrate scarcity because _______.
A)does; as more is produced, consumers must pay a higher price
B)does not; the PPF is downward sloping
C)does not; the firm can produce any quantity it wants if it is willing to charge a high enough price
D)does not; scarcity does not occur in the market for pet food
E)does; the firm cannot produce points outside the frontier, and as the firm moves along the PPF, it cannot produce more dog biscuits without producing less cat food
Unlock Deck
Unlock for access to all 145 flashcards in this deck.
Unlock Deck
k this deck
44
The production possibilities frontier is
A)downward sloping and illustrates the marginal benefit from increasing production of the good measured on the x- axis.
B)upward sloping and illustrates a tradeoff in production of the good measured on the x- axis and the good measured on the y- axis.
C)downward sloping and illustrates a tradeoff in production of the good measured on the x- axis and the good measured on the y- axis.
D)downward sloping and a movement along the PPF illustrates a free lunch.
E)upward sloping and a movement along the PPF illustrates a free lunch.
Unlock Deck
Unlock for access to all 145 flashcards in this deck.
Unlock Deck
k this deck
45
Use the table below to answer the following questions.
Table 2.1.1
The following table gives points on the production possibilities frontier for goods X and Y.
From the data in Table 2.1.1, the production of 7 units of X and 28 units of Y is
A)unattainable.
B)attainable but leaves some resources wasted or misallocated or both.
C)on the PPF between points C and D.
D)outside the PPF.
E)on the PPF between points B and C.
Unlock Deck
Unlock for access to all 145 flashcards in this deck.
Unlock Deck
k this deck
46
Use the table below to answer the following questions.
Table 2.1.1
The following table gives points on the production possibilities frontier for goods X and Y.
Refer to Table 2.1.1.As the production of X increases,
A)the production of Y increases.
B)the amount of X produced increases at an increasing rate.
C)unemployment increases.
D)the opportunity cost of each additional unit of X produced increases.
E)the opportunity cost of each additional unit of X produced decreases.
Unlock Deck
Unlock for access to all 145 flashcards in this deck.
Unlock Deck
k this deck
47
Use the table below to answer the following question.
Table 2.1.4
Consider the following production possibilities for a student for the typical week:
Refer to Table 2.1.4.Complete the following sentence.The production possibilities frontier in the table shows
A)under- utilization of resources.
B)decreasing opportunity cost.
C)constant opportunity cost.
D)learning- by- doing.
E)increasing opportunity cost.
Unlock Deck
Unlock for access to all 145 flashcards in this deck.
Unlock Deck
k this deck
48
Table 2.1.1
The following table gives points on the production possibilities frontier for goods X and Y.
From the data in Table 2.1.1, the production of 10 units of X and 28 units of Y is
A)inside the PPF.
B)attainable but inefficient.
C)on the production possibilities frontier between points C and D.
D)attainable but leaves some resources misallocated.
E)unattainable.
Unlock Deck
Unlock for access to all 145 flashcards in this deck.
Unlock Deck
k this deck
49
Table 2.1.2
Refer to Table 2.1.2.In moving from combination B to combination C, the opportunity cost of producing one additional snowshoe is
A)1/6 kilogram of butter.
B)2 kilograms of butter.
C)3 kilograms of butter.
D)1/2 kilogram of butter.
E)6 kilograms of butter.
Unlock Deck
Unlock for access to all 145 flashcards in this deck.
Unlock Deck
k this deck
50
The slope of the production possibilities frontier curve measures
A)absolute advantage.
B)preferences for the goods measured on both axes.
C)marginal benefit from the good measured on the y- axis.
D)opportunity cost of producing the good measured on the x- axis.
E)comparative advantage.
A)absolute advantage.
B)preferences for the goods measured on both axes.
C)marginal benefit from the good measured on the y- axis.
D)opportunity cost of producing the good measured on the x- axis.
E)comparative advantage.
Unlock Deck
Unlock for access to all 145 flashcards in this deck.
Unlock Deck
k this deck
51
Table 2.1.1
The following table gives points on the production possibilities frontier for goods X and Y.
The production possibilities frontier corresponding to the data in Table 2.1.1 is
A)negatively sloped and linear.
B)positively sloped and bowed outward.
C)negatively sloped and bowed outward.
D)negatively sloped and bowed inward.
E)positively sloped and linear.
Unlock Deck
Unlock for access to all 145 flashcards in this deck.
Unlock Deck
k this deck
52
Use the figure below to answer the following questions.
Figure 2.1.6
Figure 2.1.6 shows the production possibilities frontier for a firm that produces pet food.Point A is and point B is _______ .
A)attainable; unattainable.
B)attainable; attainable.
C)inefficient; efficient
D)unattainable; attainable.
E)unattainable; unattainable.
Figure 2.1.6Figure 2.1.6 shows the production possibilities frontier for a firm that produces pet food.Point A is and point B is _______ .
A)attainable; unattainable.
B)attainable; attainable.
C)inefficient; efficient
D)unattainable; attainable.
E)unattainable; unattainable.
Unlock Deck
Unlock for access to all 145 flashcards in this deck.
Unlock Deck
k this deck
53
Use the table below to answer the following questions.
Table 2.1.1
The following table gives points on the production possibilities frontier for goods X and Y.
The economy illustrated by the data in Table 2.1.1 exhibits
A)constant opportunity cost in the production of X.
B)increasing opportunity cost.
C)constant opportunity cost in the production of Y.
D)initially increasing, then decreasing opportunity cost.
E)decreasing opportunity cost.
Unlock Deck
Unlock for access to all 145 flashcards in this deck.
Unlock Deck
k this deck
54
Use the table below to answer the following questions.
Table 2.1.1
The following table gives points on the production possibilities frontier for goods X and Y.
Refer to Table 2.1.1.The opportunity cost of increasing the production of Y from 16 to 36 units is
A)8 units of X.
B)4 units of X.
C)16 units of X.
D)12 units of X.
E)20 units of Y.
Table 2.1.1
The following table gives points on the production possibilities frontier for goods X and Y.
Refer to Table 2.1.1.The opportunity cost of increasing the production of Y from 16 to 36 units is
A)8 units of X.
B)4 units of X.
C)16 units of X.
D)12 units of X.
E)20 units of Y.
Unlock Deck
Unlock for access to all 145 flashcards in this deck.
Unlock Deck
k this deck
55
Table 2.1.2
Refer to Table 2.1.2.According to this production possibilities frontier,
A)a combination of 0 kilograms of butter and 4 snowshoes is attainable.
B)the opportunity cost of producing snowshoes increases as more snowshoes are produced.
C)resources are equally useful in all activities.
D)the opportunity cost of producing snowshoes decreases as more snowshoes are produced.
E)a combination of 6 kilograms of butter and 1 snowshoe is inefficient.
Unlock Deck
Unlock for access to all 145 flashcards in this deck.
Unlock Deck
k this deck
56
Use the table below to answer the following question.
Table 2.1.3
Refer to Table 2.1.3.In moving from combination C to combination B, the opportunity cost of producing one additional hockey stick is
A)1/6 maple leaves.
B)1/2 maple leaves.
C)2 maple leaves.
D)3 maple leaves.
E)6 maple leaves.
Table 2.1.3
Refer to Table 2.1.3.In moving from combination C to combination B, the opportunity cost of producing one additional hockey stick is
A)1/6 maple leaves.
B)1/2 maple leaves.
C)2 maple leaves.
D)3 maple leaves.
E)6 maple leaves.
Unlock Deck
Unlock for access to all 145 flashcards in this deck.
Unlock Deck
k this deck
57
When producing at a point of production efficiency,
A)the quantity of goods produced can be either on or inside the production possibilities frontier.
B)a tradeoff occurs.
C)the opportunity cost of producing goods other than those measured on the axes of the production possibilities frontier is zero.
D)resources are either wasted or misallocated.
E)all wants are satisfied.
Unlock Deck
Unlock for access to all 145 flashcards in this deck.
Unlock Deck
k this deck
58
Use the table below to answer the following questions.
Table 2.1.1
The following table gives points on the production possibilities frontier for goods X and Y.
Refer to Table 2.1.1.The opportunity cost of increasing the production of X from 8 to 12 units is
A)12 units of Y.
B)16 units of Y.
C)4 units of Y.
D)8 units of Y.
E)4 units of X.
Table 2.1.1
The following table gives points on the production possibilities frontier for goods X and Y.
Refer to Table 2.1.1.The opportunity cost of increasing the production of X from 8 to 12 units is
A)12 units of Y.
B)16 units of Y.
C)4 units of Y.
D)8 units of Y.
E)4 units of X.
Unlock Deck
Unlock for access to all 145 flashcards in this deck.
Unlock Deck
k this deck
59
Use the figure below to answer the following question.
Figure 2.1.4
Refer to the production possibilities frontier in Figure 2.1.4.Which point is unattainable?
A)A
B)B
C)C
D)D
E)E
Figure 2.1.4Refer to the production possibilities frontier in Figure 2.1.4.Which point is unattainable?
A)A
B)B
C)C
D)D
E)E
Unlock Deck
Unlock for access to all 145 flashcards in this deck.
Unlock Deck
k this deck
60
Jane produces only corn and cloth.If her preferences for corn and cloth change, then
A)her PPF does not change.
B)her PPF becomes flatter.
C)the world PPF shifts outward.
D)her PPF becomes straighter.
E)her PPF becomes steeper.
A)her PPF does not change.
B)her PPF becomes flatter.
C)the world PPF shifts outward.
D)her PPF becomes straighter.
E)her PPF becomes steeper.
Unlock Deck
Unlock for access to all 145 flashcards in this deck.
Unlock Deck
k this deck
61
Marginal cost
A)is greater then marginal benefit.
B)is the opportunity cost of producing one more unit of a good or service.
C)equals marginal benefit.
D)is less than marginal benefit.
E)is unrelated to the production possibilities frontier.
A)is greater then marginal benefit.
B)is the opportunity cost of producing one more unit of a good or service.
C)equals marginal benefit.
D)is less than marginal benefit.
E)is unrelated to the production possibilities frontier.
Unlock Deck
Unlock for access to all 145 flashcards in this deck.
Unlock Deck
k this deck
62
Choose the correct statements.
1.Opportunity cost of a good is the increase in the quantity produced of one good divided by the decrease in the quantity produced of another good as we move along the PPF.
2.The opportunity cost of an action is the highest- valued alternative forgone.
3.Opportunity cost is a ratio.
4.There is no relationship between the opportunity cost of producing an additional good measured on the
X- axis and the opportunity cost of producing an additional good measured on the y- axis.
A)Statements 3 and 4 are correct.
B)Statements 2 and 3 are correct.
C)Statements 2 and 4 are correct.
D)Statements 1 and 3 are correct.
E)Statements 1 and 2 are correct.
Unlock Deck
Unlock for access to all 145 flashcards in this deck.
Unlock Deck
k this deck
63
The principle of decreasing marginal benefit implies that the
A)additional benefit from obtaining one more unit of a good or service increases as more of that good or service is consumed.
B)total benefit from obtaining more of a good or service decreases as more is consumed.
C)additional benefit from producing one more unit of a good or service decreases as more of that good or service is produced.
D)total benefit from obtaining more of a good or service remains the same as more is consumed.
E)additional benefit from obtaining one more unit of a good or service decreases as more of that good or service is consumed.
Unlock Deck
Unlock for access to all 145 flashcards in this deck.
Unlock Deck
k this deck
64
The marginal benefit curve from a good
A)is upward- sloping.
B)shows the most a consumer is willing to pay for one more unit of that good.
C)is bowed outward.
D)is vertical.
E)shows the benefit a firm receives from producing one more unit of that good.
A)is upward- sloping.
B)shows the most a consumer is willing to pay for one more unit of that good.
C)is bowed outward.
D)is vertical.
E)shows the benefit a firm receives from producing one more unit of that good.
Unlock Deck
Unlock for access to all 145 flashcards in this deck.
Unlock Deck
k this deck
65
Use the figure below to answer the following questions.
Figure 2.2.1
In Figure 2.2.1, the curve labelled A is the _______ curve and the curve labelled B is the _______ curve.
A)marginal benefit; marginal cost
B)marginal benefit; trade
C)marginal cost; trade
D)production possibilities; trade
E)marginal cost; marginal benefit
Figure 2.2.1In Figure 2.2.1, the curve labelled A is the _______ curve and the curve labelled B is the _______ curve.
A)marginal benefit; marginal cost
B)marginal benefit; trade
C)marginal cost; trade
D)production possibilities; trade
E)marginal cost; marginal benefit
Unlock Deck
Unlock for access to all 145 flashcards in this deck.
Unlock Deck
k this deck
66
Use the figure below to answer the following questions.
Figure 2.2.1
In Figure 2.2.1, when 4,000 bicycles are produced each month,
A)fewer bicycles must be produced to reach the efficient level of output.
B)the marginal benefit from the 4,000th bicycle is greater than the marginal cost of the 4,000th bicycle.
C)the production of bicycles is efficient.
D)more bicycles must be produced to reach the efficient level of output.
E)the marginal benefit from the 4,000th bicycle equals the marginal cost of the 4th scooter.
Figure 2.2.1In Figure 2.2.1, when 4,000 bicycles are produced each month,
A)fewer bicycles must be produced to reach the efficient level of output.
B)the marginal benefit from the 4,000th bicycle is greater than the marginal cost of the 4,000th bicycle.
C)the production of bicycles is efficient.
D)more bicycles must be produced to reach the efficient level of output.
E)the marginal benefit from the 4,000th bicycle equals the marginal cost of the 4th scooter.
Unlock Deck
Unlock for access to all 145 flashcards in this deck.
Unlock Deck
k this deck
67
As consumption of a good increases,
A)the price of the good falls.
B)marginal benefit increases.
C)marginal benefit decreases.
D)marginal benefit increases or decreases depending on price.
E)marginal benefit equals price.
A)the price of the good falls.
B)marginal benefit increases.
C)marginal benefit decreases.
D)marginal benefit increases or decreases depending on price.
E)marginal benefit equals price.
Unlock Deck
Unlock for access to all 145 flashcards in this deck.
Unlock Deck
k this deck
68
Use the table below to answer the following question.
Table 2.2.1
Refer to Table 2.2.1.Marginal benefit from food crops
A)equals 70 barrels of ethanol.
B)equals the marginal cost of food crops.
C)cannot be calculated from the table.
D)remains constant as the quantity of food crops increases from 1 tonne a day to 2 tonnes a day.
E)increases as the quantity of food crops increases from 1 tonne a day to 2 tonnes a day.
Unlock Deck
Unlock for access to all 145 flashcards in this deck.
Unlock Deck
k this deck
69
Marginal benefit from a good or service is the benefit received from consuming _______ .It is measured by the most that people are willing to pay for _______ .
A)one more unit of it; more of it
B)goods that you prefer; more of it
C)goods that you prefer; an additional unit of it
D)as much as is available; the total amount consumed
E)one more unit of it; an additional unit of it
A)one more unit of it; more of it
B)goods that you prefer; more of it
C)goods that you prefer; an additional unit of it
D)as much as is available; the total amount consumed
E)one more unit of it; an additional unit of it
Unlock Deck
Unlock for access to all 145 flashcards in this deck.
Unlock Deck
k this deck
70
Use the figure below to answer the following questions.
Figure 2.2.1
In Figure 2.2.1, the curve labelled B shows
A)the number of scooters that people must forgo to obtain another bicycle.
B)that the benefit from producing more bicycles is greater than the benefit from producing more scooters.
C)the number of bicycles that people are willing to forgo to obtain another scooter.
D)that the benefit from producing more scooters is greater than the benefit from producing more bicycles.
E)the number of scooters that people are willing to forgo to obtain another bicycle.
Figure 2.2.1In Figure 2.2.1, the curve labelled B shows
A)the number of scooters that people must forgo to obtain another bicycle.
B)that the benefit from producing more bicycles is greater than the benefit from producing more scooters.
C)the number of bicycles that people are willing to forgo to obtain another scooter.
D)that the benefit from producing more scooters is greater than the benefit from producing more bicycles.
E)the number of scooters that people are willing to forgo to obtain another bicycle.
Unlock Deck
Unlock for access to all 145 flashcards in this deck.
Unlock Deck
k this deck
71
Consider a PPF that measures the production of quilts on the y- axis and the production of pillows on the x- axis.As the firm moves along this PPF, the production of
A)pillows and quilts are both decreasing.
B)pillows and quilts are both increasing.
C)all goods other than pillows and quilts is decreasing.
D)all goods other than pillows and quilts remains constant.
E)all goods other than pillows and quilts is increasing.
A)pillows and quilts are both decreasing.
B)pillows and quilts are both increasing.
C)all goods other than pillows and quilts is decreasing.
D)all goods other than pillows and quilts remains constant.
E)all goods other than pillows and quilts is increasing.
Unlock Deck
Unlock for access to all 145 flashcards in this deck.
Unlock Deck
k this deck
72
The Government of Canada promises to produce more defence goods without any decrease in the production of other goods.This promise is valid
A)only if the PPF shifts rightward.
B)if Canada is producing at a point on its PPF.
C)only if technology advances or capital increases.
D)if Canada is producing at a point inside its PPF.
E)if Canada is producing at a point outside its PPF.
A)only if the PPF shifts rightward.
B)if Canada is producing at a point on its PPF.
C)only if technology advances or capital increases.
D)if Canada is producing at a point inside its PPF.
E)if Canada is producing at a point outside its PPF.
Unlock Deck
Unlock for access to all 145 flashcards in this deck.
Unlock Deck
k this deck
73
When the market achieves allocative efficiency,
A)marginal benefit equals marginal cost.
B)marginal cost is at its minimum.
C)marginal cost minus marginal benefit is positive.
D)marginal benefit minus marginal cost is positive.
E)marginal benefit is at its maximum.
A)marginal benefit equals marginal cost.
B)marginal cost is at its minimum.
C)marginal cost minus marginal benefit is positive.
D)marginal benefit minus marginal cost is positive.
E)marginal benefit is at its maximum.
Unlock Deck
Unlock for access to all 145 flashcards in this deck.
Unlock Deck
k this deck
74
The quantity of shoes produced is measured along the x- axis of a bowed- outward production possibilities frontier and the quantity of shirts produced is measured along the y- axis.As you move down towards the right along the production possibilities frontier, the marginal cost of
A)a pair of shoes increases.
B)a shirt remains constant.
C)a pair of shoes decreases.
D)a shirt equals the marginal benefit from a pair of shoes.
E)a pair of shoes and a shirt is equal at the midpoint between the x- axis and the y- axis.
A)a pair of shoes increases.
B)a shirt remains constant.
C)a pair of shoes decreases.
D)a shirt equals the marginal benefit from a pair of shoes.
E)a pair of shoes and a shirt is equal at the midpoint between the x- axis and the y- axis.
Unlock Deck
Unlock for access to all 145 flashcards in this deck.
Unlock Deck
k this deck
75
Which of the following is true regarding marginal benefit? I.The marginal benefit curve shows the benefit firms receive by producing another unit of a good.
II.Marginal benefit increases as more and more of a good is consumed.
III.Marginal benefit is the maximum amount a person is willing to pay to obtain one more unit of a good.
A)I only
B)I and II
C)I and III
D)III only
E)I, II, and III
II.Marginal benefit increases as more and more of a good is consumed.
III.Marginal benefit is the maximum amount a person is willing to pay to obtain one more unit of a good.
A)I only
B)I and II
C)I and III
D)III only
E)I, II, and III
Unlock Deck
Unlock for access to all 145 flashcards in this deck.
Unlock Deck
k this deck
76
A marginal benefit curve measures
A)opportunity cost.
B)absolute advantage.
C)willingness to pay.
D)expenditure.
E)comparative advantage.
A)opportunity cost.
B)absolute advantage.
C)willingness to pay.
D)expenditure.
E)comparative advantage.
Unlock Deck
Unlock for access to all 145 flashcards in this deck.
Unlock Deck
k this deck
77
The production possibilities frontier shows
A)the effect of advancing technology on production possibilities.
B)the maximum possible growth rate of output in an economy.
C)combinations of goods and services that do not fully use available resources.
D)the maximum quantity of resources available at any given time.
E)the maximum level of production that can be attained.
Unlock Deck
Unlock for access to all 145 flashcards in this deck.
Unlock Deck
k this deck
78
Use the figure below to answer the following questions.
Figure 2.2.1
In Figure 2.2.1, when 2,000 bicycles are produced each month,
A)the marginal benefit from the 2,000th bicycle is greater than the marginal cost of the 2,000th bicycle.
B)the marginal benefit from the 2,000th bicycle equals the marginal cost of the second scooter.
C)fewer bicycles must be produced to reach the efficient level of output.
D)the production of bicycles is efficient.
E)the marginal benefit from the 2,000th bicycle equals the marginal cost of the 4th scooter.
Figure 2.2.1In Figure 2.2.1, when 2,000 bicycles are produced each month,
A)the marginal benefit from the 2,000th bicycle is greater than the marginal cost of the 2,000th bicycle.
B)the marginal benefit from the 2,000th bicycle equals the marginal cost of the second scooter.
C)fewer bicycles must be produced to reach the efficient level of output.
D)the production of bicycles is efficient.
E)the marginal benefit from the 2,000th bicycle equals the marginal cost of the 4th scooter.
Unlock Deck
Unlock for access to all 145 flashcards in this deck.
Unlock Deck
k this deck
79
To describe preferences, economists use the concept of
A)opportunity cost.
B)marginal benefit.
C)scarcity.
D)price.
E)marginal cost.
A)opportunity cost.
B)marginal benefit.
C)scarcity.
D)price.
E)marginal cost.
Unlock Deck
Unlock for access to all 145 flashcards in this deck.
Unlock Deck
k this deck
80
Allocative efficiency refers to a situation where
A)opportunity cost is zero for all goods.
B)marginal benefit is maximized.
C)opportunity costs are equal for all goods.
D)we cannot produce more of any one good without giving up some other good.
E)goods and services are produced at the lowest possible cost and in the quantities that provide the greatest possible benefit.
Unlock Deck
Unlock for access to all 145 flashcards in this deck.
Unlock Deck
k this deck
Unlock Deck
Unlock for access to all 145 flashcards in this deck.


