Deck 1: A: - Limits, Alternatives, and Choices
Full screen (f)
Question
Question
Question
Question
Question
Question
Question
Question
Question
Question
Question
Question
Question
Question
Question
Question
Question
Question
Question
Question
Question
Question
Question
Question
Question
Question
A production possibilities table for two products, grain and airplanes, is found below.Usual assumptions regarding production possibilities are implied.Grain is measured in tons and airplanes are measured in units of 1,000.(a) Using the below graph construct a production possibilities curve from this information placing grain on the vertical axis and airplanes on the horizontal axis. 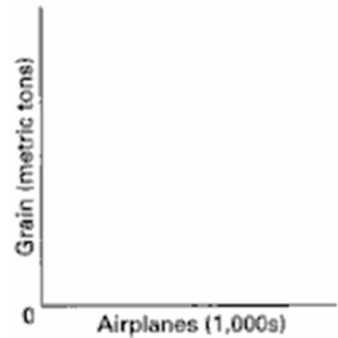 (b) What is the opportunity cost of producing the first unit of airplanes? The marginal opportunity cost of producing the fourth unit of airplanes?

(b) What is the opportunity cost of producing the first unit of airplanes? The marginal opportunity cost of producing the fourth unit of airplanes? Question
Question
Question
A production possibilities table for two products, corn and paper, is found below.Usual assumptions regarding production possibilities are implied.Corn is measured in tons, and paper is measured per unit.  (a) Using the following graph construct a production possibilities curve from this information placing corn on the vertical axis and paper on the horizontal axis.
  (b) What is the marginal opportunity cost of producing the first unit of paper? The marginal opportunity cost of producing the fourth unit of paper?
(a) Using the following graph construct a production possibilities curve from this information placing corn on the vertical axis and paper on the horizontal axis. (b) What is the marginal opportunity cost of producing the first unit of paper? The marginal opportunity cost of producing the fourth unit of paper? Question
Question
Question
The production possibilities table below shows the hypothetical relationship between the production of food and clothing in an economy.
(a) What is the marginal opportunity cost of producing the second unit of clothing?
(b) What is the total opportunity cost of producing two units of clothing?
(c) What is the marginal opportunity cost of producing the third unit of clothing?
(d) What is the total opportunity cost of producing three units of clothing?
Question
Question
Question
Question
Question
Question
Question
Question
Question
Question
Question
Question
Question
An economy consists of five workers, who can produce either fish or fruit.The following table shows the daily output of each worker. 
 (a) Suppose one worker catches fish and four workers pick fruit.For the economy to achieve productive efficiency, which of the five workers must fish?
(b) Does the economy achieve full employment and productive efficiency by producing 12 fish and 4 fruit?
(a) Suppose one worker catches fish and four workers pick fruit.For the economy to achieve productive efficiency, which of the five workers must fish?(b) Does the economy achieve full employment and productive efficiency by producing 12 fish and 4 fruit?
Question
Question
An economy consists of five workers, who can produce either fish or fruit.The following table shows the daily output of each worker. 
 (a) Suppose one worker catches fish and four workers pick fruit.For the economy to achieve productive efficiency, which of the five workers must fish?
(b) Does the economy achieve full employment and productive efficiency by producing 26 fish and 20 fruit?
(a) Suppose one worker catches fish and four workers pick fruit.For the economy to achieve productive efficiency, which of the five workers must fish?(b) Does the economy achieve full employment and productive efficiency by producing 26 fish and 20 fruit?
Question
Question
Show graphically on the below graph the expected relationship between investment spending and interest rates.Put investment expenditures on the horizontal axis and the rate of interest on the vertical axis; connect the points and label the curve "Investment demand".Describe this relationship between the rate of interest and investment expenditures.Describe the slope of the investment curve. 
Question
Question
Question
Question
Question
Question
Question
Question
Question
Question
Look at the following production possibilities curve illustrating the possibilities in Sluggerville for producing bats and/or peanuts with the existing level of resources and technology. 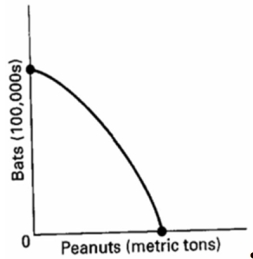
Question

Unlock Deck
Sign up to unlock the cards in this deck!
Unlock Deck
Unlock Deck
1/60
Play
Full screen (f)
Deck 1: A: - Limits, Alternatives, and Choices
1
Below are six statements.Indicate whether each one pertains to microeconomics (MIC) or macroeconomics (MAC).(a) "The inflation rate in Canada hit its lowest level in the last twenty years".(b) "The profits of BCE rose 20 percent during the past quarter".(c) "A drought has occurred in the Prairies.The prices for barley are expected to rise sharply".(d) "The nation's economy grew at an annual rate of 3.7 percent in the final quarter of the year".(e) "The trade surplus in Canada was $4 billion last month".(f) "General Motors plans to spend $800 million on a new automobile plant".
(a), (d), and (e) are macro; (b), (c), and (f) are micro.
2
Distinguish between microeconomics and macroeconomics.
Microeconomics deals with individual economic units such as industries, firms, households, and with individual markets, particular prices, and specific goods and services.Macroeconomics, on the other hand, deals with the economy as a whole, including such major aggregates as the household, business, and governmental sectors and with totals for the economy.
3
The distinguished economist Kenneth Boulding stated: "Theories without facts may be barren, but facts without theories are meaningless".Explain what he meant.
Economic theories are generalizations about the economic behaviour of individuals and institutions.As generalizations or principles, they are abstractions and may not offer specific information about a particular issue that can be obtained from facts.Economic theories are barren in the sense that they offer a framework for thinking about the economic issue without a lot of the details about it.Having a lot of facts about an economic issue, however, is not very meaningful.Facts need to be arranged and organized if they are to have meaning and give insight into the issue.Economic theory offers that framework for organizing the factual information.
4
What does it mean to say that theories, principles, and models are "purposeful simplifications"?
Unlock Deck
Unlock for access to all 60 flashcards in this deck.
Unlock Deck
k this deck
5
What are the key economic concepts that pertain to the economy as a whole?
Unlock Deck
Unlock for access to all 60 flashcards in this deck.
Unlock Deck
k this deck
6
Why have the last few years been an exciting time to study macroeconomics?
Unlock Deck
Unlock for access to all 60 flashcards in this deck.
Unlock Deck
k this deck
7
What are the key economic concepts that pertain to interactions among individuals?
Unlock Deck
Unlock for access to all 60 flashcards in this deck.
Unlock Deck
k this deck
8
"Bad theories are abstract and therefore unrealistic; good theories are fully realistic and fit all the facts".Evaluate.
Unlock Deck
Unlock for access to all 60 flashcards in this deck.
Unlock Deck
k this deck
9
What is a brief definition of economics? What are the conditions that give rise to this definition?
Unlock Deck
Unlock for access to all 60 flashcards in this deck.
Unlock Deck
k this deck
10
What are the three interrelated features of the economic perspective?
Unlock Deck
Unlock for access to all 60 flashcards in this deck.
Unlock Deck
k this deck
11
Give one example of a positive economic statement and one example of a normative economic statement.
Unlock Deck
Unlock for access to all 60 flashcards in this deck.
Unlock Deck
k this deck
12
"Economists are scientists and therefore should not become involved in making value judgments which policy formulation necessarily entails".Do you agree?
Unlock Deck
Unlock for access to all 60 flashcards in this deck.
Unlock Deck
k this deck
13
What is utility and what is its relevance to rational behaviour?
Unlock Deck
Unlock for access to all 60 flashcards in this deck.
Unlock Deck
k this deck
14
Below are six statements.Identify whether each is a positive or normative statement.(a) The minimum wage should be increased so low-income workers can earn a living wage.(b) The unemployment rate is too high and should be reduced through government actions.(c) The rate of inflation was about 2 percent last year, an all time low for the past decade.(d) The government should take action to break up the monopoly power of Air Canada.(e) Interest rates should be lower in Canada so that people can afford to build a home.(f) The Federal government achieved a budget surplus for the first time in thirty years.
Unlock Deck
Unlock for access to all 60 flashcards in this deck.
Unlock Deck
k this deck
15
What are the key economic concepts that pertain to the individual?
Unlock Deck
Unlock for access to all 60 flashcards in this deck.
Unlock Deck
k this deck
16
Use marginal analysis to explain why it is possible to "have too much of a good thing".Use education as an example.
Unlock Deck
Unlock for access to all 60 flashcards in this deck.
Unlock Deck
k this deck
17
"Economic models are somewhat like different types of maps".Evaluate.
Unlock Deck
Unlock for access to all 60 flashcards in this deck.
Unlock Deck
k this deck
18
Explain the importance of the ceteris paribus or "other-things-equal" assumption.
Unlock Deck
Unlock for access to all 60 flashcards in this deck.
Unlock Deck
k this deck
19
Identify whether each of the following is a positive or normative statement.(a) Should tuition fees increase, fewer students would obtain a post-secondary education.(b) The Prime Minister announced that Canada is the best place in the world to live.
Unlock Deck
Unlock for access to all 60 flashcards in this deck.
Unlock Deck
k this deck
20
What do economists mean when they say that "there is no free lunch"? Give another example to which this statement applies.
Unlock Deck
Unlock for access to all 60 flashcards in this deck.
Unlock Deck
k this deck
21
"Economics cannot be scientific because it is based upon the value judgment that 'more (output) is better'".Do you agree?
Unlock Deck
Unlock for access to all 60 flashcards in this deck.
Unlock Deck
k this deck
22
What were the approximate average incomes of Canadians and Pakistanis in 2015?
Unlock Deck
Unlock for access to all 60 flashcards in this deck.
Unlock Deck
k this deck
23
Explain and evaluate: "If resources were infinitely abundant in relation to the demand for them, the economic problem would dissolve in a sea of affluence".
Unlock Deck
Unlock for access to all 60 flashcards in this deck.
Unlock Deck
k this deck
24
What do economists mean when they say that economic resources or factors of production are scarce or limited in supply?
Unlock Deck
Unlock for access to all 60 flashcards in this deck.
Unlock Deck
k this deck
25
What is meant by the "the individual's economic problem"?
Unlock Deck
Unlock for access to all 60 flashcards in this deck.
Unlock Deck
k this deck
26
A production possibilities table for two products, grain and airplanes, is found below.Usual assumptions regarding production possibilities are implied.Grain is measured in tons and airplanes are measured in units of 1,000.(a) Using the below graph construct a production possibilities curve from this information placing grain on the vertical axis and airplanes on the horizontal axis. (b) What is the opportunity cost of producing the first unit of airplanes? The marginal opportunity cost of producing the fourth unit of airplanes?
(b) What is the opportunity cost of producing the first unit of airplanes? The marginal opportunity cost of producing the fourth unit of airplanes? Unlock Deck
Unlock for access to all 60 flashcards in this deck.
Unlock Deck
k this deck
27
What is meant by "society's economic problem"?
Unlock Deck
Unlock for access to all 60 flashcards in this deck.
Unlock Deck
k this deck
28
What variables are used to determine the individual's budget line?
Unlock Deck
Unlock for access to all 60 flashcards in this deck.
Unlock Deck
k this deck
29
A production possibilities table for two products, corn and paper, is found below.Usual assumptions regarding production possibilities are implied.Corn is measured in tons, and paper is measured per unit. (a) Using the following graph construct a production possibilities curve from this information placing corn on the vertical axis and paper on the horizontal axis. (b) What is the marginal opportunity cost of producing the first unit of paper? The marginal opportunity cost of producing the fourth unit of paper?
(a) Using the following graph construct a production possibilities curve from this information placing corn on the vertical axis and paper on the horizontal axis. (b) What is the marginal opportunity cost of producing the first unit of paper? The marginal opportunity cost of producing the fourth unit of paper? Unlock Deck
Unlock for access to all 60 flashcards in this deck.
Unlock Deck
k this deck
30
"The relative scarcity of resources makes the operation of any economy a matter of choosing between alternatives".Explain.
Unlock Deck
Unlock for access to all 60 flashcards in this deck.
Unlock Deck
k this deck
31
Explain how increasing opportunity costs are reflected graphically in the production possibilities curve.How would the curve appear if opportunity costs were constant?
Unlock Deck
Unlock for access to all 60 flashcards in this deck.
Unlock Deck
k this deck
32
The production possibilities table below shows the hypothetical relationship between the production of food and clothing in an economy.
(a) What is the marginal opportunity cost of producing the second unit of clothing?
(b) What is the total opportunity cost of producing two units of clothing?
(c) What is the marginal opportunity cost of producing the third unit of clothing?
(d) What is the total opportunity cost of producing three units of clothing?
Unlock Deck
Unlock for access to all 60 flashcards in this deck.
Unlock Deck
k this deck
33
What were the approximate average incomes of Canadians and Pakistanis in 2015?
Unlock Deck
Unlock for access to all 60 flashcards in this deck.
Unlock Deck
k this deck
34
"The two cornerstones of economics are the scarcity of resources and the multiplicity of wants.True economy consists of deriving maximum want satisfaction from available resources".Explain.
Unlock Deck
Unlock for access to all 60 flashcards in this deck.
Unlock Deck
k this deck
35
Describe the Greek Debt Crisis, and explain its relation to the Economic Problem?
Unlock Deck
Unlock for access to all 60 flashcards in this deck.
Unlock Deck
k this deck
36
What is the economic rationale for the law of increasing costs?
Unlock Deck
Unlock for access to all 60 flashcards in this deck.
Unlock Deck
k this deck
37
How do income changes affect the position of the budget line?
Unlock Deck
Unlock for access to all 60 flashcards in this deck.
Unlock Deck
k this deck
38
Explain the relationship between full employment of resources and full production.
Unlock Deck
Unlock for access to all 60 flashcards in this deck.
Unlock Deck
k this deck
39
What four basic functions does the entrepreneur perform for the economy?
Unlock Deck
Unlock for access to all 60 flashcards in this deck.
Unlock Deck
k this deck
40
List the four resource categories and give a brief description of each.
Unlock Deck
Unlock for access to all 60 flashcards in this deck.
Unlock Deck
k this deck
41
Describe the adjustments in the production possibilities curves in each of the following situations for the Canadian economy.(a) the economy moves from full employment into a deep recession
(b) the economy makes great strides in eliminating discrimination
(c) the end of the Cold War leads to cuts in military spending
(d) the government significantly increases spending for health and education
(b) the economy makes great strides in eliminating discrimination
(c) the end of the Cold War leads to cuts in military spending
(d) the government significantly increases spending for health and education
Unlock Deck
Unlock for access to all 60 flashcards in this deck.
Unlock Deck
k this deck
42
What changes must occur for the potential total output of the economy to grow?
Unlock Deck
Unlock for access to all 60 flashcards in this deck.
Unlock Deck
k this deck
43
The value of the vertical intercept is $100 and the slope is 0.8 in a linear equation for consumption (measured on the vertical axis) and disposable income (measured on the horizontal axis).If disposable income is $1000, what is consumption? State the linear equation and show how you found the answer.
Unlock Deck
Unlock for access to all 60 flashcards in this deck.
Unlock Deck
k this deck
44
The production possibilities curve suggests that a nation cannot live beyond its means or production potential.Explain why international trade would cause this statement to be modified.
Unlock Deck
Unlock for access to all 60 flashcards in this deck.
Unlock Deck
k this deck
45
An economy consists of five workers, who can produce either fish or fruit.The following table shows the daily output of each worker. (a) Suppose one worker catches fish and four workers pick fruit.For the economy to achieve productive efficiency, which of the five workers must fish?
(b) Does the economy achieve full employment and productive efficiency by producing 12 fish and 4 fruit?
(a) Suppose one worker catches fish and four workers pick fruit.For the economy to achieve productive efficiency, which of the five workers must fish?(b) Does the economy achieve full employment and productive efficiency by producing 12 fish and 4 fruit?
Unlock Deck
Unlock for access to all 60 flashcards in this deck.
Unlock Deck
k this deck
46
Describe the slope of a direct and an inverse relationship.
Unlock Deck
Unlock for access to all 60 flashcards in this deck.
Unlock Deck
k this deck
47
An economy consists of five workers, who can produce either fish or fruit.The following table shows the daily output of each worker. (a) Suppose one worker catches fish and four workers pick fruit.For the economy to achieve productive efficiency, which of the five workers must fish?
(b) Does the economy achieve full employment and productive efficiency by producing 26 fish and 20 fruit?
(a) Suppose one worker catches fish and four workers pick fruit.For the economy to achieve productive efficiency, which of the five workers must fish?(b) Does the economy achieve full employment and productive efficiency by producing 26 fish and 20 fruit?
Unlock Deck
Unlock for access to all 60 flashcards in this deck.
Unlock Deck
k this deck
48
How do you determine the slope of a nonlinear curve? Will the slope be the same along the curve? Explain.
Unlock Deck
Unlock for access to all 60 flashcards in this deck.
Unlock Deck
k this deck
49
Show graphically on the below graph the expected relationship between investment spending and interest rates.Put investment expenditures on the horizontal axis and the rate of interest on the vertical axis; connect the points and label the curve "Investment demand".Describe this relationship between the rate of interest and investment expenditures.Describe the slope of the investment curve.
Unlock Deck
Unlock for access to all 60 flashcards in this deck.
Unlock Deck
k this deck
50
Differentiate between the independent and dependent variables in an economic relationship.
Unlock Deck
Unlock for access to all 60 flashcards in this deck.
Unlock Deck
k this deck
51
Explain how each event affects production possibilities.(a) The population becomes more educated over time as the number of high school dropouts falls and the number of college graduates rises.(b) The unemployment rate declines from 8 to 6 percent of the labour force.(c) Businesses and government are unable to solve a major computer problem, thus reducing economic efficiency and national output.(d) Advances in telecommunications and new technology significantly contribute to economic growth over time.(e) The Federal government decides to allocate more resources to national defence.
Unlock Deck
Unlock for access to all 60 flashcards in this deck.
Unlock Deck
k this deck
52
Show graphically the relationships that you would expect to find between (a) student IQs and grade point averages (GPAs); (b) the price of a product and the amount consumers will purchase; (c) the temperature and the number of people at the swimming pool.Which of these are direct relationships and which are inverse? What considerations might change the expected relationships?
Unlock Deck
Unlock for access to all 60 flashcards in this deck.
Unlock Deck
k this deck
53
Why do economists use graphs in their work?
Unlock Deck
Unlock for access to all 60 flashcards in this deck.
Unlock Deck
k this deck
54
Evaluate.Since the production possibilities curve can shift outward over time, it is possible for an economy to get more of a product without incurring an opportunity cost.
Unlock Deck
Unlock for access to all 60 flashcards in this deck.
Unlock Deck
k this deck
55
In a two-dimensional graph showing the relationship between income and consumption in the economy, what is shown on the vertical axis and what is shown on the horizontal axis?
Unlock Deck
Unlock for access to all 60 flashcards in this deck.
Unlock Deck
k this deck
56
There are two sets of x, y points on a straight line in a two-variable graph with y on the vertical axis and x on the horizontal axis.What would be the linear equation for the line if one set of points was (0, 12) and the other set was (12, 36)?
Unlock Deck
Unlock for access to all 60 flashcards in this deck.
Unlock Deck
k this deck
57
One application of the production possibilities concept has been to explain the difference in growth patterns of a nation with a high level of investment (Alta) and an equivalent nation with a low level of investment (Zorn).Use the concept to explain why Alta's economic growth would be greater than that of Zorn over time.
Unlock Deck
Unlock for access to all 60 flashcards in this deck.
Unlock Deck
k this deck
58
Define what is meant by a positive or direct relationship between two variables and describe the line graph depicting such a relationship.
Unlock Deck
Unlock for access to all 60 flashcards in this deck.
Unlock Deck
k this deck
59
Look at the following production possibilities curve illustrating the possibilities in Sluggerville for producing bats and/or peanuts with the existing level of resources and technology.
Unlock Deck
Unlock for access to all 60 flashcards in this deck.
Unlock Deck
k this deck
60
Define what is meant by an inverse relationship between two variables and describe the line graph depicting such a relationship.
Unlock Deck
Unlock for access to all 60 flashcards in this deck.
Unlock Deck
k this deck
Unlock Deck
Unlock for access to all 60 flashcards in this deck.


