Deck 16: Part A: Long-Run Macroeconomic Adjustments
Full screen (f)
Question
Question
Explain the Phillips Curve concept and construct an example of the curve on the below graph. 
Question
Question
(a) Using a graph showing aggregate demand, short-run aggregate supply, and long-run aggregate supply, illustrate an economy that faces a recessionary gap.  (b) Explain how the recessionary gap can be eliminated and evaluate the possibilities.
(b) Explain how the recessionary gap can be eliminated and evaluate the possibilities. Question
Question
Question
Question
(a) Using a graph showing aggregate demand, short-run aggregate supply, and long-run aggregate supply, illustrate an economy that faces an inflationary gap.  (b) Explain how the inflationary gap can be eliminated and evaluate the possibilities.
(b) Explain how the inflationary gap can be eliminated and evaluate the possibilities. Question
Suppose the potential level of real GDP for a hypothetical economy is $160 and the price level (P) initially is 200.Use the following short-run aggregate supply schedules to answer the questions.  (a) What will be the short-run level of real GDP if the price level rises unexpectedly from 200 to 210 because of an increase in aggregate demand? Falls unexpectedly from 200 to 190 because of a decrease in aggregate demand? Explain each situation.(b) What will be the long-run level of real GDP when the price level rises from 200 to 210? Falls from 200 to 190? Explain each situation.
(a) What will be the short-run level of real GDP if the price level rises unexpectedly from 200 to 210 because of an increase in aggregate demand? Falls unexpectedly from 200 to 190 because of a decrease in aggregate demand? Explain each situation.(b) What will be the long-run level of real GDP when the price level rises from 200 to 210? Falls from 200 to 190? Explain each situation. Question
Question
Question
Question
Question
Question
Question
Question
Suppose the potential level of real GDP for a hypothetical economy is $250 and the price level (P) initially is 100.Use the following short-run aggregate supply schedules below to answer the questions.  (a) What will be the short-run level of real GDP if the price level rises unexpectedly from 100 to 110 because of an increase in aggregate demand? Falls unexpectedly from 100 to 90 because of a decrease in aggregate demand? Explain each situation.(b) What will be the long-run level of real GDP when the price level rises from 100 to 110? Falls from 100 to 90? Explain each situation.
(a) What will be the short-run level of real GDP if the price level rises unexpectedly from 100 to 110 because of an increase in aggregate demand? Falls unexpectedly from 100 to 90 because of a decrease in aggregate demand? Explain each situation.(b) What will be the long-run level of real GDP when the price level rises from 100 to 110? Falls from 100 to 90? Explain each situation. Question
Question
Question
Question
Question
Question
Question
Question
Question
Question
Question
Answer the questions based on the following diagram. 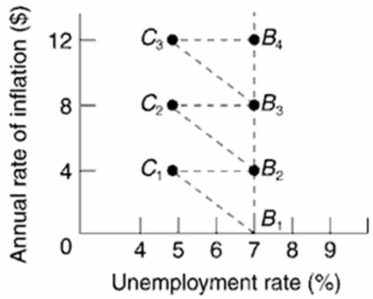 (a) Assume the economy is initially at point B1 and there is an increase in aggregate demand, which results in a 4% increase in prices.Describe the short-run and long-run outcomes that would result in this economy.(b) Assume the economy is initially at point B2, and there is an increase in aggregate demand.What will happen in the economy? Explain, using the graph.(c) Based on this diagram, what would the prediction be for the natural (full-employment) rate of unemployment?
(a) Assume the economy is initially at point B1 and there is an increase in aggregate demand, which results in a 4% increase in prices.Describe the short-run and long-run outcomes that would result in this economy.(b) Assume the economy is initially at point B2, and there is an increase in aggregate demand.What will happen in the economy? Explain, using the graph.(c) Based on this diagram, what would the prediction be for the natural (full-employment) rate of unemployment?
Unlock Deck
Sign up to unlock the cards in this deck!
Unlock Deck
Unlock Deck
1/28
Play
Full screen (f)
Deck 16: Part A: Long-Run Macroeconomic Adjustments
1
In general, the Canadian economy has experienced ongoing inflation.Explain how this is possible.
As the Canadian economy has grown, the long-run aggregate supply curve has shifted to the right - full-employment occurs at a higher level of real GDP.On its own, this would create deflation.At the same time, the Bank of Canada has increased the money supply and consequently, the aggregate demand curve has shifted to the right.On its own, this would create inflation.However, taken together, the two policies usually have the net effect of creating a small positive rate of inflation.In summary, the long-run aggregate supply curve in Canada is shifting to the right, but the aggregate demand curve is shifting to the right at a faster rate.
2
Explain the Phillips Curve concept and construct an example of the curve on the below graph.
The Phillips Curve concept shows a stable inverse relationship between the rate of unemployment and the rate of inflation.It is based on the idea that as aggregate demand increases when real GDP is relatively low, unemployment will decline and real GDP will rise with little or no inflationary effect.However, as aggregate demand continues to grow and the unemployment rate approaches full-employment, the price level and real GDP will increase.
3
Describe the characteristics of the long-run aggregate supply curve.Explain how changes in the price level affect the short-run aggregate supply curve and the long-run aggregate supply curve.
The long-run aggregate supply curve will be vertical at the full-employment level of output.Changes in the price level will not affect the full-employment level of output in the long-run.Changes in the short-run aggregate supply curve will define the long-run aggregate supply curve at the full-employment level of output.
With the short-run aggregate supply curve, as the price level increases from the full-employment level of output along the curve, revenues to the firm increase because nominal wages are fixed, and the profits for firms will rise.Firms will have an incentive to increase output and employment (hiring temporary or part-time workers or paying for overtime), so real GDP will increase and unemployment will fall below its natural rate.This situation is a short-run one because nominal wages (and other input prices) will eventually increase and shift the short-run aggregate supply curve to the left.The new equilibrium will return to the full-employment level of output, but at a higher price level.
Conversely, as the price level decreases from the full-employment level of output, revenues to the firm decrease and because nominal wages are fixed, the profits for firms will decrease.Firms will have an incentive to decrease output and employment, so real GDP will decrease and employment will fall below its natural rate.This situation is a short-run one because nominal wages (and other input prices) will eventually decrease and shift the short-run aggregate supply curve to the right.The new equilibrium will return to the full-employment level of output, but at a lower price level.
4
(a) Using a graph showing aggregate demand, short-run aggregate supply, and long-run aggregate supply, illustrate an economy that faces a recessionary gap. (b) Explain how the recessionary gap can be eliminated and evaluate the possibilities.
(b) Explain how the recessionary gap can be eliminated and evaluate the possibilities. Unlock Deck
Unlock for access to all 28 flashcards in this deck.
Unlock Deck
k this deck
5
Describe the process that occurs with demand-pull inflation in the long-run aggregate demand-aggregate supply model.Assume that the economy is initially at the full-employment level of real GDP.
Unlock Deck
Unlock for access to all 28 flashcards in this deck.
Unlock Deck
k this deck
6
What are three significant generalizations regarding the inflation-unemployment relationship that are supported by results from the long-run AD-AS model?
Unlock Deck
Unlock for access to all 28 flashcards in this deck.
Unlock Deck
k this deck
7
What is the Phillips Curve? What concept does it illustrate?
Unlock Deck
Unlock for access to all 28 flashcards in this deck.
Unlock Deck
k this deck
8
(a) Using a graph showing aggregate demand, short-run aggregate supply, and long-run aggregate supply, illustrate an economy that faces an inflationary gap. (b) Explain how the inflationary gap can be eliminated and evaluate the possibilities.
(b) Explain how the inflationary gap can be eliminated and evaluate the possibilities. Unlock Deck
Unlock for access to all 28 flashcards in this deck.
Unlock Deck
k this deck
9
Suppose the potential level of real GDP for a hypothetical economy is $160 and the price level (P) initially is 200.Use the following short-run aggregate supply schedules to answer the questions. (a) What will be the short-run level of real GDP if the price level rises unexpectedly from 200 to 210 because of an increase in aggregate demand? Falls unexpectedly from 200 to 190 because of a decrease in aggregate demand? Explain each situation.(b) What will be the long-run level of real GDP when the price level rises from 200 to 210? Falls from 200 to 190? Explain each situation.
(a) What will be the short-run level of real GDP if the price level rises unexpectedly from 200 to 210 because of an increase in aggregate demand? Falls unexpectedly from 200 to 190 because of a decrease in aggregate demand? Explain each situation.(b) What will be the long-run level of real GDP when the price level rises from 200 to 210? Falls from 200 to 190? Explain each situation. Unlock Deck
Unlock for access to all 28 flashcards in this deck.
Unlock Deck
k this deck
10
Differentiate between "demand-pull" and "cost-push" inflation using the aggregate demand-aggregate supply model.
Unlock Deck
Unlock for access to all 28 flashcards in this deck.
Unlock Deck
k this deck
11
What is the long-run equilibrium in the aggregate demand-aggregate supply model?
Unlock Deck
Unlock for access to all 28 flashcards in this deck.
Unlock Deck
k this deck
12
If the Phillips Curve exists in reality, what dilemma does this create for fiscal and monetary policies? Explain.
Unlock Deck
Unlock for access to all 28 flashcards in this deck.
Unlock Deck
k this deck
13
Describe cost-push inflation in the long-run aggregate demand-aggregate supply model.Explain the policy dilemma for government policy if no action is taken and if monetary and fiscal policies are used to counter the cost-push inflation.Assume that the economy is initially at the full-employment level of real GDP.
Unlock Deck
Unlock for access to all 28 flashcards in this deck.
Unlock Deck
k this deck
14
What contributed to stagflation's demise between 1982 and 1989? How did these events affect aggregate supply and the Phillips Curve?
Unlock Deck
Unlock for access to all 28 flashcards in this deck.
Unlock Deck
k this deck
15
Explain what happens in the long-run aggregate demand-aggregate supply model when there is a recession.Assume that the economy is initially at the full-employment level of real GDP.
Unlock Deck
Unlock for access to all 28 flashcards in this deck.
Unlock Deck
k this deck
16
Describe the characteristics of the short-run aggregate supply curve.Explain what happens to: (1) nominal wages; (2) real wages profits as the price level increases from the full-employment level of output.Then explain what happens to these variables as the price level decreases from the full-employment-level of output.
Unlock Deck
Unlock for access to all 28 flashcards in this deck.
Unlock Deck
k this deck
17
Suppose the potential level of real GDP for a hypothetical economy is $250 and the price level (P) initially is 100.Use the following short-run aggregate supply schedules below to answer the questions. (a) What will be the short-run level of real GDP if the price level rises unexpectedly from 100 to 110 because of an increase in aggregate demand? Falls unexpectedly from 100 to 90 because of a decrease in aggregate demand? Explain each situation.(b) What will be the long-run level of real GDP when the price level rises from 100 to 110? Falls from 100 to 90? Explain each situation.
(a) What will be the short-run level of real GDP if the price level rises unexpectedly from 100 to 110 because of an increase in aggregate demand? Falls unexpectedly from 100 to 90 because of a decrease in aggregate demand? Explain each situation.(b) What will be the long-run level of real GDP when the price level rises from 100 to 110? Falls from 100 to 90? Explain each situation. Unlock Deck
Unlock for access to all 28 flashcards in this deck.
Unlock Deck
k this deck
18
What is stagflation and what was one of its causes in the 1970s and early 1980s?
Unlock Deck
Unlock for access to all 28 flashcards in this deck.
Unlock Deck
k this deck
19
What is the basic difference between the short run and long run as these terms relate to macroeconomics? Why does this difference occur?
Unlock Deck
Unlock for access to all 28 flashcards in this deck.
Unlock Deck
k this deck
20
If the long-run supply curve is fixed in place, can there be persistent inflation?
Unlock Deck
Unlock for access to all 28 flashcards in this deck.
Unlock Deck
k this deck
21
Why is the difference between the actual and expected rates of inflation important for explaining falling inflation?
Unlock Deck
Unlock for access to all 28 flashcards in this deck.
Unlock Deck
k this deck
22
Explain the basic arguments for supply-side economics.
Unlock Deck
Unlock for access to all 28 flashcards in this deck.
Unlock Deck
k this deck
23
Using the Sherwood Forest example from the text, explain the Laffer curve.
Unlock Deck
Unlock for access to all 28 flashcards in this deck.
Unlock Deck
k this deck
24
Why is the difference between the actual and expected rates of inflation important for explaining rising inflation?
Unlock Deck
Unlock for access to all 28 flashcards in this deck.
Unlock Deck
k this deck
25
Compare and contrast the short-run Phillips Curve and the long-run Phillips Curve.
Unlock Deck
Unlock for access to all 28 flashcards in this deck.
Unlock Deck
k this deck
26
What are three severe criticisms of the Laffer Curve?
Unlock Deck
Unlock for access to all 28 flashcards in this deck.
Unlock Deck
k this deck
27
What is the Laffer Curve? Explain the relationship that is shown in the curve.
Unlock Deck
Unlock for access to all 28 flashcards in this deck.
Unlock Deck
k this deck
28
Answer the questions based on the following diagram. (a) Assume the economy is initially at point B1 and there is an increase in aggregate demand, which results in a 4% increase in prices.Describe the short-run and long-run outcomes that would result in this economy.(b) Assume the economy is initially at point B2, and there is an increase in aggregate demand.What will happen in the economy? Explain, using the graph.(c) Based on this diagram, what would the prediction be for the natural (full-employment) rate of unemployment?
(a) Assume the economy is initially at point B1 and there is an increase in aggregate demand, which results in a 4% increase in prices.Describe the short-run and long-run outcomes that would result in this economy.(b) Assume the economy is initially at point B2, and there is an increase in aggregate demand.What will happen in the economy? Explain, using the graph.(c) Based on this diagram, what would the prediction be for the natural (full-employment) rate of unemployment? Unlock Deck
Unlock for access to all 28 flashcards in this deck.
Unlock Deck
k this deck
Unlock Deck
Unlock for access to all 28 flashcards in this deck.


