Deck 10: Part A: Basic Macroeconomic Relationships
Full screen (f)
Question
Question
Question
Question
Complete the following table assuming that (a) MPS = 1/5, (b) there is no government and all saving is personal saving. 
Question
Question
Question
Complete the accompanying table.  Using the below graphs, show the consumption and saving schedules graphically.
  (b) Locate the break-even level of income.How is it possible for households to dissave at very low income levels?
(c) If the proportion of total income consumed decreases and the proportion saved increases as income rises, explain both verbally and graphically how the MPC and MPS can be constant at various levels of income.
Using the below graphs, show the consumption and saving schedules graphically. (b) Locate the break-even level of income.How is it possible for households to dissave at very low income levels?(c) If the proportion of total income consumed decreases and the proportion saved increases as income rises, explain both verbally and graphically how the MPC and MPS can be constant at various levels of income.
Question
Question
Question
Question
Question
Complete the following table assuming that (a) MPS = 1/3, (b) there is no government and all saving is personal saving. 
Question
Use the following data to answer the questions.  (a) Explain why this table is essentially an investment demand schedule.(b) If the interest rate was 8%, how much investment would be undertaken?
(c) Why is there an inverse relationship between the rate of interest and the amount of investment?
(a) Explain why this table is essentially an investment demand schedule.(b) If the interest rate was 8%, how much investment would be undertaken?(c) Why is there an inverse relationship between the rate of interest and the amount of investment?
Question
Complete the accompanying table.  (a) What is the break-even level of income? How is it possible for households to dissave at very low income levels?
(b) If the proportion of total income consumed decreases and the proportion saved increases as income rises, explain how the MPC and MPS can be constant at various levels of income.
(a) What is the break-even level of income? How is it possible for households to dissave at very low income levels?(b) If the proportion of total income consumed decreases and the proportion saved increases as income rises, explain how the MPC and MPS can be constant at various levels of income.
Question
Question
Question
Question
Question
Use the graphs below to answer the following questions: 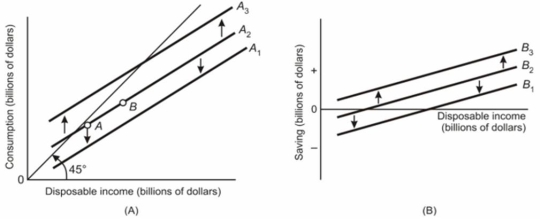 (a) What types of schedules do graphs A and B represent?
(b) If in graph A line A2 shifts to A3 because households consume more and this change is not due to changing taxes, then what would happen to line B2 in graph B?
(c) If in graph B, line B2 shifts to B1 because households save less, then what will happen to line A2 in graph A?
(d) In graph A, what has caused the movement from point A to point B on line A2?
(e) If there is a lump-sum tax increase causing line A2 to shift to A1, then in graph B, what will happen to B2?
(a) What types of schedules do graphs A and B represent?(b) If in graph A line A2 shifts to A3 because households consume more and this change is not due to changing taxes, then what would happen to line B2 in graph B?
(c) If in graph B, line B2 shifts to B1 because households save less, then what will happen to line A2 in graph A?
(d) In graph A, what has caused the movement from point A to point B on line A2?
(e) If there is a lump-sum tax increase causing line A2 to shift to A1, then in graph B, what will happen to B2?
Question
Question
Question
Question
Question
Question
Question

Unlock Deck
Sign up to unlock the cards in this deck!
Unlock Deck
Unlock Deck
1/26
Play
Full screen (f)
Deck 10: Part A: Basic Macroeconomic Relationships
1
Differentiate between the average propensity to consume and the marginal propensity to consume.
The average propensity to consume is defined as the relationship between the amount consumed relative to the level of income; it is (consumption)/(income).The marginal propensity to consume is a measure relating the change in consumption resulting from a change in income to that change in income; it is (change in consumption)/(change in income).
2
Describe the relationship shown by the investment demand curve.
The investment demand curve relates investment to the real rate of interest and the expected rate of return.Graphically the interest rate and expected rate of return are measured on the vertical axis and the amount of investment is measured on the horizontal axis.The investment demand curve has a negative slope reflecting the inverse relationship between the interest rate (the price of investing) and the aggregate quantity of investment goods demanded.
3
Suppose a family's annual disposable income is $8,000 of which it saves $2,000.(a) What is their APC?
(b) If their income rises to $10,000 and they plan to save $2,800, what are their MPS and MPC?
(c) Did the family's APC rise or fall with their increase in income?
(b) If their income rises to $10,000 and they plan to save $2,800, what are their MPS and MPC?
(c) Did the family's APC rise or fall with their increase in income?
(a) APC = .75 ($6,000/$8,000).
(b) MPS = .4 ($800/$2,000); MPC = .6 (1 - .4).
(c) APC fell to.72 ($7,200/$10,000).
(b) MPS = .4 ($800/$2,000); MPC = .6 (1 - .4).
(c) APC fell to.72 ($7,200/$10,000).
4
Complete the following table assuming that (a) MPS = 1/5, (b) there is no government and all saving is personal saving.
Unlock Deck
Unlock for access to all 26 flashcards in this deck.
Unlock Deck
k this deck
5
Describe the relationship between the Great Recession of 2008-2009 and the Paradox of Thrift.
Unlock Deck
Unlock for access to all 26 flashcards in this deck.
Unlock Deck
k this deck
6
What is the effect of increase in wealth on the consumption and saving schedules?
Unlock Deck
Unlock for access to all 26 flashcards in this deck.
Unlock Deck
k this deck
7
Complete the accompanying table. Using the below graphs, show the consumption and saving schedules graphically. (b) Locate the break-even level of income.How is it possible for households to dissave at very low income levels?
(c) If the proportion of total income consumed decreases and the proportion saved increases as income rises, explain both verbally and graphically how the MPC and MPS can be constant at various levels of income.
Using the below graphs, show the consumption and saving schedules graphically. (b) Locate the break-even level of income.How is it possible for households to dissave at very low income levels?(c) If the proportion of total income consumed decreases and the proportion saved increases as income rises, explain both verbally and graphically how the MPC and MPS can be constant at various levels of income.
Unlock Deck
Unlock for access to all 26 flashcards in this deck.
Unlock Deck
k this deck
8
List six events that could cause a shift in the investment demand curve to the right.
Unlock Deck
Unlock for access to all 26 flashcards in this deck.
Unlock Deck
k this deck
9
Define the consumption and saving schedules.
Unlock Deck
Unlock for access to all 26 flashcards in this deck.
Unlock Deck
k this deck
10
List four factors that could shift the current consumption schedule.
Unlock Deck
Unlock for access to all 26 flashcards in this deck.
Unlock Deck
k this deck
11
Describe the relationship between the Great Recession of 2008-2009 and the Investment Riddle.
Unlock Deck
Unlock for access to all 26 flashcards in this deck.
Unlock Deck
k this deck
12
Complete the following table assuming that (a) MPS = 1/3, (b) there is no government and all saving is personal saving.
Unlock Deck
Unlock for access to all 26 flashcards in this deck.
Unlock Deck
k this deck
13
Use the following data to answer the questions. (a) Explain why this table is essentially an investment demand schedule.(b) If the interest rate was 8%, how much investment would be undertaken?
(c) Why is there an inverse relationship between the rate of interest and the amount of investment?
(a) Explain why this table is essentially an investment demand schedule.(b) If the interest rate was 8%, how much investment would be undertaken?(c) Why is there an inverse relationship between the rate of interest and the amount of investment?
Unlock Deck
Unlock for access to all 26 flashcards in this deck.
Unlock Deck
k this deck
14
Complete the accompanying table. (a) What is the break-even level of income? How is it possible for households to dissave at very low income levels?
(b) If the proportion of total income consumed decreases and the proportion saved increases as income rises, explain how the MPC and MPS can be constant at various levels of income.
(a) What is the break-even level of income? How is it possible for households to dissave at very low income levels?(b) If the proportion of total income consumed decreases and the proportion saved increases as income rises, explain how the MPC and MPS can be constant at various levels of income.
Unlock Deck
Unlock for access to all 26 flashcards in this deck.
Unlock Deck
k this deck
15
State four factors that explain why investment spending tends to be unstable.
Unlock Deck
Unlock for access to all 26 flashcards in this deck.
Unlock Deck
k this deck
16
What are the marginal propensity to consume (MPC) and marginal propensity to save (MPS)? How are the two concepts related? How are the two concepts related to the consumption and saving functions?
Unlock Deck
Unlock for access to all 26 flashcards in this deck.
Unlock Deck
k this deck
17
Explain how consumption and saving are related to disposable income.
Unlock Deck
Unlock for access to all 26 flashcards in this deck.
Unlock Deck
k this deck
18
Suppose that the linear equation for consumption in a hypothetical economy is C = 50 + 0.9 Y.Also suppose that income (Y) is $400.Determine the following: (a) MPC; (b) MPS; (c) level of consumption; (d) APC; (e) APS.
Unlock Deck
Unlock for access to all 26 flashcards in this deck.
Unlock Deck
k this deck
19
Use the graphs below to answer the following questions: (a) What types of schedules do graphs A and B represent?
(b) If in graph A line A2 shifts to A3 because households consume more and this change is not due to changing taxes, then what would happen to line B2 in graph B?
(c) If in graph B, line B2 shifts to B1 because households save less, then what will happen to line A2 in graph A?
(d) In graph A, what has caused the movement from point A to point B on line A2?
(e) If there is a lump-sum tax increase causing line A2 to shift to A1, then in graph B, what will happen to B2?
(a) What types of schedules do graphs A and B represent?(b) If in graph A line A2 shifts to A3 because households consume more and this change is not due to changing taxes, then what would happen to line B2 in graph B?
(c) If in graph B, line B2 shifts to B1 because households save less, then what will happen to line A2 in graph A?
(d) In graph A, what has caused the movement from point A to point B on line A2?
(e) If there is a lump-sum tax increase causing line A2 to shift to A1, then in graph B, what will happen to B2?
Unlock Deck
Unlock for access to all 26 flashcards in this deck.
Unlock Deck
k this deck
20
Explain the difference between a movement along the consumption schedule and a shift in the consumption schedule.
Unlock Deck
Unlock for access to all 26 flashcards in this deck.
Unlock Deck
k this deck
21
Describe the relationship between the size of the MPC and the multiplier.How does it compare to the relationship between the size of the MPS and the multiplier?
Unlock Deck
Unlock for access to all 26 flashcards in this deck.
Unlock Deck
k this deck
22
What are the relationships between the multiplier and the marginal propensities to consume and save?
Unlock Deck
Unlock for access to all 26 flashcards in this deck.
Unlock Deck
k this deck
23
Most economists regard investment demand as being less stable than the income-consumption relationship.Looking at the determinants of the two relationships, support this contention.
Unlock Deck
Unlock for access to all 26 flashcards in this deck.
Unlock Deck
k this deck
24
Explain the economic impact of an increase in the multiplier.
Unlock Deck
Unlock for access to all 26 flashcards in this deck.
Unlock Deck
k this deck
25
Define the multiplier.How is it related to real GDP and the initial change in spending? How can the multiplier have a negative effect?
Unlock Deck
Unlock for access to all 26 flashcards in this deck.
Unlock Deck
k this deck
26
What are two key facts that serve as the rationale for the multiplier effect?
Unlock Deck
Unlock for access to all 26 flashcards in this deck.
Unlock Deck
k this deck
Unlock Deck
Unlock for access to all 26 flashcards in this deck.


