Deck 37: Structural Stagnation and Globalization
Full screen (f)
Question
Question
Question
Question
Question
Question
Question
Question
Question
Question
Question
Question
Question
Question
Question
Question
Question
Question
Question
Question
Question
Question
Question
Refer to the graph. The economy begins at a level of output of $20 billion and experiences a one year recession in which output declines by 4 percent. By what rate per year must the economy expand, after it has reached its trough, to return to its potential output by year 3? 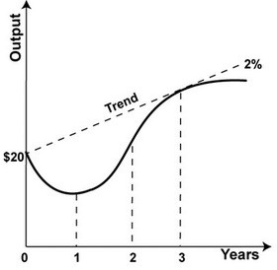
A)About 3 percent
B)About 5 percent
C)About 8 percent
D)About 10 percent
A)About 3 percent
B)About 5 percent
C)About 8 percent
D)About 10 percent
Question
Question
Question
Question
Refer to the graph. Economic output in year 0 is $20 billion. What is potential output in year 1? 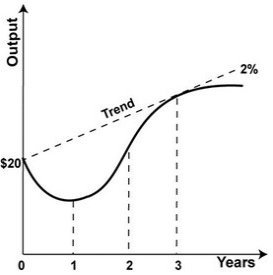
A)$20 billion
B)$20.4 billion
C)$20.8 billion
D)$21.2 billion
A)$20 billion
B)$20.4 billion
C)$20.8 billion
D)$21.2 billion
Question
Question
Refer to the graph. 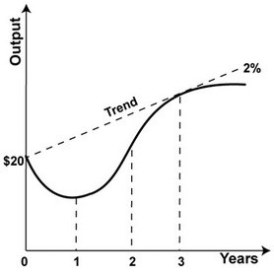 The economy begins at a level of output of $20 billion and experiences a one-year recession in which output declines by 4 percent. What is output in year 1?
A)$800 million
B)$800 billion
C)$19.2 million
D)$19.2 billion
The economy begins at a level of output of $20 billion and experiences a one-year recession in which output declines by 4 percent. What is output in year 1?A)$800 million
B)$800 billion
C)$19.2 million
D)$19.2 billion
Question
Question
Refer to the graph shown. Economic output in year 0 is $50 billion. What is potential output in year 3? 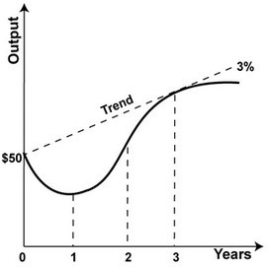
A)$47.0 billion
B)$50 billion
C)$54.6 billion
D)$56.3 billion
A)$47.0 billion
B)$50 billion
C)$54.6 billion
D)$56.3 billion
Question
Refer to the graph. Economic output in year 0 is $20 billion. What is potential output in year 2? 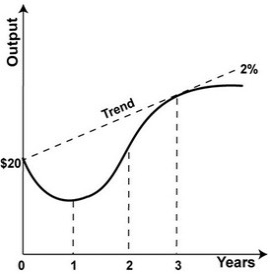
A)$20 billion
B)$20.4 billion
C)$20.8 billion
D)$21.2 billion
A)$20 billion
B)$20.4 billion
C)$20.8 billion
D)$21.2 billion
Question
Refer to the graph. The economy begins at a level of output of $20 billion and experiences a one year recession in which output declines by 4 percent. By what rate must the economy expand to return to potential output by year 2? 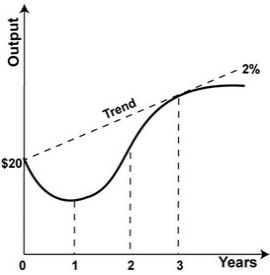
A)About 4 percent
B)About 6 percent
C)About 8 percent
D)About 10 percent
A)About 4 percent
B)About 6 percent
C)About 8 percent
D)About 10 percent
Question
Refer to the graph. Economic output in year 0 is $20 billion. What is potential output in year 3? 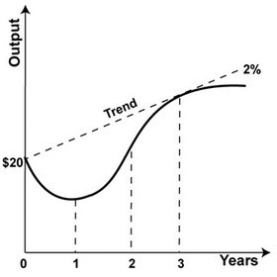
A)$20 billion
B)$20.4 billion
C)$20.8 billion
D)$21.2 billion
A)$20 billion
B)$20.4 billion
C)$20.8 billion
D)$21.2 billion
Question
Question
Question
Refer to the graph shown. The economy begins at a level of output of $50 billion and experiences a one year recession in which output declines by 3 percent. What is output in year 1? 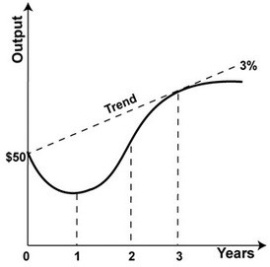
A)$1.50 billion
B)$15 billion
C)$48.5 million
D)$51.5 billion
A)$1.50 billion
B)$15 billion
C)$48.5 million
D)$51.5 billion
Question
Refer to the graph shown. Economic output in year 0 is $50 billion. What is potential output in year 2? 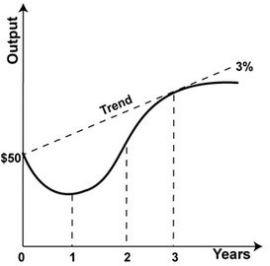
A)$50 billion
B)$51.5 billion
C)$53.0 billion
D)$54.6 billion
A)$50 billion
B)$51.5 billion
C)$53.0 billion
D)$54.6 billion
Question
Refer to the graph shown. The economy begins at a level of output of $50 billion and experiences a one-year recession in which output declines by 3 percent. By what rate must the economy expand to return to potential output by year 2? 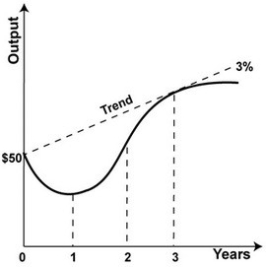
A)About 3 percent
B)About 4 percent
C)About 6 percent
D)About 9 percent
A)About 3 percent
B)About 4 percent
C)About 6 percent
D)About 9 percent
Question
Question
Question
Question
Which of the following statements best describes the figure shown? 
A)The world price level equals the domestic price level.
B)The economy is operating below potential because of globalization.
C)Domestic aggregate supply is less than domestic aggregate demand.
D)Potential output is constrained by globalization.
A)The world price level equals the domestic price level.
B)The economy is operating below potential because of globalization.
C)Domestic aggregate supply is less than domestic aggregate demand.
D)Potential output is constrained by globalization.
Question
Question
Refer to the graph shown. According to the globalized AS/AD model, which world aggregate supply curve best represents the 2000s? 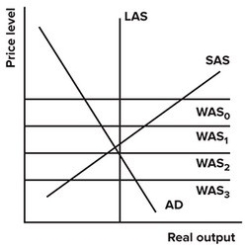
A)WAS0, and the United States had a large trade surplus.
B)WAS1, and the United States had a small trade deficit.
C)WAS2, and the United States had a small trade surplus.
D)WAS3, and the United States had a large trade deficit.
A)WAS0, and the United States had a large trade surplus.
B)WAS1, and the United States had a small trade deficit.
C)WAS2, and the United States had a small trade surplus.
D)WAS3, and the United States had a large trade deficit.
Question
In the figure shown, 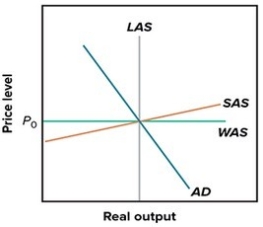
A)there is a trade deficit because of globalization.
B)there is a trade surplus, because actual output equals potential output.
C)there is a trade balance, because the world price level equals the domestic price level.
D)the country isn't exporting or importing because world and domestic prices are equal.
Question
Question
Question
Question
In the figure shown, domestic production 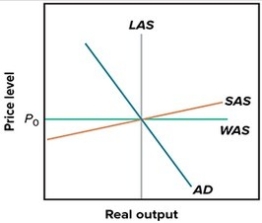
A)exceeds global constrained potential output.
B)is less than exports less imports.
C)exceeds global constrained prices.
D)equals domestic consumption.
A)exceeds global constrained potential output.
B)is less than exports less imports.
C)exceeds global constrained prices.
D)equals domestic consumption.
Question
Question
Question
Question
Which of the lines represent the structural stagnation's assumption about trend growth? 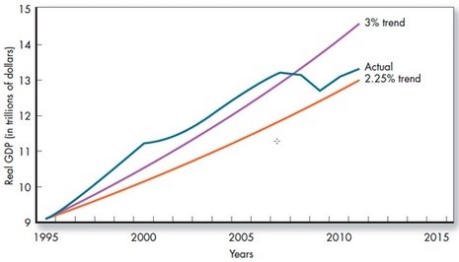
A)3 percent trend
B)Actual
C)2.25 percent trend
D)It is not represented
A)3 percent trend
B)Actual
C)2.25 percent trend
D)It is not represented
Question
Question
Question
Question
Question
Question
Question
Question
In the graph shown, what would shift the WAS curve from WAS0 to WAS1? 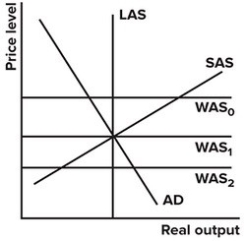
A)The country's exchange rate appreciates.
B)Domestic reservation wages fall.
C)Input prices fall.
D)Government runs contractionary policy.
A)The country's exchange rate appreciates.
B)Domestic reservation wages fall.
C)Input prices fall.
D)Government runs contractionary policy.
Question
In the graph shown, an upward shift in the WAS curve: 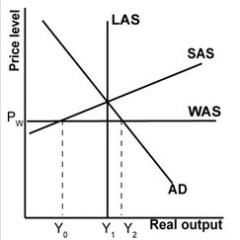
A)raises domestic consumption, because domestic producers will produce more.
B)lowers the trade deficit, because domestic producers are more competitive.
C)lowers domestic production, because domestic consumption has fallen.
D)raises globalized potential output, because U.S. producers are less competitive.
Question
Question
In the graph shown, which of the world supply curves create a trade surplus? 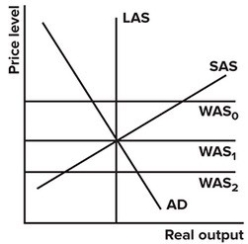
A)WAS0
B)WAS1
C)WAS2
D)None create surpluses.
A)WAS0
B)WAS1
C)WAS2
D)None create surpluses.
Question
In the graph shown, the country has: 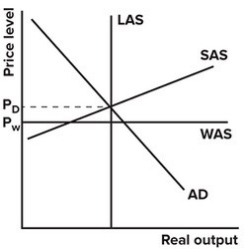
A)a trade surplus.
B)a budget deficit.
C)a trade deficit.
D)neither a trade deficit nor trade surplus; exports are equal to imports.
A)a trade surplus.
B)a budget deficit.
C)a trade deficit.
D)neither a trade deficit nor trade surplus; exports are equal to imports.
Question
In the graph shown, which of the world supply curves is associated with a trade balance? 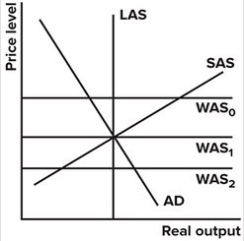
A)WAS0
B)WAS1
C)WAS2
D)None create surpluses.
A)WAS0
B)WAS1
C)WAS2
D)None create surpluses.
Question
In the graph shown, which of the world supply curves create a trade deficit? 
A)WAS0
B)WAS1
C)WAS2
D)None create deficits.
A)WAS0
B)WAS1
C)WAS2
D)None create deficits.
Question
Question
Question
In the graph shown, what would eliminate a trade deficit if there were one? 
A)The exchange rate appreciates.
B)Domestic reservation wages rise.
C)Foreign wages rise relative to domestic wages.
D)Government runs expansionary policy.
A)The exchange rate appreciates.
B)Domestic reservation wages rise.
C)Foreign wages rise relative to domestic wages.
D)Government runs expansionary policy.
Question
Question
In the graph shown, the globally constrained potential output is: 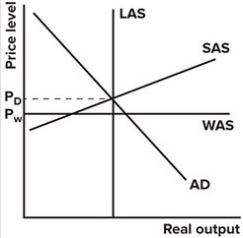
A)to the right of the LAS curve shown.
B)to the left of the LAS curve shown.
C)the same as the LAS curve shown.
D)the LAS curve shown, but horizontal.
A)to the right of the LAS curve shown.
B)to the left of the LAS curve shown.
C)the same as the LAS curve shown.
D)the LAS curve shown, but horizontal.
Question
Question
In the graph shown, what could balance the trade deficit (reduce domestic consumption)? 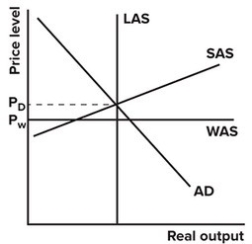
A)Contractionary monetary policy
B)Lower domestic wages
C)A hurricane that damages domestic manufacturing plants
D)Expansionary fiscal policy
A)Contractionary monetary policy
B)Lower domestic wages
C)A hurricane that damages domestic manufacturing plants
D)Expansionary fiscal policy
Question
Question
In the graph shown, a shift in the AD curve to the right: 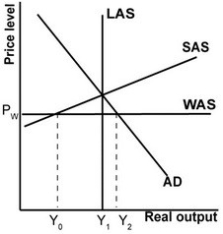
A)raises domestic consumption.
B)lowers domestic consumption.
C)lowers globally constrained potential output.
D)causes goods inflation.
A)raises domestic consumption.
B)lowers domestic consumption.
C)lowers globally constrained potential output.
D)causes goods inflation.
Question
In the graph shown, a downward shift in the SAS curve: 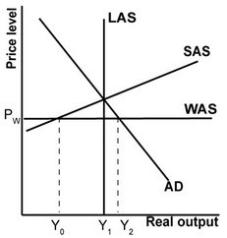
A)raises domestic consumption, because domestic producers produce more.
B)raises the trade deficit, because domestic producers are more competitive.
C)raises domestic production, because input prices have fallen.
D)lowers globalized potential output, because domestic producers are more competitive.
A)raises domestic consumption, because domestic producers produce more.
B)raises the trade deficit, because domestic producers are more competitive.
C)raises domestic production, because input prices have fallen.
D)lowers globalized potential output, because domestic producers are more competitive.
Question
Refer to the graph shown. What will reduce the trade deficit? 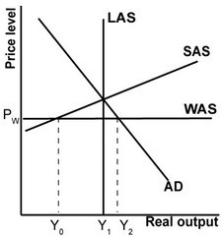
A)The AD curve shifts to the left.
B)The SAS curve shifts down.
C)The WAS curve shifts up.
D)All the answers are correct.
A)The AD curve shifts to the left.
B)The SAS curve shifts down.
C)The WAS curve shifts up.
D)All the answers are correct.
Question
Looking at the graph shown, the structural adjustments necessary to bring the economy back to domestic and international equilibrium include: 
A)an increase in the U.S. exchange rate.
B)an increase in the U.S. wages and costs of production.
C)an increase in aggregate demand.
D)a fall in the U.S. exchange rate.
A)an increase in the U.S. exchange rate.
B)an increase in the U.S. wages and costs of production.
C)an increase in aggregate demand.
D)a fall in the U.S. exchange rate.

Unlock Deck
Sign up to unlock the cards in this deck!
Unlock Deck
Unlock Deck
1/125
Play
Full screen (f)
Deck 37: Structural Stagnation and Globalization
1
According to the structural stagnation hypothesis, expansionary macro policy tends to lead to:
A)goods inflation.
B)goods deflation.
C)asset price inflation.
D)low exchange rates.
A)goods inflation.
B)goods deflation.
C)asset price inflation.
D)low exchange rates.
asset price inflation.
2
According to the structural stagnation hypothesis, what is the long-run cause of the recent problems facing the United States?
A)Globalization
B)Too-low investment
C)Inflation
D)Unemployment
A)Globalization
B)Too-low investment
C)Inflation
D)Unemployment
Globalization
3
The U.S. economy is currently experiencing a standard business cycle.
False
4
Solutions to structural stagnation require difficult supply-side structural changes to accompany any demand-side stimulus if they are to be successful in reducing unemployment significantly.
Unlock Deck
Unlock for access to all 125 flashcards in this deck.
Unlock Deck
k this deck
5
The government can deal with the effects of the decline in wealth, without causing new problems down the road.
Unlock Deck
Unlock for access to all 125 flashcards in this deck.
Unlock Deck
k this deck
6
What is the difference between the structural stagnation hypothesis and the secular stagnation theory?
A)Structural stagnation sees globalization as the cause of a stagnation, while secular stagnation sees too little investment as the cause.
B)Structural stagnation sees too little investment as the cause of a stagnation, while secular stagnation sees globalization as the cause.
C)Structural stagnation sees foreign countries moving down the value-added chain as the cause of a stagnation, while secular stagnation sees foreign countries moving up the value-added chain as the cause of a stagnation.
D)There is no difference, they both attribute stagnation to too little investment.
Unlock Deck
Unlock for access to all 125 flashcards in this deck.
Unlock Deck
k this deck
7
A trade surplus results when the world supply curve is below the domestic economy's price level.
Unlock Deck
Unlock for access to all 125 flashcards in this deck.
Unlock Deck
k this deck
8
The central difference between the standard theory and the structural stagnation hypothesis, when it comes to growth, is:
A)the level of inflation.
B)the trend growth rate.
C)the federal funds rate.
D)the natural rate of unemployment.
A)the level of inflation.
B)the trend growth rate.
C)the federal funds rate.
D)the natural rate of unemployment.
Unlock Deck
Unlock for access to all 125 flashcards in this deck.
Unlock Deck
k this deck
9
If an economy has a trade deficit, shifting the domestic SAS curve down will shift the globally-constrained potential output to the right.
Unlock Deck
Unlock for access to all 125 flashcards in this deck.
Unlock Deck
k this deck
10
Suppose an economy's trend growth rate is 3 percent and current output is $10 trillion. If the economy enters a recession where output declines by 5 percent in one year, by how much does output have to rise to return to its trend? Assume it takes two years for the economy to return to its trend.
A)$0.5 trillion
B)$0.6 trillion
C)$1.4 trillion
D)$1.7 trillion
A)$0.5 trillion
B)$0.6 trillion
C)$1.4 trillion
D)$1.7 trillion
Unlock Deck
Unlock for access to all 125 flashcards in this deck.
Unlock Deck
k this deck
11
According to the structural stagnation hypothesis, structural stagnation has only short-run causes.
Unlock Deck
Unlock for access to all 125 flashcards in this deck.
Unlock Deck
k this deck
12
The United States has done very poorly at the high end of the value-added chain.
Unlock Deck
Unlock for access to all 125 flashcards in this deck.
Unlock Deck
k this deck
13
The globalized AS/AD model takes trade into account, while the standard AD/AS model does not.
Unlock Deck
Unlock for access to all 125 flashcards in this deck.
Unlock Deck
k this deck
14
When the financial crisis occurred, policy makers were more concerned about the deficit than they were about addressing the financial crisis.
Unlock Deck
Unlock for access to all 125 flashcards in this deck.
Unlock Deck
k this deck
15
According to structural stagnationists, expansionary monetary and fiscal policy has allowed the economy to address its structural problems and adjust in an expedient manner.
Unlock Deck
Unlock for access to all 125 flashcards in this deck.
Unlock Deck
k this deck
16
To remain on its growth trend, an economy must grow more in an expansion than it fell during a recession.
Unlock Deck
Unlock for access to all 125 flashcards in this deck.
Unlock Deck
k this deck
17
The economy recovered quickly from the 2007 recession and returned to its trend growth path.
Unlock Deck
Unlock for access to all 125 flashcards in this deck.
Unlock Deck
k this deck
18
The housing market boom raised people's perceived wealth.
Unlock Deck
Unlock for access to all 125 flashcards in this deck.
Unlock Deck
k this deck
19
The higher the reservation wage, the more likely one is to be unemployed.
Unlock Deck
Unlock for access to all 125 flashcards in this deck.
Unlock Deck
k this deck
20
Structural problems associated with globalization are no longer a concern for policy makers or economists.
Unlock Deck
Unlock for access to all 125 flashcards in this deck.
Unlock Deck
k this deck
21
The short-run cause of structural stagnation is tied to:
A)globalization.
B)the financial crisis aftermath.
C)the trade deficit.
D)exchange rates.
A)globalization.
B)the financial crisis aftermath.
C)the trade deficit.
D)exchange rates.
Unlock Deck
Unlock for access to all 125 flashcards in this deck.
Unlock Deck
k this deck
22
The structural stagnation hypothesis provides a general explanation for why:
A)the economy is experiencing a weak recovery.
B)a bubble occurred in the housing market.
C)demand-side policies have been successful in the economic recovery in 2010-12.
D)the economy is experiencing such a strong recovery.
A)the economy is experiencing a weak recovery.
B)a bubble occurred in the housing market.
C)demand-side policies have been successful in the economic recovery in 2010-12.
D)the economy is experiencing such a strong recovery.
Unlock Deck
Unlock for access to all 125 flashcards in this deck.
Unlock Deck
k this deck
23
Refer to the graph. The economy begins at a level of output of $20 billion and experiences a one year recession in which output declines by 4 percent. By what rate per year must the economy expand, after it has reached its trough, to return to its potential output by year 3?
A)About 3 percent
B)About 5 percent
C)About 8 percent
D)About 10 percent
A)About 3 percent
B)About 5 percent
C)About 8 percent
D)About 10 percent
Unlock Deck
Unlock for access to all 125 flashcards in this deck.
Unlock Deck
k this deck
24
Structural stagnation cannot be treated as a normal business cycle because it:
A)only happens once every 30 years.
B)only occurs as result of hyperinflation.
C)is far less responsive to typical demand-side policies.
D)is far less responsive to supply-side policies.
A)only happens once every 30 years.
B)only occurs as result of hyperinflation.
C)is far less responsive to typical demand-side policies.
D)is far less responsive to supply-side policies.
Unlock Deck
Unlock for access to all 125 flashcards in this deck.
Unlock Deck
k this deck
25
If an economy declined by 3 percent in one year, in order for the economy to return to trend growth within two years, it would have to increase at an annual rate that is
A)less than 3 percent.
B)equal to 3 percent.
C)greater than 3 percent.
D)unknown.
A)less than 3 percent.
B)equal to 3 percent.
C)greater than 3 percent.
D)unknown.
Unlock Deck
Unlock for access to all 125 flashcards in this deck.
Unlock Deck
k this deck
26
In order for the economy to return to its growth rate, the rate at which the economy expands must be:
A)equal to the trend rate.
B)less than the trend rate.
C)greater than the trend rate.
D)equal to the rate of inflation.
A)equal to the trend rate.
B)less than the trend rate.
C)greater than the trend rate.
D)equal to the rate of inflation.
Unlock Deck
Unlock for access to all 125 flashcards in this deck.
Unlock Deck
k this deck
27
Refer to the graph. Economic output in year 0 is $20 billion. What is potential output in year 1?
A)$20 billion
B)$20.4 billion
C)$20.8 billion
D)$21.2 billion
A)$20 billion
B)$20.4 billion
C)$20.8 billion
D)$21.2 billion
Unlock Deck
Unlock for access to all 125 flashcards in this deck.
Unlock Deck
k this deck
28
If the structural stagnation hypothesis is correct, demand-side government policy has been far too expansionary since the mid:
A)2000s.
B)1980s.
C)1990s.
D)1970s.
A)2000s.
B)1980s.
C)1990s.
D)1970s.
Unlock Deck
Unlock for access to all 125 flashcards in this deck.
Unlock Deck
k this deck
29
Refer to the graph. The economy begins at a level of output of $20 billion and experiences a one-year recession in which output declines by 4 percent. What is output in year 1?
A)$800 million
B)$800 billion
C)$19.2 million
D)$19.2 billion
The economy begins at a level of output of $20 billion and experiences a one-year recession in which output declines by 4 percent. What is output in year 1?A)$800 million
B)$800 billion
C)$19.2 million
D)$19.2 billion
Unlock Deck
Unlock for access to all 125 flashcards in this deck.
Unlock Deck
k this deck
30
What does the structural stagnation hypothesis say about how soon the economy will return to its trend growth?
A)The economy has already returned to its previous trend growth rate.
B)The economy will return to its previous trend growth rate soon.
C)It will be a long time before the economy returns to its previous trend growth rate.
D)The economy will never return to its previous trend growth rate.
A)The economy has already returned to its previous trend growth rate.
B)The economy will return to its previous trend growth rate soon.
C)It will be a long time before the economy returns to its previous trend growth rate.
D)The economy will never return to its previous trend growth rate.
Unlock Deck
Unlock for access to all 125 flashcards in this deck.
Unlock Deck
k this deck
31
Refer to the graph shown. Economic output in year 0 is $50 billion. What is potential output in year 3?
A)$47.0 billion
B)$50 billion
C)$54.6 billion
D)$56.3 billion
A)$47.0 billion
B)$50 billion
C)$54.6 billion
D)$56.3 billion
Unlock Deck
Unlock for access to all 125 flashcards in this deck.
Unlock Deck
k this deck
32
Refer to the graph. Economic output in year 0 is $20 billion. What is potential output in year 2?
A)$20 billion
B)$20.4 billion
C)$20.8 billion
D)$21.2 billion
A)$20 billion
B)$20.4 billion
C)$20.8 billion
D)$21.2 billion
Unlock Deck
Unlock for access to all 125 flashcards in this deck.
Unlock Deck
k this deck
33
Refer to the graph. The economy begins at a level of output of $20 billion and experiences a one year recession in which output declines by 4 percent. By what rate must the economy expand to return to potential output by year 2?
A)About 4 percent
B)About 6 percent
C)About 8 percent
D)About 10 percent
A)About 4 percent
B)About 6 percent
C)About 8 percent
D)About 10 percent
Unlock Deck
Unlock for access to all 125 flashcards in this deck.
Unlock Deck
k this deck
34
Refer to the graph. Economic output in year 0 is $20 billion. What is potential output in year 3?
A)$20 billion
B)$20.4 billion
C)$20.8 billion
D)$21.2 billion
A)$20 billion
B)$20.4 billion
C)$20.8 billion
D)$21.2 billion
Unlock Deck
Unlock for access to all 125 flashcards in this deck.
Unlock Deck
k this deck
35
The hypothesis about the macro economy that sees the recent problems of the U.S. economy directly related to the structural problems caused by globalization is referred to as the ________ hypothesis.
A)low investment
B)secular stagnation
C)structural stagnation
D)comparative stagnation
A)low investment
B)secular stagnation
C)structural stagnation
D)comparative stagnation
Unlock Deck
Unlock for access to all 125 flashcards in this deck.
Unlock Deck
k this deck
36
Structural stagnation is used to describe a:
A)downturn, followed by a period of slow growth that is not expected to speed up anytime soon without major structural changes in the economy.
B)downturn, followed by a period of slow growth that is not expected to speed up anytime soon without major political changes in the economy.
C)downturn, followed by a period of slow growth that is not expected to speed up anytime soon without major legal changes in the economy.
D)downturn, followed by a period of slow growth that is not expected to speed up anytime soon without major cyclical changes in the economy.
Unlock Deck
Unlock for access to all 125 flashcards in this deck.
Unlock Deck
k this deck
37
Refer to the graph shown. The economy begins at a level of output of $50 billion and experiences a one year recession in which output declines by 3 percent. What is output in year 1?
A)$1.50 billion
B)$15 billion
C)$48.5 million
D)$51.5 billion
A)$1.50 billion
B)$15 billion
C)$48.5 million
D)$51.5 billion
Unlock Deck
Unlock for access to all 125 flashcards in this deck.
Unlock Deck
k this deck
38
Refer to the graph shown. Economic output in year 0 is $50 billion. What is potential output in year 2?
A)$50 billion
B)$51.5 billion
C)$53.0 billion
D)$54.6 billion
A)$50 billion
B)$51.5 billion
C)$53.0 billion
D)$54.6 billion
Unlock Deck
Unlock for access to all 125 flashcards in this deck.
Unlock Deck
k this deck
39
Refer to the graph shown. The economy begins at a level of output of $50 billion and experiences a one-year recession in which output declines by 3 percent. By what rate must the economy expand to return to potential output by year 2?
A)About 3 percent
B)About 4 percent
C)About 6 percent
D)About 9 percent
A)About 3 percent
B)About 4 percent
C)About 6 percent
D)About 9 percent
Unlock Deck
Unlock for access to all 125 flashcards in this deck.
Unlock Deck
k this deck
40
Under the standard macro policy, the long-run trend growth rate is assumed to be:
A)1 to 2 percent.
B)5 to 6 percent.
C)3 to 3.5 percent.
D)0 to 1 percent.
A)1 to 2 percent.
B)5 to 6 percent.
C)3 to 3.5 percent.
D)0 to 1 percent.
Unlock Deck
Unlock for access to all 125 flashcards in this deck.
Unlock Deck
k this deck
41
Looking at the globalized AS/AD model, the economy can exceed potential output, without generating accelerating goods inflation, because:
A)the world price level puts a cap on the domestic price level.
B)the domestic price level always exceeds the world price level.
C)the world price level always exceeds the domestic price level.
D)the LRAS curve is no longer vertical.
A)the world price level puts a cap on the domestic price level.
B)the domestic price level always exceeds the world price level.
C)the world price level always exceeds the domestic price level.
D)the LRAS curve is no longer vertical.
Unlock Deck
Unlock for access to all 125 flashcards in this deck.
Unlock Deck
k this deck
42
Structural stagnation focuses on ________ in terms of understanding why the economy experiences slow growth.
A)low investment
B)low consumption
C)low government spending
D)globalization
A)low investment
B)low consumption
C)low government spending
D)globalization
Unlock Deck
Unlock for access to all 125 flashcards in this deck.
Unlock Deck
k this deck
43
Which of the following statements best describes the figure shown?
A)The world price level equals the domestic price level.
B)The economy is operating below potential because of globalization.
C)Domestic aggregate supply is less than domestic aggregate demand.
D)Potential output is constrained by globalization.
A)The world price level equals the domestic price level.
B)The economy is operating below potential because of globalization.
C)Domestic aggregate supply is less than domestic aggregate demand.
D)Potential output is constrained by globalization.
Unlock Deck
Unlock for access to all 125 flashcards in this deck.
Unlock Deck
k this deck
44
The globalized AS/AD curve is the standard AS/AD model with an added:
A)world demand curve.
B)domestic supply curve.
C)world supply curve.
D)long-run aggregate supply curve.
A)world demand curve.
B)domestic supply curve.
C)world supply curve.
D)long-run aggregate supply curve.
Unlock Deck
Unlock for access to all 125 flashcards in this deck.
Unlock Deck
k this deck
45
Refer to the graph shown. According to the globalized AS/AD model, which world aggregate supply curve best represents the 2000s?
A)WAS0, and the United States had a large trade surplus.
B)WAS1, and the United States had a small trade deficit.
C)WAS2, and the United States had a small trade surplus.
D)WAS3, and the United States had a large trade deficit.
A)WAS0, and the United States had a large trade surplus.
B)WAS1, and the United States had a small trade deficit.
C)WAS2, and the United States had a small trade surplus.
D)WAS3, and the United States had a large trade deficit.
Unlock Deck
Unlock for access to all 125 flashcards in this deck.
Unlock Deck
k this deck
46
In the figure shown,
A)there is a trade deficit because of globalization.
B)there is a trade surplus, because actual output equals potential output.
C)there is a trade balance, because the world price level equals the domestic price level.
D)the country isn't exporting or importing because world and domestic prices are equal.
Unlock Deck
Unlock for access to all 125 flashcards in this deck.
Unlock Deck
k this deck
47
If foreign producers can supply an infinite amount of tradable goods at the world price, this would imply that the world supply curve is:
A)horizontal.
B)downward-sloping.
C)vertical.
D)upward-sloping.
A)horizontal.
B)downward-sloping.
C)vertical.
D)upward-sloping.
Unlock Deck
Unlock for access to all 125 flashcards in this deck.
Unlock Deck
k this deck
48
According to the structural stagnation theory,
A)U.S. economic growth will return to the world average growth rate, but by that time, the U.S. share of world output will have declined.
B)U.S. economic growth will return to the world average growth rate, and its current share of world output will remain unchanged.
C)U.S. economic growth will never return to the world average growth rate, because foreign economies have so far to catch up.
D)After a period of slower growth, U.S. economic growth will exceed world growth.
Unlock Deck
Unlock for access to all 125 flashcards in this deck.
Unlock Deck
k this deck
49
After the Great Depression, an explanation for why output growth would stop is called:
A)the structural stagnation hypothesis.
B)secular stagnation theory.
C)the frictional stagnation hypothesis.
D)the slow growth model.
A)the structural stagnation hypothesis.
B)secular stagnation theory.
C)the frictional stagnation hypothesis.
D)the slow growth model.
Unlock Deck
Unlock for access to all 125 flashcards in this deck.
Unlock Deck
k this deck
50
In the figure shown, domestic production
A)exceeds global constrained potential output.
B)is less than exports less imports.
C)exceeds global constrained prices.
D)equals domestic consumption.
A)exceeds global constrained potential output.
B)is less than exports less imports.
C)exceeds global constrained prices.
D)equals domestic consumption.
Unlock Deck
Unlock for access to all 125 flashcards in this deck.
Unlock Deck
k this deck
51
According to the globalized AS/AD model, expansionary monetary policy shifts the AD curve to the right and:
A)increases goods inflation.
B)has no effect on goods inflation.
C)shifts potential output to the right.
D)shifts potential output to the left.
A)increases goods inflation.
B)has no effect on goods inflation.
C)shifts potential output to the right.
D)shifts potential output to the left.
Unlock Deck
Unlock for access to all 125 flashcards in this deck.
Unlock Deck
k this deck
52
How is the globalized AS/AD model different from the standard AS/AD model?
A)It has an added world demand curve.
B)The AD curve is upward sloping.
C)It has an added world supply curve.
D)The AS curve is downward sloping.
A)It has an added world demand curve.
B)The AD curve is upward sloping.
C)It has an added world supply curve.
D)The AS curve is downward sloping.
Unlock Deck
Unlock for access to all 125 flashcards in this deck.
Unlock Deck
k this deck
53
If the structural stagnation hypothesis is true, what happened to the economy in the early 2000s that made it prone to a financial crisis?
A)Too-expansionary demand-side policies
B)Too-expansionary supply-side policies
C)Increased trade restrictions
D)Slowing technological advance
A)Too-expansionary demand-side policies
B)Too-expansionary supply-side policies
C)Increased trade restrictions
D)Slowing technological advance
Unlock Deck
Unlock for access to all 125 flashcards in this deck.
Unlock Deck
k this deck
54
Which of the lines represent the structural stagnation's assumption about trend growth?
A)3 percent trend
B)Actual
C)2.25 percent trend
D)It is not represented
A)3 percent trend
B)Actual
C)2.25 percent trend
D)It is not represented
Unlock Deck
Unlock for access to all 125 flashcards in this deck.
Unlock Deck
k this deck
55
In the globalized AS/AD model, the world supply curve is:
A)horizontal.
B)downward-sloping.
C)vertical.
D)upward-sloping.
A)horizontal.
B)downward-sloping.
C)vertical.
D)upward-sloping.
Unlock Deck
Unlock for access to all 125 flashcards in this deck.
Unlock Deck
k this deck
56
The central difference between the structural stagnation hypothesis and the secular stagnation theory is that:
A)structural stagnation applied in the 1940s, and secular stagnation applies today.
B)structural stagnation focuses on declining investment, while secular stagnation focuses on globalization.
C)structural stagnation focuses on globalization, while secular stagnation focuses on declining investment.
D)structural stagnation is a hypothesis, while secular stagnation is a theory.
Unlock Deck
Unlock for access to all 125 flashcards in this deck.
Unlock Deck
k this deck
57
The globalized AS/AD model relates:
A)to tradable goods only.
B)directly to both tradable and non-tradable goods.
C)to tradable services only.
D)directly to tradable and indirectly to non-tradable goods.
A)to tradable goods only.
B)directly to both tradable and non-tradable goods.
C)to tradable services only.
D)directly to tradable and indirectly to non-tradable goods.
Unlock Deck
Unlock for access to all 125 flashcards in this deck.
Unlock Deck
k this deck
58
According to the hypothesis, when did structural stagnation begin?
A)The mid-1960s
B)The mid-1970s
C)The mid-1980s
D)The mid-1990s
A)The mid-1960s
B)The mid-1970s
C)The mid-1980s
D)The mid-1990s
Unlock Deck
Unlock for access to all 125 flashcards in this deck.
Unlock Deck
k this deck
59
A theory in which advanced countries stop growing because investment opportunities would be eliminated is referred to as:
A)structural stagnation.
B)frictional stagnation.
C)reservation stagnation
D)secular stagnation.
A)structural stagnation.
B)frictional stagnation.
C)reservation stagnation
D)secular stagnation.
Unlock Deck
Unlock for access to all 125 flashcards in this deck.
Unlock Deck
k this deck
60
Adding globalization and large trade deficits to the standard AS/AD model creates:
A)reduced domestic production and consumption.
B)increased domestic production and consumption.
C)increased domestic production and reduced consumption.
D)decreased domestic production and increased consumption.
A)reduced domestic production and consumption.
B)increased domestic production and consumption.
C)increased domestic production and reduced consumption.
D)decreased domestic production and increased consumption.
Unlock Deck
Unlock for access to all 125 flashcards in this deck.
Unlock Deck
k this deck
61
In the early 2000s, policy makers were able to:
A)run contractionary policy without causing deflation.
B)run expansionary policy without causing inflation.
C)run contractionary policy without causing a rise in unemployment.
D)impose tariffs on foreign goods without causing retaliation by foreign countries.
A)run contractionary policy without causing deflation.
B)run expansionary policy without causing inflation.
C)run contractionary policy without causing a rise in unemployment.
D)impose tariffs on foreign goods without causing retaliation by foreign countries.
Unlock Deck
Unlock for access to all 125 flashcards in this deck.
Unlock Deck
k this deck
62
In the graph shown, what would shift the WAS curve from WAS0 to WAS1?
A)The country's exchange rate appreciates.
B)Domestic reservation wages fall.
C)Input prices fall.
D)Government runs contractionary policy.
A)The country's exchange rate appreciates.
B)Domestic reservation wages fall.
C)Input prices fall.
D)Government runs contractionary policy.
Unlock Deck
Unlock for access to all 125 flashcards in this deck.
Unlock Deck
k this deck
63
In the graph shown, an upward shift in the WAS curve:
A)raises domestic consumption, because domestic producers will produce more.
B)lowers the trade deficit, because domestic producers are more competitive.
C)lowers domestic production, because domestic consumption has fallen.
D)raises globalized potential output, because U.S. producers are less competitive.
Unlock Deck
Unlock for access to all 125 flashcards in this deck.
Unlock Deck
k this deck
64
Based on what we know about the globalized AS/AD model, the standard model does not include an analysis of:
A)investment.
B)government spending in the United States.
C)net exports.
D)consumption.
A)investment.
B)government spending in the United States.
C)net exports.
D)consumption.
Unlock Deck
Unlock for access to all 125 flashcards in this deck.
Unlock Deck
k this deck
65
In the graph shown, which of the world supply curves create a trade surplus?
A)WAS0
B)WAS1
C)WAS2
D)None create surpluses.
A)WAS0
B)WAS1
C)WAS2
D)None create surpluses.
Unlock Deck
Unlock for access to all 125 flashcards in this deck.
Unlock Deck
k this deck
66
In the graph shown, the country has:
A)a trade surplus.
B)a budget deficit.
C)a trade deficit.
D)neither a trade deficit nor trade surplus; exports are equal to imports.
A)a trade surplus.
B)a budget deficit.
C)a trade deficit.
D)neither a trade deficit nor trade surplus; exports are equal to imports.
Unlock Deck
Unlock for access to all 125 flashcards in this deck.
Unlock Deck
k this deck
67
In the graph shown, which of the world supply curves is associated with a trade balance?
A)WAS0
B)WAS1
C)WAS2
D)None create surpluses.
A)WAS0
B)WAS1
C)WAS2
D)None create surpluses.
Unlock Deck
Unlock for access to all 125 flashcards in this deck.
Unlock Deck
k this deck
68
In the graph shown, which of the world supply curves create a trade deficit?
A)WAS0
B)WAS1
C)WAS2
D)None create deficits.
A)WAS0
B)WAS1
C)WAS2
D)None create deficits.
Unlock Deck
Unlock for access to all 125 flashcards in this deck.
Unlock Deck
k this deck
69
According to the structural stagnation model, an increasing trade deficit translates into ________ unemployment and ________ globally-constrained potential output.
A)lower; higher
B)lower; lower
C)higher; higher
D)higher; lower
A)lower; higher
B)lower; lower
C)higher; higher
D)higher; lower
Unlock Deck
Unlock for access to all 125 flashcards in this deck.
Unlock Deck
k this deck
70
In the globalized AS/AD model, what curve indicates the amount of tradable goods that other countries will supply to a country at a given price level and exchange rate?
A)World demand curve
B)Domestic supply curve
C)World supply curve
D)Domestic demand curve
A)World demand curve
B)Domestic supply curve
C)World supply curve
D)Domestic demand curve
Unlock Deck
Unlock for access to all 125 flashcards in this deck.
Unlock Deck
k this deck
71
In the graph shown, what would eliminate a trade deficit if there were one?
A)The exchange rate appreciates.
B)Domestic reservation wages rise.
C)Foreign wages rise relative to domestic wages.
D)Government runs expansionary policy.
A)The exchange rate appreciates.
B)Domestic reservation wages rise.
C)Foreign wages rise relative to domestic wages.
D)Government runs expansionary policy.
Unlock Deck
Unlock for access to all 125 flashcards in this deck.
Unlock Deck
k this deck
72
According to the structural stagnation hypothesis, the expansionary policy carried out by the government led to the illusion that the policies were:
A)leading to long-term economic health.
B)effective in reducing the trade deficit.
C)improving U.S comparative advantages.
D)causing goods inflation.
A)leading to long-term economic health.
B)effective in reducing the trade deficit.
C)improving U.S comparative advantages.
D)causing goods inflation.
Unlock Deck
Unlock for access to all 125 flashcards in this deck.
Unlock Deck
k this deck
73
In the graph shown, the globally constrained potential output is:
A)to the right of the LAS curve shown.
B)to the left of the LAS curve shown.
C)the same as the LAS curve shown.
D)the LAS curve shown, but horizontal.
A)to the right of the LAS curve shown.
B)to the left of the LAS curve shown.
C)the same as the LAS curve shown.
D)the LAS curve shown, but horizontal.
Unlock Deck
Unlock for access to all 125 flashcards in this deck.
Unlock Deck
k this deck
74
The gap between a country's potential output and its consumption is most directly related to its:
A)budget deficit.
B)trade deficit.
C)exchange rate.
D)comparative advantage.
A)budget deficit.
B)trade deficit.
C)exchange rate.
D)comparative advantage.
Unlock Deck
Unlock for access to all 125 flashcards in this deck.
Unlock Deck
k this deck
75
In the graph shown, what could balance the trade deficit (reduce domestic consumption)?
A)Contractionary monetary policy
B)Lower domestic wages
C)A hurricane that damages domestic manufacturing plants
D)Expansionary fiscal policy
A)Contractionary monetary policy
B)Lower domestic wages
C)A hurricane that damages domestic manufacturing plants
D)Expansionary fiscal policy
Unlock Deck
Unlock for access to all 125 flashcards in this deck.
Unlock Deck
k this deck
76
In the globalized model, the eventual equivalency of domestic and world prices follows from the:
A)law of demand.
B)law of supply.
C)law of comparative advantage.
D)law of one price.
A)law of demand.
B)law of supply.
C)law of comparative advantage.
D)law of one price.
Unlock Deck
Unlock for access to all 125 flashcards in this deck.
Unlock Deck
k this deck
77
In the graph shown, a shift in the AD curve to the right:
A)raises domestic consumption.
B)lowers domestic consumption.
C)lowers globally constrained potential output.
D)causes goods inflation.
A)raises domestic consumption.
B)lowers domestic consumption.
C)lowers globally constrained potential output.
D)causes goods inflation.
Unlock Deck
Unlock for access to all 125 flashcards in this deck.
Unlock Deck
k this deck
78
In the graph shown, a downward shift in the SAS curve:
A)raises domestic consumption, because domestic producers produce more.
B)raises the trade deficit, because domestic producers are more competitive.
C)raises domestic production, because input prices have fallen.
D)lowers globalized potential output, because domestic producers are more competitive.
A)raises domestic consumption, because domestic producers produce more.
B)raises the trade deficit, because domestic producers are more competitive.
C)raises domestic production, because input prices have fallen.
D)lowers globalized potential output, because domestic producers are more competitive.
Unlock Deck
Unlock for access to all 125 flashcards in this deck.
Unlock Deck
k this deck
79
Refer to the graph shown. What will reduce the trade deficit?
A)The AD curve shifts to the left.
B)The SAS curve shifts down.
C)The WAS curve shifts up.
D)All the answers are correct.
A)The AD curve shifts to the left.
B)The SAS curve shifts down.
C)The WAS curve shifts up.
D)All the answers are correct.
Unlock Deck
Unlock for access to all 125 flashcards in this deck.
Unlock Deck
k this deck
80
Looking at the graph shown, the structural adjustments necessary to bring the economy back to domestic and international equilibrium include:
A)an increase in the U.S. exchange rate.
B)an increase in the U.S. wages and costs of production.
C)an increase in aggregate demand.
D)a fall in the U.S. exchange rate.
A)an increase in the U.S. exchange rate.
B)an increase in the U.S. wages and costs of production.
C)an increase in aggregate demand.
D)a fall in the U.S. exchange rate.
Unlock Deck
Unlock for access to all 125 flashcards in this deck.
Unlock Deck
k this deck
Unlock Deck
Unlock for access to all 125 flashcards in this deck.


