Deck 14: Financial Planning
Full screen (f)
Question
Question
Question
Question
Question
Question
Question
Question
Question
Question
Question
Question
Question
Question
Question
Question
Question
Question
Question
Question
Question
Cool Looks imports and distributes sunglasses in Southern California. The company's peak selling season has just passed and forecasted sales for the next few months is shown in the top row of the table. 40% of sales are cash and are collected in the month of the sale. 60% of sales are on credit, and are collected in the month following the sale. Cool Looks purchases merchandise one month in advance of sales and the cost of goods sold is 70% of sales. Cool Looks' suppliers are paid one month after the purchase. General and administrative expenses are $6,750 a month. Interest payments are $200 per month. Cool Looks will begin September with a cash balance of $10,000.
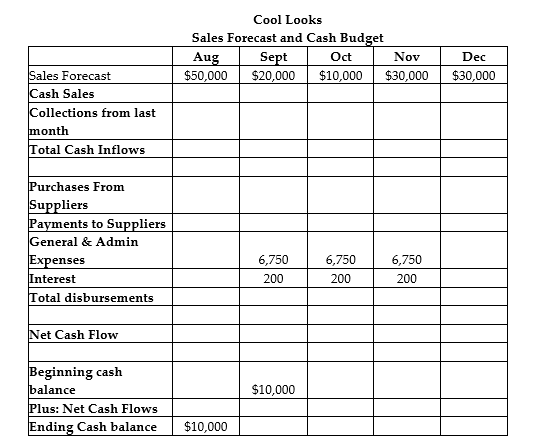
Referring to Cool Looks, what are total cash disbursements in October?
A)$13,950
B)$17,050
C)$20,950
D)$27,950
E)$28,950
Referring to Cool Looks, what are total cash disbursements in October?
A)$13,950
B)$17,050
C)$20,950
D)$27,950
E)$28,950
Question
Gerald's Produce provides quality fruits and vegetables to upscale restaurants in the tri-cities area. A sales forecast for Gerald's is shown on the top row of the table. Gerald makes 100% of his sales on credit. Gerald collects 50% of sales in the month following the sale, and the remaining 50% two months later. Gerald buys his produce in the same month as the sales. The cost of the fruits and vegetables is half of sales. Suppliers require Gerald to pay cash for his purchases. Gerald makes lease payments on his van of $500 per month, and gas costs him $100 per month. Gerald's Produce has a cash balance of $1,000 at the beginning of January.
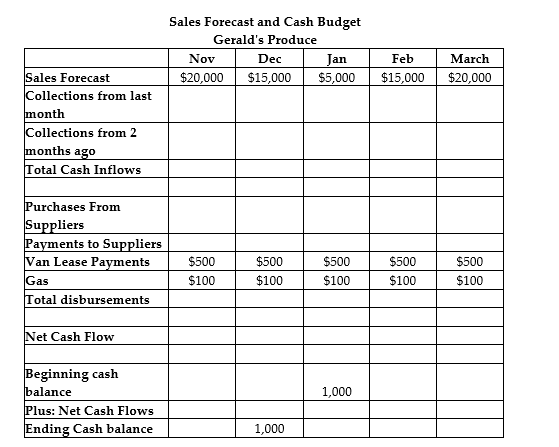
Referring to Gerald's Produce, what is Gerald's ending cash balance expected to be in March?
A)$15,400
B)$16,700
C)$17,000
D)$17,700
E)$18,200
Referring to Gerald's Produce, what is Gerald's ending cash balance expected to be in March?
A)$15,400
B)$16,700
C)$17,000
D)$17,700
E)$18,200
Question
Cool Looks imports and distributes sunglasses in Southern California. The company's peak selling season has just passed and forecasted sales for the next few months is shown in the top row of the table. 40% of sales are cash and are collected in the month of the sale. 60% of sales are on credit, and are collected in the month following the sale. Cool Looks purchases merchandise one month in advance of sales and the cost of goods sold is 70% of sales. Cool Looks' suppliers are paid one month after the purchase. General and administrative expenses are $6,750 a month. Interest payments are $200 per month. Cool Looks will begin September with a cash balance of $10,000.
Referring to Cool Looks, what are total cash inflows in September?
A)$18,000
B)$20,000
C)$30,000
D)$38,000
E)$50,000
Referring to Cool Looks, what are total cash inflows in September?
A)$18,000
B)$20,000
C)$30,000
D)$38,000
E)$50,000
Question
Question
Question
Question
Question
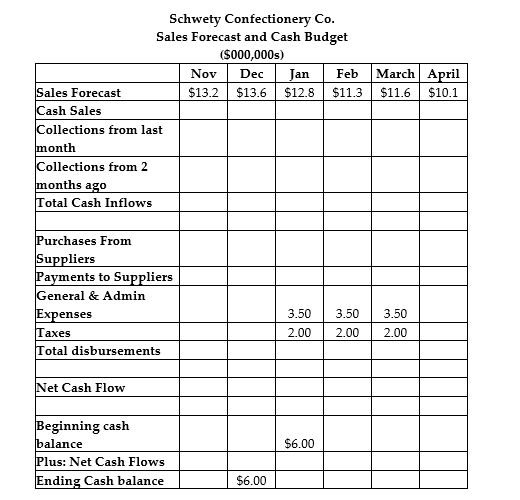
Referring to Schwety, what are Schwety's raw materials purchases in January?
A)$5.09
B)$5.22
C)$5.76
D)$6.12
E)$6.50
Question
Referring to Schwety, what are total cash disbursements in February?
A)$7.09
B)$8.59
C)$9.75
D)$10.59
E)$11.25
Question
Referring to Schwety, what is the cash balance at the end of March?
A)$10.90
B)$11.50
C)$12.70
D)$13.00
E)$13.70
Question
Gerald's Produce provides quality fruits and vegetables to upscale restaurants in the tri-cities area. A sales forecast for Gerald's is shown on the top row of the table. Gerald makes 100% of his sales on credit. Gerald collects 50% of sales in the month following the sale, and the remaining 50% two months later. Gerald buys his produce in the same month as the sales. The cost of the fruits and vegetables is half of sales. Suppliers require Gerald to pay cash for his purchases. Gerald makes lease payments on his van of $500 per month, and gas costs him $100 per month. Gerald's Produce has a cash balance of $1,000 at the beginning of January.
Referring to Gerald's Produce, what are Gerald's collections from customers expected to be in March?
A)$2,500
B)$5,000
C)$7,500
D)$10,000
E)$20,000
Referring to Gerald's Produce, what are Gerald's collections from customers expected to be in March?
A)$2,500
B)$5,000
C)$7,500
D)$10,000
E)$20,000
Question
Gerald's Produce provides quality fruits and vegetables to upscale restaurants in the tri-cities area. A sales forecast for Gerald's is shown on the top row of the table. Gerald makes 100% of his sales on credit. Gerald collects 50% of sales in the month following the sale, and the remaining 50% two months later. Gerald buys his produce in the same month as the sales. The cost of the fruits and vegetables is half of sales. Suppliers require Gerald to pay cash for his purchases. Gerald makes lease payments on his van of $500 per month, and gas costs him $100 per month. Gerald's Produce has a cash balance of $1,000 at the beginning of January.
What are Gerald's purchases expected to be in February?
A)$2,500
B)$5,000
C)$7,500
D)$10,000
E)$15,000
What are Gerald's purchases expected to be in February?
A)$2,500
B)$5,000
C)$7,500
D)$10,000
E)$15,000
Question
Referring to Schwety, what are total cash inflows in January?
A)$11.30
B)$11.72
C)$12.44
D)$12.80
E)$13.28
Question
Question
Cool Looks imports and distributes sunglasses in Southern California. The company's peak selling season has just passed and forecasted sales for the next few months is shown in the top row of the table. 40% of sales are cash and are collected in the month of the sale. 60% of sales are on credit, and are collected in the month following the sale. Cool Looks purchases merchandise one month in advance of sales and the cost of goods sold is 70% of sales. Cool Looks' suppliers are paid one month after the purchase. General and administrative expenses are $6,750 a month. Interest payments are $200 per month. Cool Looks will begin September with a cash balance of $10,000.
Referring to Cool Looks, what is the cash balance at the end of November?
A)$17,150
B)$19,150
C)$19,750
D)$21,250
E)$22,000
Referring to Cool Looks, what is the cash balance at the end of November?
A)$17,150
B)$19,150
C)$19,750
D)$21,250
E)$22,000
Question
Cool Looks imports and distributes sunglasses in Southern California. The company's peak selling season has just passed and forecasted sales for the next few months is shown in the top row of the table. 40% of sales are cash and are collected in the month of the sale. 60% of sales are on credit, and are collected in the month following the sale. Cool Looks purchases merchandise one month in advance of sales and the cost of goods sold is 70% of sales. Cool Looks' suppliers are paid one month after the purchase. General and administrative expenses are $6,750 a month. Interest payments are $200 per month. Cool Looks will begin September with a cash balance of $10,000.
Referring to Cool Looks, what are Cool Looks purchases in October?
A)$14,000
B)$16,000
C)$18,000
D)$19,000
E)$21,000
Referring to Cool Looks, what are Cool Looks purchases in October?
A)$14,000
B)$16,000
C)$18,000
D)$19,000
E)$21,000
Question
Question
Gerald's Produce provides quality fruits and vegetables to upscale restaurants in the tri-cities area. A sales forecast for Gerald's is shown on the top row of the table. Gerald makes 100% of his sales on credit. Gerald collects 50% of sales in the month following the sale, and the remaining 50% two months later. Gerald buys his produce in the same month as the sales. The cost of the fruits and vegetables is half of sales. Suppliers require Gerald to pay cash for his purchases. Gerald makes lease payments on his van of $500 per month, and gas costs him $100 per month. Gerald's Produce has a cash balance of $1,000 at the beginning of January.
Referring to Gerald's Produce, what are Gerald's total cash outflows (disbursements)in February?
A)$2,500
B)$3,100
C)$7,500
D)$8,100
E)$10,600
Referring to Gerald's Produce, what are Gerald's total cash outflows (disbursements)in February?
A)$2,500
B)$3,100
C)$7,500
D)$8,100
E)$10,600
Question
Polaris Industries produces a wide range of outdoor leisure vehicles including all-terrain vehicles (ATV's), motorcycles, and snowmobiles. Forecast the financial statements for Polaris for Year 6. Use the percent of sales method based on Year 5 and the assumptions listed below. Please note the ratios to sales provided in the table which are useful for making the forecast. Sales decline by 5.5%. The cost of debt is 11.76%. The tax rate is 31%. The depreciation rate is 12%. CAPEX is $28,360. The following accounts are held constant: Goodwill, Long-term debt, and Common Stock. Cash is the PLUG account. No dividends.
Forecast the financial statements for Polaris. What is the change in the cash account from Year 5 to Year 6?
Polaris Industries Inc.
Income Statement and Balance Sheet
As of December 31, Year 5 ($000's)

A)-$132.146 million
B)$135.146 million
C)$139.157 million
D)$146.187 million
E)$154.821 million
Forecast the financial statements for Polaris. What is the change in the cash account from Year 5 to Year 6?
Polaris Industries Inc.
Income Statement and Balance Sheet
As of December 31, Year 5 ($000's)
A)-$132.146 million
B)$135.146 million
C)$139.157 million
D)$146.187 million
E)$154.821 million
Question
Question
Question
Question
Question
Question
Question
Question
Question
Question
Question
Question
Question
Question
Question
Question
Question
Question
Question
Question
Question
Question
Question
Question
Question
Question
Question
Question
Question
Question
Question
Question
Question
Question
Question
Question
Question
Question

Unlock Deck
Sign up to unlock the cards in this deck!
Unlock Deck
Unlock Deck
1/77
Play
Full screen (f)
Deck 14: Financial Planning
1
The Gadget Company manufactures a wrist watch for spy agencies. The watch has a built-in cell phone, Geiger counter, compass, magnet and garroting wire. Sales are expected to commence in February and remain level at 10,000 units per month. The watch sells for $2 per unit. The raw materials for the product cost $1 per unit. Raw materials are purchased one month before the expected sales, and suppliers are paid one month after the purchase. Gadget's overhead expenses are $3,750 per month and depreciation is $250 per month. What are total cash outflows (disbursements)in May? Sales and Disbursements Forecast
The Gadget Company
A)$10,000
B)$12,950
C)$13,750
D)$13,850
E)$20,000
The Gadget Company
A)$10,000
B)$12,950
C)$13,750
D)$13,850
E)$20,000
$13,750
2
Dakota Layne is opening up "Layne's Women's Fashions" on April 1. Dakota's sales forecast for the Spring/Summer of Year 1 is shown in the top row of the table. She is going to purchase her merchandise 2 months in advance and her cost of goods sold is 70% of sales. Assume that Dakota has a starting inventory of $21,700 at the beginning of June. What is Dakota Layne's Ending Inventory Balance in June? Sales and Purchase Forecast
Layne's Women's Fashion
A)$19,800
B)$22,000
C)$22,400
D)$23,800
E)$25,300
Layne's Women's Fashion
A)$19,800
B)$22,000
C)$22,400
D)$23,800
E)$25,300
$23,800
3
Gyrl Skateboards manufactures skateboard decks. Guy Gyrl, the CEO, is forecasting cash flows for the next few months. Forecasted sales are shown on the top row of the table. Gyrl's cost of goods sold is 81.2% of sales. Gyrl buys its raw materials one month prior to the sale of the finished product. It pays for half of its raw materials in the same month as the purchase and half in the following month. What are Gyrl's total payments to suppliers in January? Gyrl Skateboards Inc.
Sales and Payments Forecast ($000s)
A)$2,050,000
B)$2,168,000
C)$2,270,000
D)$2,568,000
E)$2,757,000
Sales and Payments Forecast ($000s)
A)$2,050,000
B)$2,168,000
C)$2,270,000
D)$2,568,000
E)$2,757,000
$2,168,000
4
The Blatz Brewing Company produces 25 million hectolitres of beer each year. To put this in perspective, California consumed that much beer last year. A sales forecast for Blatz is provided in the top row of the table. Blatz sells its beer at a wholesale price of US$85 per hectoliter. All sales are on account and 75% of receivables are collected after 1 month, while 25% are collected after 2 months. What are Blatz' cash collections in March? Sales and Cash Inflow Forecast
Blatz Brewing Company
A)$21
B)$26
C)$64
D)$73
E)$85
Blatz Brewing Company
A)$21
B)$26
C)$64
D)$73
E)$85
Unlock Deck
Unlock for access to all 77 flashcards in this deck.
Unlock Deck
k this deck
5
Giant Koala Stores Inc. has forecasted sales for July through October in the top row of the table. Forecasted collections from cash and credit sales as well as forecasted payments to suppliers are also shown in the table. Wages, general & administrative expenses are 28% of the current month's sales. Giant Koala starts August with a cash balance of $7.61M. What is the cash balance at the end of September? Sales Forecast and Cash Budget
Giant Koala Stores Inc. ($000,000)
A)$7.61 million
B)$8.61 million
C)$9.11 million
D)$10.55 million
E)$11.62 million
Giant Koala Stores Inc. ($000,000)
A)$7.61 million
B)$8.61 million
C)$9.11 million
D)$10.55 million
E)$11.62 million
Unlock Deck
Unlock for access to all 77 flashcards in this deck.
Unlock Deck
k this deck
6
Gyrl Skateboards manufactures skateboard decks. Guy Gyrl, the CEO, is forecasting cash flows for the next few months. Forecasted sales are shown on the top row of the table. Gyrl's cost of goods sold is 81.2% of sales. Gyrl buys its raw materials one month prior to the sale of the finished product. It pays for half of its raw materials in the same month as the purchase and half in the following month. What are Gyrl's purchases in January? Gyrl Skateboards Inc.
Sales and Purchase Forecast ($000s)
A)$2,067,000
B)$2,150,000
C)$2,225,000
D)$2,270,000
E)$2,395,000
Sales and Purchase Forecast ($000s)
A)$2,067,000
B)$2,150,000
C)$2,225,000
D)$2,270,000
E)$2,395,000
Unlock Deck
Unlock for access to all 77 flashcards in this deck.
Unlock Deck
k this deck
7
The Gadget Company manufactures a wrist watch for spy agencies. The watch has a built-in cell phone, Geiger counter, compass, magnet and garroting wire. Sales are expected to commence in February and remain level at 10,000 units per month. The watch sells for $2 per unit. Gadget expects all of its sales to be on credit, and will collect half of its accounts in the month after the sale and the other half two months after the sale. What are total cash inflows in April? Sales and Collections Forecast
The Gadget Company
A)$0
B)$9,800
C)$10,000
D)$20,000
E)$23,700
The Gadget Company
A)$0
B)$9,800
C)$10,000
D)$20,000
E)$23,700
Unlock Deck
Unlock for access to all 77 flashcards in this deck.
Unlock Deck
k this deck
8
Dakota Layne is opening up "Layne's Women's Fashions" on April 1. Dakota's sales forecast for the Spring/Summer is shown in the top row of the table. She is going to purchase her merchandise 2 months in advance and her cost of goods sold is 70% of sales. What are Dakota Layne's purchases in May? Sales and Purchase Forecast
Layne's Women's Fashions
A)$9,000
B)$9,600
C)$10,500
D)$10,800
E)$11,200
Layne's Women's Fashions
A)$9,000
B)$9,600
C)$10,500
D)$10,800
E)$11,200
Unlock Deck
Unlock for access to all 77 flashcards in this deck.
Unlock Deck
k this deck
9
The Snow Globe Emporium sells snow globes. The forecasted first quarter sales for The Snow Globe Emporium is shown in the top row of the table. The Snow Globe Emporium buys the snow globes from a distributor for $5 and sells them for $8. All purchases are made on credit one month in advance of sales and are paid for the month following the purchase. Assume that The Snow Globe Emporium has a starting accounts payable balance of $15,000 at the beginning of February. What are the Snow Globe Emporium's Ending Accounts Payable in February? Sales and Purchase Forecast
The Snow Globe Emporium
A)$15,000
B)$23,000
C)$23,500
D)$24,000
E)$26,500
The Snow Globe Emporium
A)$15,000
B)$23,000
C)$23,500
D)$24,000
E)$26,500
Unlock Deck
Unlock for access to all 77 flashcards in this deck.
Unlock Deck
k this deck
10
Gyrl Skateboards manufactures skateboard decks. Guy Gyrl, the CEO, is forecasting cash flows for the next few months. Forecasted sales are shown on the top row of the table. Forecasted cash inflows and outflows are also shown in the table. If Gyrl's starts December with $50,000 of cash in the bank, then what will its cash balance be at the end of January? Gyrl Skateboards Inc.
Sales Forecast and Cash Budget ($000s)
A)$229,000
B)$521,000
C)$469,000
D)$698,000
E)$748,000
Sales Forecast and Cash Budget ($000s)
A)$229,000
B)$521,000
C)$469,000
D)$698,000
E)$748,000
Unlock Deck
Unlock for access to all 77 flashcards in this deck.
Unlock Deck
k this deck
11
Giant Koala Stores Inc. has forecasted sales for July through October in the top row of the table. Purchases are 65% of sales. All purchases are made one month in advance of the sale. Ten percent (10%)of suppliers are paid in the month of purchase and the remainder are paid in the following month. What are Giant Koala's payments to suppliers in September? Sales Forecast, Purchases and Payments to Suppliers
Giant Koala Stores Inc. ($000,000)
A)$11.313 million
B)$11.625 million
C)$12.456 million
D)$14.235 million
E)$15.4 million
Giant Koala Stores Inc. ($000,000)
A)$11.313 million
B)$11.625 million
C)$12.456 million
D)$14.235 million
E)$15.4 million
Unlock Deck
Unlock for access to all 77 flashcards in this deck.
Unlock Deck
k this deck
12
Windy City Kite Company has prepared sales forecasts for the beginning of Year 3 as shown in the top row of the table. Half of Windy City's kite sales are cash and the other half are credit. Windy City collects credit sales the month following the credit sale. What are Windy City's total cash inflows from customers for January? Windy City Kite Company
Sales Forecast and Collections Forecast
A)$500
B)$550
C)$1,000
D)$1,050
Sales Forecast and Collections Forecast
A)$500
B)$550
C)$1,000
D)$1,050
Unlock Deck
Unlock for access to all 77 flashcards in this deck.
Unlock Deck
k this deck
13
Windy City Kite Company has prepared sales forecasts for the first quarter of Year 3 as shown in the top row of the table. Half of Windy City's kite sales are cash and the other half are credit. Windy City collects credit sales the month following the credit sale. What are Windy City's ending accounts receivable in February? Windy City Kite Company
Sales Forecast and Collections Forecast
A)$500
B)$1,000
C)$1,250
D)$1,500
E)$2,500
Sales Forecast and Collections Forecast
A)$500
B)$1,000
C)$1,250
D)$1,500
E)$2,500
Unlock Deck
Unlock for access to all 77 flashcards in this deck.
Unlock Deck
k this deck
14
Gyrl Skateboards manufactures skateboard decks. Guy Gyrl, the CEO, is forecasting cash flows for the next few months. Forecasted sales are shown on the top row of the table. Gyrl's sales are 25% cash and the rest are credit. It collects two-thirds of the credit sales in the month following the sale, and the remainder two months later. What are Gyrl's forecasted total cash inflows in December? Gyrl Skateboards Inc.
Sales Forecast and Collections Forecast ($000s)
A)$2,700,000
B)$2,713,000
C)$2,738,000
D)$2,888,000
E)$2,950,000
Sales Forecast and Collections Forecast ($000s)
A)$2,700,000
B)$2,713,000
C)$2,738,000
D)$2,888,000
E)$2,950,000
Unlock Deck
Unlock for access to all 77 flashcards in this deck.
Unlock Deck
k this deck
15
Windy City Kite Company has prepared sales forecasts for the first quarter of Year 3 as shown in the top row of the table. Half of Windy City's kite sales are cash and the other half are credit. Windy City collects credit sales the month following the credit sale. How much of the total January collections from customers are from January sales? Windy City Kite Company
Sales Forecast and Collections Forecast
A)$0
B)$500
C)$750
D)$1,000
E)$1,050
Sales Forecast and Collections Forecast
A)$0
B)$500
C)$750
D)$1,000
E)$1,050
Unlock Deck
Unlock for access to all 77 flashcards in this deck.
Unlock Deck
k this deck
16
The Gadget Company manufactures a wrist watch for spy agencies. The watch has a built-in cell phone, Geiger counter, compass, magnet and garroting wire. Forecasted sales are shown on the top row of the table. Forecasted cash inflows and outflows are also shown in the table. The cash balance at the end of May is $30,000. What is the cash balance at the end of June? Sales Forecast Cash Budget
The Gadget Company
A)$36,750
B)$42,250
C)$46,250
D)$46,750
E)$50,000
The Gadget Company
A)$36,750
B)$42,250
C)$46,250
D)$46,750
E)$50,000
Unlock Deck
Unlock for access to all 77 flashcards in this deck.
Unlock Deck
k this deck
17
The Snow Globe Emporium sells snow globes. The forecasted first quarter sales volume for the Emporium is shown in the top row of the table. The Emporium buys the snow globes from a distributor for $5 and sells them for $8. All purchases are made on credit one month in advance of sales and are paid for the month following the purchase. What are the Snow Globe Emporium's payments in March? Sales and Purchase Forecast
The Snow Globe Emporium
A)$15,000
B)$19,000
C)$23,500
D)$24,000
E)$30,400
The Snow Globe Emporium
A)$15,000
B)$19,000
C)$23,500
D)$24,000
E)$30,400
Unlock Deck
Unlock for access to all 77 flashcards in this deck.
Unlock Deck
k this deck
18
Giant Koala Stores Inc. has forecasted sales for July through October in the top row of the table. Purchases are 65% of sales. All purchases are made one month in advance of the sale. Ten percent (10%)of suppliers are paid in the month of purchase and the remainder are paid in the following month. What are Giant Koala's purchases in September? Sales and Purchase Forecast
Giant Koala Stores Inc. ($000,000)
A)$11.7 million
B)$13.7 million
C)$14.3 million
D)$15.4 million
E)$15.5 million
Giant Koala Stores Inc. ($000,000)
A)$11.7 million
B)$13.7 million
C)$14.3 million
D)$15.4 million
E)$15.5 million
Unlock Deck
Unlock for access to all 77 flashcards in this deck.
Unlock Deck
k this deck
19
The Snow Globe Emporium sells snow globes. The forecasted first quarter sales volume for the Emporium is shown in the top row of the table. The Emporium buys the snow globes from a distributor for $5 and sells them for $8. All purchases are made on credit one month in advance of sales and are paid for the month following the purchase. What are the Snow Globe Emporium's purchases (in dollars)for March? Sales and Purchase Forecast
The Snow Globe Emporium
A)$19,000
B)$22,800
C)$23,500
D)$24,000
E)$30,400
The Snow Globe Emporium
A)$19,000
B)$22,800
C)$23,500
D)$24,000
E)$30,400
Unlock Deck
Unlock for access to all 77 flashcards in this deck.
Unlock Deck
k this deck
20
Giant Koala Stores Inc. has forecasted sales for July and August in the top row of the table. Giant Koala makes 85% of its sales for cash and the remainder on credit. The credit sales are collected one month after the sale. What are Giant Koala's forecasted total cash inflows in August? Sales Forecast and Cash Collections
Giant Koala Stores Inc. ($000,000)
A)$17 million
B)$18 million
C)$19 million
D)$21.15 million
E)$21.4 million
Giant Koala Stores Inc. ($000,000)
A)$17 million
B)$18 million
C)$19 million
D)$21.15 million
E)$21.4 million
Unlock Deck
Unlock for access to all 77 flashcards in this deck.
Unlock Deck
k this deck
21
Cool Looks imports and distributes sunglasses in Southern California. The company's peak selling season has just passed and forecasted sales for the next few months is shown in the top row of the table. 40% of sales are cash and are collected in the month of the sale. 60% of sales are on credit, and are collected in the month following the sale. Cool Looks purchases merchandise one month in advance of sales and the cost of goods sold is 70% of sales. Cool Looks' suppliers are paid one month after the purchase. General and administrative expenses are $6,750 a month. Interest payments are $200 per month. Cool Looks will begin September with a cash balance of $10,000.
Referring to Cool Looks, what are total cash disbursements in October?
A)$13,950
B)$17,050
C)$20,950
D)$27,950
E)$28,950
Referring to Cool Looks, what are total cash disbursements in October?
A)$13,950
B)$17,050
C)$20,950
D)$27,950
E)$28,950
Unlock Deck
Unlock for access to all 77 flashcards in this deck.
Unlock Deck
k this deck
22
Gerald's Produce provides quality fruits and vegetables to upscale restaurants in the tri-cities area. A sales forecast for Gerald's is shown on the top row of the table. Gerald makes 100% of his sales on credit. Gerald collects 50% of sales in the month following the sale, and the remaining 50% two months later. Gerald buys his produce in the same month as the sales. The cost of the fruits and vegetables is half of sales. Suppliers require Gerald to pay cash for his purchases. Gerald makes lease payments on his van of $500 per month, and gas costs him $100 per month. Gerald's Produce has a cash balance of $1,000 at the beginning of January.
Referring to Gerald's Produce, what is Gerald's ending cash balance expected to be in March?
A)$15,400
B)$16,700
C)$17,000
D)$17,700
E)$18,200
Referring to Gerald's Produce, what is Gerald's ending cash balance expected to be in March?
A)$15,400
B)$16,700
C)$17,000
D)$17,700
E)$18,200
Unlock Deck
Unlock for access to all 77 flashcards in this deck.
Unlock Deck
k this deck
23
Cool Looks imports and distributes sunglasses in Southern California. The company's peak selling season has just passed and forecasted sales for the next few months is shown in the top row of the table. 40% of sales are cash and are collected in the month of the sale. 60% of sales are on credit, and are collected in the month following the sale. Cool Looks purchases merchandise one month in advance of sales and the cost of goods sold is 70% of sales. Cool Looks' suppliers are paid one month after the purchase. General and administrative expenses are $6,750 a month. Interest payments are $200 per month. Cool Looks will begin September with a cash balance of $10,000.
Referring to Cool Looks, what are total cash inflows in September?
A)$18,000
B)$20,000
C)$30,000
D)$38,000
E)$50,000
Referring to Cool Looks, what are total cash inflows in September?
A)$18,000
B)$20,000
C)$30,000
D)$38,000
E)$50,000
Unlock Deck
Unlock for access to all 77 flashcards in this deck.
Unlock Deck
k this deck
24
Outlaws is a general goods retail chain in the High Plains region. Forecast the financial statements for Outlaws for Year 7. Use the percent of sales method based on Year 6 and the assumptions listed below. Please note the ratios provided in the table which are useful for making the forecast. Sales growth of 5.5%. The cost of debt is 6.25%. The tax rate is 35%. The depreciation rate is 6%. CAPEX is $300 Million. The following accounts are constant: Goodwill and common stock. Long term debt is the PLUG variable. No dividends.
Forecast the financial statements for Outlaws. What are the additional funds needed (AFN)in Year 7? The AFN is the change in the plug account from Year 6 to Year 7.
A)-$381 million
B)-$290 million
C)-$91 million
D)$127 million
E)$189 million
Forecast the financial statements for Outlaws. What are the additional funds needed (AFN)in Year 7? The AFN is the change in the plug account from Year 6 to Year 7.
A)-$381 million
B)-$290 million
C)-$91 million
D)$127 million
E)$189 million
Unlock Deck
Unlock for access to all 77 flashcards in this deck.
Unlock Deck
k this deck
25
Blockbuster is a video rental and retail chain. Blockbuster is forecasting its financial statements for Year 3. Selected financial information for Year 2 is provided in the table. What is Retained Earnings for Year 3? Selected Financial Information
Blockbuster Inc. ($ '000)
*Tax rate is a proportion of Earnings before Taxes.
A)$-46,224
B)$-47,279
C)$-329,300
D)$-607,976
E)$-707,976
Blockbuster Inc. ($ '000)
*Tax rate is a proportion of Earnings before Taxes.
A)$-46,224
B)$-47,279
C)$-329,300
D)$-607,976
E)$-707,976
Unlock Deck
Unlock for access to all 77 flashcards in this deck.
Unlock Deck
k this deck
26
Q9 Networks is a leading provider of outsourced data center infrastructure such as web-servers and data storage. Forecast the financial statements for Q9 Networks for Year 6. Use the percent of sales method based on Year 5 and the assumptions listed below. Please note the ratios to sales provided in the table which are useful for making the forecast. Forecast the financial statements for Q9. What is the change in the cash account from Year 5 to Year 6? Sales growth of 20%. The cost of debt is 4%. The Tax rate is 35%. The depreciation rate is 5%. CAPEX is $4,000,000. Cash is the plug account. The following accounts are held constant: Long-term debt and Common Stock. No dividends are paid in Year 6.
Q9 Networks
Income Statement and Balance Sheet
As of December 31, Year 5 ($ 000's)
A)$2.292 million
B)$1.301 million
C)-$2.220 million
D)-$6.702 million
E)-$7.081 million
Q9 Networks
Income Statement and Balance Sheet
As of December 31, Year 5 ($ 000's)
A)$2.292 million
B)$1.301 million
C)-$2.220 million
D)-$6.702 million
E)-$7.081 million
Unlock Deck
Unlock for access to all 77 flashcards in this deck.
Unlock Deck
k this deck
27
Blockbuster is a North American video and DVD sales and rental chain. Forecast the financial statements for Blockbuster for Year 3. Use the percent of sales method based on Year 2 and the assumptions listed below. Please note the ratios to sales provided in the table which are useful for making the forecast. In the event that taxable income is negative, calculate taxes in the usual way. Negative taxes can be interpreted as a tax refund. Sales growth of 10%. The cost of debt is 7.5%. The tax rate is 35%. The depreciation rate is 25%. CAPEX is $200M. The following accounts are held constant: Goodwill and Common Stock. Long Term Debt is the PLUG account. No dividends.
Blockbuster Inc.
Income Statement and Balance Sheet
As of December 31, Year 2 ($000's)
What are the additional funds needed in Year 3?
A)-$225.363 million
B)$63.243 million
C)$125.363 million
D)$189.900 million
E)$299.990 million
Blockbuster Inc.
Income Statement and Balance Sheet
As of December 31, Year 2 ($000's)
What are the additional funds needed in Year 3?
A)-$225.363 million
B)$63.243 million
C)$125.363 million
D)$189.900 million
E)$299.990 million
Unlock Deck
Unlock for access to all 77 flashcards in this deck.
Unlock Deck
k this deck
28
Referring to Schwety, what are Schwety's raw materials purchases in January?
A)$5.09
B)$5.22
C)$5.76
D)$6.12
E)$6.50
Unlock Deck
Unlock for access to all 77 flashcards in this deck.
Unlock Deck
k this deck
29
Referring to Schwety, what are total cash disbursements in February?
A)$7.09
B)$8.59
C)$9.75
D)$10.59
E)$11.25
Unlock Deck
Unlock for access to all 77 flashcards in this deck.
Unlock Deck
k this deck
30
Referring to Schwety, what is the cash balance at the end of March?
A)$10.90
B)$11.50
C)$12.70
D)$13.00
E)$13.70
Unlock Deck
Unlock for access to all 77 flashcards in this deck.
Unlock Deck
k this deck
31
Gerald's Produce provides quality fruits and vegetables to upscale restaurants in the tri-cities area. A sales forecast for Gerald's is shown on the top row of the table. Gerald makes 100% of his sales on credit. Gerald collects 50% of sales in the month following the sale, and the remaining 50% two months later. Gerald buys his produce in the same month as the sales. The cost of the fruits and vegetables is half of sales. Suppliers require Gerald to pay cash for his purchases. Gerald makes lease payments on his van of $500 per month, and gas costs him $100 per month. Gerald's Produce has a cash balance of $1,000 at the beginning of January.
Referring to Gerald's Produce, what are Gerald's collections from customers expected to be in March?
A)$2,500
B)$5,000
C)$7,500
D)$10,000
E)$20,000
Referring to Gerald's Produce, what are Gerald's collections from customers expected to be in March?
A)$2,500
B)$5,000
C)$7,500
D)$10,000
E)$20,000
Unlock Deck
Unlock for access to all 77 flashcards in this deck.
Unlock Deck
k this deck
32
Gerald's Produce provides quality fruits and vegetables to upscale restaurants in the tri-cities area. A sales forecast for Gerald's is shown on the top row of the table. Gerald makes 100% of his sales on credit. Gerald collects 50% of sales in the month following the sale, and the remaining 50% two months later. Gerald buys his produce in the same month as the sales. The cost of the fruits and vegetables is half of sales. Suppliers require Gerald to pay cash for his purchases. Gerald makes lease payments on his van of $500 per month, and gas costs him $100 per month. Gerald's Produce has a cash balance of $1,000 at the beginning of January.
What are Gerald's purchases expected to be in February?
A)$2,500
B)$5,000
C)$7,500
D)$10,000
E)$15,000
What are Gerald's purchases expected to be in February?
A)$2,500
B)$5,000
C)$7,500
D)$10,000
E)$15,000
Unlock Deck
Unlock for access to all 77 flashcards in this deck.
Unlock Deck
k this deck
33
Referring to Schwety, what are total cash inflows in January?
A)$11.30
B)$11.72
C)$12.44
D)$12.80
E)$13.28
Unlock Deck
Unlock for access to all 77 flashcards in this deck.
Unlock Deck
k this deck
34
The Blatz Brewing Company produces 25 million hectolitres of beer each year. To put this in perspective, California consumed that much beer last year. A sales forecast for Blatz is provided in the top row of the table. Blatz sells its beer at a wholesale price of US$85 per hectoliter. Blatz buys barley, hops and yeast one month before the sale. Raw materials cost are 15% of the wholesale price of the beer. Blatz purchases its raw materials on account and pays its suppliers one month after the purchase. What are Blatz' payments to suppliers in April? Sales and Payments Forecast
Blatz Brewing Company
A)$19.1
B)$23.5
C)$25.5
D)$31.9
E)$32.5
Blatz Brewing Company
A)$19.1
B)$23.5
C)$25.5
D)$31.9
E)$32.5
Unlock Deck
Unlock for access to all 77 flashcards in this deck.
Unlock Deck
k this deck
35
Cool Looks imports and distributes sunglasses in Southern California. The company's peak selling season has just passed and forecasted sales for the next few months is shown in the top row of the table. 40% of sales are cash and are collected in the month of the sale. 60% of sales are on credit, and are collected in the month following the sale. Cool Looks purchases merchandise one month in advance of sales and the cost of goods sold is 70% of sales. Cool Looks' suppliers are paid one month after the purchase. General and administrative expenses are $6,750 a month. Interest payments are $200 per month. Cool Looks will begin September with a cash balance of $10,000.
Referring to Cool Looks, what is the cash balance at the end of November?
A)$17,150
B)$19,150
C)$19,750
D)$21,250
E)$22,000
Referring to Cool Looks, what is the cash balance at the end of November?
A)$17,150
B)$19,150
C)$19,750
D)$21,250
E)$22,000
Unlock Deck
Unlock for access to all 77 flashcards in this deck.
Unlock Deck
k this deck
36
Cool Looks imports and distributes sunglasses in Southern California. The company's peak selling season has just passed and forecasted sales for the next few months is shown in the top row of the table. 40% of sales are cash and are collected in the month of the sale. 60% of sales are on credit, and are collected in the month following the sale. Cool Looks purchases merchandise one month in advance of sales and the cost of goods sold is 70% of sales. Cool Looks' suppliers are paid one month after the purchase. General and administrative expenses are $6,750 a month. Interest payments are $200 per month. Cool Looks will begin September with a cash balance of $10,000.
Referring to Cool Looks, what are Cool Looks purchases in October?
A)$14,000
B)$16,000
C)$18,000
D)$19,000
E)$21,000
Referring to Cool Looks, what are Cool Looks purchases in October?
A)$14,000
B)$16,000
C)$18,000
D)$19,000
E)$21,000
Unlock Deck
Unlock for access to all 77 flashcards in this deck.
Unlock Deck
k this deck
37
The Blatz Brewing Company produces 25 million hectolitres of beer each year. To put this in perspective, California consumed that much beer last year. A sales forecast for Blatz is provided in the top row of the table. Blatz sells its beer at a wholesale price of US$85 per hectoliter. All sales are on account and 75% of receivables are collected after 1 month, while 25% are collected after 2 months. Blatz buys barley, hops and yeast one month before the sale. Raw materials cost 15% of the wholesale price of the beer. Blatz purchases its raw materials on account and pays its suppliers one month after the purchase. Average monthly overhead expenses are $35M (wages, salaries, heat, water, electricity, selling, general and administration). What are Blatz' net cash flows in March?
Sales Forecast and Cash Budget
Blatz Brewing Company
A)$11
B)$31
C)$38
D)$64
E)$68
Sales Forecast and Cash Budget
Blatz Brewing Company
A)$11
B)$31
C)$38
D)$64
E)$68
Unlock Deck
Unlock for access to all 77 flashcards in this deck.
Unlock Deck
k this deck
38
Gerald's Produce provides quality fruits and vegetables to upscale restaurants in the tri-cities area. A sales forecast for Gerald's is shown on the top row of the table. Gerald makes 100% of his sales on credit. Gerald collects 50% of sales in the month following the sale, and the remaining 50% two months later. Gerald buys his produce in the same month as the sales. The cost of the fruits and vegetables is half of sales. Suppliers require Gerald to pay cash for his purchases. Gerald makes lease payments on his van of $500 per month, and gas costs him $100 per month. Gerald's Produce has a cash balance of $1,000 at the beginning of January.
Referring to Gerald's Produce, what are Gerald's total cash outflows (disbursements)in February?
A)$2,500
B)$3,100
C)$7,500
D)$8,100
E)$10,600
Referring to Gerald's Produce, what are Gerald's total cash outflows (disbursements)in February?
A)$2,500
B)$3,100
C)$7,500
D)$8,100
E)$10,600
Unlock Deck
Unlock for access to all 77 flashcards in this deck.
Unlock Deck
k this deck
39
Polaris Industries produces a wide range of outdoor leisure vehicles including all-terrain vehicles (ATV's), motorcycles, and snowmobiles. Forecast the financial statements for Polaris for Year 6. Use the percent of sales method based on Year 5 and the assumptions listed below. Please note the ratios to sales provided in the table which are useful for making the forecast. Sales decline by 5.5%. The cost of debt is 11.76%. The tax rate is 31%. The depreciation rate is 12%. CAPEX is $28,360. The following accounts are held constant: Goodwill, Long-term debt, and Common Stock. Cash is the PLUG account. No dividends.
Forecast the financial statements for Polaris. What is the change in the cash account from Year 5 to Year 6?
Polaris Industries Inc.
Income Statement and Balance Sheet
As of December 31, Year 5 ($000's)
A)-$132.146 million
B)$135.146 million
C)$139.157 million
D)$146.187 million
E)$154.821 million
Forecast the financial statements for Polaris. What is the change in the cash account from Year 5 to Year 6?
Polaris Industries Inc.
Income Statement and Balance Sheet
As of December 31, Year 5 ($000's)
A)-$132.146 million
B)$135.146 million
C)$139.157 million
D)$146.187 million
E)$154.821 million
Unlock Deck
Unlock for access to all 77 flashcards in this deck.
Unlock Deck
k this deck
40
CN Railways is North America's fifth largest railway. Forecast the financial statements for CN for Year 11. Use the percent of sales method based on Year 10 and the assumptions listed below. Please note the ratios to sales provided in the table which are useful for making the forecast. Sales growth of 10%. The cost of debt is 4.59%. The tax rate is 31.943%. The depreciation rate is 3%. CAPEX is $1,600 Million. The following accounts are constant: Intangible assets, Deferred taxes, and Common Stock. Long term debt is the PLUG variable. No dividends.
Forecast the financial statements for CN. What are the additional funds needed (AFN)in Year 11? The AFN is the change in the plug account from Year 10 to Year 11.
CN Railway Company
Income Statement and Balance Sheet
As of December 31, Year 10 ($ 000,000's)
A)$64 million
B)$165 million
C)$342 million
D)$580 million
E)$965 million
Unlock Deck
Unlock for access to all 77 flashcards in this deck.
Unlock Deck
k this deck
41
Polaris Industries is forecasting its financial statements for Year 6. Selected financial information for Years 5 and 6 is provided in the table. What is the forecasted Cost of Goods Sold in Year 3? Selected Financial Information
Polaris Industries Inc. ($000s)
A)$1,368,500
B)$1,367,500
C)$1,369,350
D)$1,374,383
E)$1,375,450
Polaris Industries Inc. ($000s)
A)$1,368,500
B)$1,367,500
C)$1,369,350
D)$1,374,383
E)$1,375,450
Unlock Deck
Unlock for access to all 77 flashcards in this deck.
Unlock Deck
k this deck
42
Outlaws is a general goods retail chain in the High Plains region. Outlaws is forecasting its financial statements for Year 7. Selected financial information for Year 6 is provided in the table. What is long term debt, the plug variable, for the forecasted year? To calculate forecasted current liabilities use the percentage of sales method based on Year 6 figures. Assume that no dividends are paid in Year 7. Selected Financial Information
Outlaws Inc. ($ millions)
A)$3,859
B)$3,336
C)$3,827
D)$6,397
E)$10,236
Outlaws Inc. ($ millions)
A)$3,859
B)$3,336
C)$3,827
D)$6,397
E)$10,236
Unlock Deck
Unlock for access to all 77 flashcards in this deck.
Unlock Deck
k this deck
43
Polaris Industries is forecasting its financial statements for Year 10. Selected financial information for Year 9 is provided in the table. What is the forecasted balance of cash in Year 10? (Cash is the plug account.)Use the percentage of sales method to calculate accounts receivable for year 10 (based on the Year 9 values). Selected Financial Information
Polaris Industries Inc. ($000s)
A)$80,300
B)$85,343
C)$87,008
D)$89,078
E)$90,731
Polaris Industries Inc. ($000s)
A)$80,300
B)$85,343
C)$87,008
D)$89,078
E)$90,731
Unlock Deck
Unlock for access to all 77 flashcards in this deck.
Unlock Deck
k this deck
44
Save-a-lot is a grocery store chain. Save-a-lot is forecasting its financial statements for Year 3. Selected financial information for Years 2 and 3 is provided in the table. In Year 3 Save-a-lot is planning to invest $600 million in CAPEX and forecasted depreciation is $903 million. What is Net PP&E (Property, Plant and Equipment)at the end of Year 3? Selected Financial Information
Save-a-lot Inc.
Dec 31, Year 2 and Year 3 ($ millions)
A)$14,153
B)$14,250
C)$14,382
D)$14,456
E)$14,577
Save-a-lot Inc.
Dec 31, Year 2 and Year 3 ($ millions)
A)$14,153
B)$14,250
C)$14,382
D)$14,456
E)$14,577
Unlock Deck
Unlock for access to all 77 flashcards in this deck.
Unlock Deck
k this deck
45
Polaris Industries is forecasting its financial statements for Year 6. Selected financial information for Year 5 is provided in the table. What is the interest expense for Polaris Industries in Year 6? (Assume that Polaris Industries average cost of debt is 11.76%.) Selected Financial Information
Polaris Industries Inc. ($ '000)
A)$2,117
B)$2,347
C)$3,114
D)$4,139
E)$4,234
Polaris Industries Inc. ($ '000)
A)$2,117
B)$2,347
C)$3,114
D)$4,139
E)$4,234
Unlock Deck
Unlock for access to all 77 flashcards in this deck.
Unlock Deck
k this deck
46
Outlaws is a general goods retail chain in the High Plains region. Outlaws is forecasting its financial statements for Year 3. Selected financial information for Years 1 and 2 is provided in the table. What is the interest expense for Outlaws in Year 3? (Assume that Outlaws average cost of debt is 6.25%.) Selected Financial Information
Outlaws Inc. ($ millions)
A)$209
B)$243
C)$263
D)$295
E)$308
Outlaws Inc. ($ millions)
A)$209
B)$243
C)$263
D)$295
E)$308
Unlock Deck
Unlock for access to all 77 flashcards in this deck.
Unlock Deck
k this deck
47
Sona is forecasting its financial statements for Year 2. Selected financial information for Years 1 and 2 is provided in the table. In Year 2 Sona is planning to invest $50 million in CAPEX and forecasted depreciation is $16 million. What is the Net Property, Plant and Equipment balance in Year 2? Selected Financial Information
Sona Inc. ($ millions)
A)$184
B)$194
C)$203
D)$209
E)$211
Sona Inc. ($ millions)
A)$184
B)$194
C)$203
D)$209
E)$211
Unlock Deck
Unlock for access to all 77 flashcards in this deck.
Unlock Deck
k this deck
48
Scrumptious Confections plc is a United Kingdom confectionery company. Scrumptious Inc. is forecasting its financial statements for Year 2. Selected financial information for Years 1 and 2 is provided in the table. In Year 2 Scrumptious is planning to invest £53 million in CAPEX and forecasted depreciation is £196 million. What is Property, Plant and Equipment (Net)in Year 2? Selected Financial Information
Scrumptious Inc. (£ millions)
A)£831
B)£861
C)£1,411
D)£1,441
E)£1,761
Scrumptious Inc. (£ millions)
A)£831
B)£861
C)£1,411
D)£1,441
E)£1,761
Unlock Deck
Unlock for access to all 77 flashcards in this deck.
Unlock Deck
k this deck
49
Blockbuster is a video rental and retail chain. Blockbuster is forecasting its financial statements for Year 3. Selected financial information for Years 1 and 2 is provided in the table. What is the interest expense for Blockbuster in Year 3? (Assume that Blockbuster's average cost of debt is 7.50%.) Selected Financial Information
Blockbuster Inc. ($ '000)
A)$70,341
B)$72,054
C)$80,667
D)$87,686
E)$135,166
Blockbuster Inc. ($ '000)
A)$70,341
B)$72,054
C)$80,667
D)$87,686
E)$135,166
Unlock Deck
Unlock for access to all 77 flashcards in this deck.
Unlock Deck
k this deck
50
Cadbury plc is a global confectionery company. Cadbury is forecasting its financial statements for Year 9. Selected financial information for Years 7 and 8 is provided in the table. In Year 8 Cadbury is planning to invest £300 million in CAPEX. The average depreciation rate is 10%. What is the forecasted depreciation expense in Year 9? Selected Financial Information
Cadbury Inc. (£ millions)
A)£176
B)£206
C)£286
D)£300
E)£322
Cadbury Inc. (£ millions)
A)£176
B)£206
C)£286
D)£300
E)£322
Unlock Deck
Unlock for access to all 77 flashcards in this deck.
Unlock Deck
k this deck
51
Cadbury plc is a global confectionery company. Cadbury is forecasting its financial statements for Year 9. Selected financial information for Years 7 and 8 is provided in the table. What is the interest expense for Year 9? (Assume that Cadbury's average cost of debt is 3%.) Selected Financial Information
Cadbury Inc. (£ millions)
A)£36
B)£59
C)£63
D)£95
E)£110
Cadbury Inc. (£ millions)
A)£36
B)£59
C)£63
D)£95
E)£110
Unlock Deck
Unlock for access to all 77 flashcards in this deck.
Unlock Deck
k this deck
52
Polaris Industries is forecasting its financial statements for Year 6. Selected financial information for Year 5 is provided in the table. In Year 6 Polaris Industries is planning to invest $50 million in CAPEX. The average depreciation rate is 12%. What is the forecasted depreciation expense in Year 6? Selected Financial Information
Polaris Industries Inc. ($000s)
A)$26,844
B)$26,824
C)$30,280
D)$31,624
E)$32,680
Polaris Industries Inc. ($000s)
A)$26,844
B)$26,824
C)$30,280
D)$31,624
E)$32,680
Unlock Deck
Unlock for access to all 77 flashcards in this deck.
Unlock Deck
k this deck
53
Outlaws is a general goods retail chain in the High Plains region. Outlaws is forecasting its financial statements for Year 3. Selected financial information for Years 1 and 2 is provided in the table. In Year 3 Outlaws is planning to invest $300 million in CAPEX. The average depreciation rate is 6%. What is the forecasted depreciation expense in Year 3? Selected Financial Information
Outlaws Inc. ($ millions)
A)$531
B)$560
C)$578
D)$596
E)$655
Outlaws Inc. ($ millions)
A)$531
B)$560
C)$578
D)$596
E)$655
Unlock Deck
Unlock for access to all 77 flashcards in this deck.
Unlock Deck
k this deck
54
CN is North America's fifth largest railroad. CN is forecasting its financial statements for Year 3. Selected financial information for Year 2 is provided in the table. What is Retained Earnings for Year 3? Selected Financial Information
CN Railway Company ($000'000s)
*The tax rate is a percentage of Earnings Before Tax.
A)$2,762
B)$3,128
C)$3,293
D)$3,417
E)$3,630
CN Railway Company ($000'000s)
*The tax rate is a percentage of Earnings Before Tax.
A)$2,762
B)$3,128
C)$3,293
D)$3,417
E)$3,630
Unlock Deck
Unlock for access to all 77 flashcards in this deck.
Unlock Deck
k this deck
55
Cadbury plc is a global confectionery company. Cadbury is forecasting its financial statements for Year 9. Selected financial information for Years 7 and 8 is provided in the table. What is Retained Earnings for Year 9? Selected Financial Information
Cadbury plc (£ millions)
*Tax rate is a proportion of Earnings before Taxes.
A)£2,917
B)£3,268
C)£4,007
D)£5,307
E)£5,885
Cadbury plc (£ millions)
*Tax rate is a proportion of Earnings before Taxes.
A)£2,917
B)£3,268
C)£4,007
D)£5,307
E)£5,885
Unlock Deck
Unlock for access to all 77 flashcards in this deck.
Unlock Deck
k this deck
56
Blockbuster is a video rental and retail chain. Blockbuster is forecasting its financial statements for Year 7. Selected financial information for Year 6 is provided in the table. What is long term debt (the plug variable)for the forecasted year? To forecast current liabilities payable use the percentage of sales method based on Year 6 figures. Assume that no dividends are paid in Year 7. Selected Financial Information
Blockbuster Inc. ($ '000)
A)$707,803
B)$743,168
C)$793,168
D)$798,143
E)$798,988
Blockbuster Inc. ($ '000)
A)$707,803
B)$743,168
C)$793,168
D)$798,143
E)$798,988
Unlock Deck
Unlock for access to all 77 flashcards in this deck.
Unlock Deck
k this deck
57
Polaris Industries is forecasting its financial statements for Year 6. Selected financial information for Year 5 is provided in the table. What is Retained Earnings for Year 6? Selected Financial Information
Polaris Industries Inc. ($000s)
*Tax rate is a proportion of Earnings before Taxes.
A)$ 503,447
B)$ 504,147
C)$ 534,137
D)$ 534,837
E)$ 607,556
Polaris Industries Inc. ($000s)
*Tax rate is a proportion of Earnings before Taxes.
A)$ 503,447
B)$ 504,147
C)$ 534,137
D)$ 534,837
E)$ 607,556
Unlock Deck
Unlock for access to all 77 flashcards in this deck.
Unlock Deck
k this deck
58
Outlaws is a general goods retail chain in the High Plains region. Outlaws is forecasting its financial statements for Year 3. Selected financial information for Years 1 and 2 is provided in the table. What is Retained Earnings for Year 3? Selected Financial Information
Outlaws Inc. ($ millions)
*The tax rate is a percentage of Earnings Before Tax.
A)$5,524
B)$5,745
C)$5,762
D)$7,610
E)$7,385
Outlaws Inc. ($ millions)
*The tax rate is a percentage of Earnings Before Tax.
A)$5,524
B)$5,745
C)$5,762
D)$7,610
E)$7,385
Unlock Deck
Unlock for access to all 77 flashcards in this deck.
Unlock Deck
k this deck
59
The Film Shoppe is a video rental and retail chain. The Shoppe is forecasting its financial statements for Year 2. Selected financial information for Years 1 and 2 is provided in the table. In Year 2 The Shoppe is planning to invest $600 million in CAPEX and forecasted depreciation is $903 million. What is Net Property, Plant and Equipment in Year 2? Selected Financial Information
The Film Shoppe Inc. ($ millions)
A)$15,116
B)$15,319
C)$15,419
D)$15,519
E)$16,222
The Film Shoppe Inc. ($ millions)
A)$15,116
B)$15,319
C)$15,419
D)$15,519
E)$16,222
Unlock Deck
Unlock for access to all 77 flashcards in this deck.
Unlock Deck
k this deck
60
CN is North America's fifth largest railroad. CN is forecasting its financial statements for Year 7. Selected financial information for Year 6 is provided in the table. What is long term debt (the plug variable)for the forecasted year? To forecast current liabilities payable use the percentage of sales method based on Year 6 figures. Assume that no dividends are paid in Year 7. Selected Financial Information
CN Railway Company ($000'000s)
A)$10,764
B)$10,955
C)$11,179
D)$11,483
E)$11,798
CN Railway Company ($000'000s)
A)$10,764
B)$10,955
C)$11,179
D)$11,483
E)$11,798
Unlock Deck
Unlock for access to all 77 flashcards in this deck.
Unlock Deck
k this deck
61
CN Railways is North America's fifth largest railway. Use the equation approach and CN's financial information for Year 10 to calculate additional funds needed (AFN)in Year 11. Selected Financial Statement Values and Ratios
CN Railway Company
As of December 31, Year 10 ($ millions)
A)$64 million
B)$165 million
C)$342 million
D)$580 million
E)$965 million
CN Railway Company
As of December 31, Year 10 ($ millions)
A)$64 million
B)$165 million
C)$342 million
D)$580 million
E)$965 million
Unlock Deck
Unlock for access to all 77 flashcards in this deck.
Unlock Deck
k this deck
62
Polaris Industries produces a wide range of outdoor leisure vehicles including all-terrain vehicles (ATV's), motorcycles, and snowmobiles. Use the financial information in the table to calculate Polaris' maximum sustainable growth rate. Selected Ratios
Polaris Industries Inc.
As of December 31, Year 5
A)8.1%
B)17.5%
C)22.9%
D)44.9%
E)63.3%
Polaris Industries Inc.
As of December 31, Year 5
A)8.1%
B)17.5%
C)22.9%
D)44.9%
E)63.3%
Unlock Deck
Unlock for access to all 77 flashcards in this deck.
Unlock Deck
k this deck
63
Polaris Industries produces a wide range of outdoor leisure vehicles including all-terrain vehicles (ATV's), motorcycles, and snowmobiles. Use the financial information in the table to calculate Polaris' maximum internal growth rate. Selected Ratios
Polaris Industries Inc.
As of December 31, Year 5
A)8.1%
B)17.5%
C)22.9%
D)44.9%
E)63.3%
Polaris Industries Inc.
As of December 31, Year 5
A)8.1%
B)17.5%
C)22.9%
D)44.9%
E)63.3%
Unlock Deck
Unlock for access to all 77 flashcards in this deck.
Unlock Deck
k this deck
64
Blockbuster is a North American video and DVD sales and rental chain. Use the financial information in the table to calculate Blockbuster's maximum internal growth rate. Selected Ratios
Blockbuster Inc.
As of December 31, Year 2
A)-3.0%
B)0%
C)1.0%
D)2.0%
E)3.0%
Blockbuster Inc.
As of December 31, Year 2
A)-3.0%
B)0%
C)1.0%
D)2.0%
E)3.0%
Unlock Deck
Unlock for access to all 77 flashcards in this deck.
Unlock Deck
k this deck
65
Blockbuster is a video rental and retail chain. Blockbuster is forecasting its financial statements for Year 3. Selected financial information for Years 1 and 2 is provided in the table. In Year 3 Blockbuster is planning to invest $400,000 thousand in CAPEX. The average depreciation rate is 25%. What is the forecasted depreciation expense in Year 3? Selected Financial Information
Blockbuster Inc. ($ '000)
A)$207,175
B)$270,256
C)$329,750
D)$314,526
E)$455,300
Blockbuster Inc. ($ '000)
A)$207,175
B)$270,256
C)$329,750
D)$314,526
E)$455,300
Unlock Deck
Unlock for access to all 77 flashcards in this deck.
Unlock Deck
k this deck
66
Blockbuster is a North American video and DVD sales and rental chain. Use the equation approach and Blockbuster's financial statement for Year 2 to calculate additional funds needed (AFN)in Year 3. Assume that sales in Year 3 will be $5.67336 billion. Assume a 0% dividend payout rate. Blockbuster Inc.
Income Statement and Balance Sheet
As of December 31, Year 2 ($000's)
A)-$225.363 million
B)$63.243 million
C)$125.363 million
D)$189.900 million
E)$299.990 million
Income Statement and Balance Sheet
As of December 31, Year 2 ($000's)
A)-$225.363 million
B)$63.243 million
C)$125.363 million
D)$189.900 million
E)$299.990 million
Unlock Deck
Unlock for access to all 77 flashcards in this deck.
Unlock Deck
k this deck
67
Q9 Networks is a leading provider of outsourced data center infrastructure such as web-servers and data storage. Use the financial information in the table to calculate Q9's maximum internal growth rate. Selected Ratios
Q9 Networks Year 5
A)0.09%
B)0.10%
C)0.13%
D)0.16%
E)0.20%
Q9 Networks Year 5
A)0.09%
B)0.10%
C)0.13%
D)0.16%
E)0.20%
Unlock Deck
Unlock for access to all 77 flashcards in this deck.
Unlock Deck
k this deck
68
Cadbury plc is a global confectionery company. Cadbury is forecasting its financial statements for Year 5. Selected financial information for Year 4 is provided in the table. What is the long term debt, the plug variable, amount for the forecasted year? To forecast accounts payable use the percentage of sales method based on Year 4 figures. Assume that no dividends are paid in Year 5. Selected Financial Information
Cadbury plc Year 4 (£ millions)
A)£1,259
B)£1,397
C)£1,530
D)£2,027
E)£2,138
Cadbury plc Year 4 (£ millions)
A)£1,259
B)£1,397
C)£1,530
D)£2,027
E)£2,138
Unlock Deck
Unlock for access to all 77 flashcards in this deck.
Unlock Deck
k this deck
69
Q9 Networks is a leading provider of outsourced data center infrastructure such as web-servers and data storage. Use the equation approach and the financial data in the table to calculate additional funds needed (AFN)in Year 6. Selected Financial Statement Values and Ratios
Q9 Networks As of December 31, Year 5 ($ 000's)
A)-$2,292
B)-$1,301
C)$2,220
D)$6,702
E)$7,081
Q9 Networks As of December 31, Year 5 ($ 000's)
A)-$2,292
B)-$1,301
C)$2,220
D)$6,702
E)$7,081
Unlock Deck
Unlock for access to all 77 flashcards in this deck.
Unlock Deck
k this deck
70
Outlaws is a general goods retail chain in the High Plains region. Use the financial information in the table to calculate Outlaws maximum internal growth rate. Selected Ratios
Outlaws Inc. Year 5
A)1.5%
B)2.5%
C)3.5%
D)4.5%
E)5.5%
Outlaws Inc. Year 5
A)1.5%
B)2.5%
C)3.5%
D)4.5%
E)5.5%
Unlock Deck
Unlock for access to all 77 flashcards in this deck.
Unlock Deck
k this deck
71
Polaris Industries produces a wide range of outdoor leisure vehicles including all-terrain vehicles (ATV's), motorcycles, and snowmobiles. Use the equation approach and Polaris' financial statement for Year 5 to calculate additional funds needed (AFN)in Year 6. Assume that sales in Year 6 will be $1.803494 billion. Assume a 0% dividend payout rate. Polaris Industries Inc.
Income Statement and Balance Sheet
As of December 31, Year 5 ($000's)
A)-$135 million
B)-$139 million
C)-$146 million
D)-$155 million
E)$132 million
Income Statement and Balance Sheet
As of December 31, Year 5 ($000's)
A)-$135 million
B)-$139 million
C)-$146 million
D)-$155 million
E)$132 million
Unlock Deck
Unlock for access to all 77 flashcards in this deck.
Unlock Deck
k this deck
72
Q9 Networks is a leading provider of outsourced data center infrastructure such as web-servers and data storage. Use the financial information in the table to calculate Q9's maximum sustainable growth rate. Selected Ratios
Q9 Networks Year 5
A)0.09%
B)0.10%
C)0.11%
D)0.12%
E)0.13%
Q9 Networks Year 5
A)0.09%
B)0.10%
C)0.11%
D)0.12%
E)0.13%
Unlock Deck
Unlock for access to all 77 flashcards in this deck.
Unlock Deck
k this deck
73
Blockbuster is a North American video and DVD sales and rental chain. Use the financial information in the table to calculate Blockbuster's maximum sustainable growth rate. Selected Ratios
Blockbuster Inc.
As of December 31, Year 2
A)-4.0%
B)0%
C)4.2%
D)4.3%
E)4.4%
Blockbuster Inc.
As of December 31, Year 2
A)-4.0%
B)0%
C)4.2%
D)4.3%
E)4.4%
Unlock Deck
Unlock for access to all 77 flashcards in this deck.
Unlock Deck
k this deck
74
CN Railways is North America's fifth largest railway. Use the financial information in the table to calculate CN's maximum internal growth rate. CN Railway Company
As of December 31, Year 10
A)2.2%
B)3.1%
C)6.4%
D)7.0%
E)9.4%
As of December 31, Year 10
A)2.2%
B)3.1%
C)6.4%
D)7.0%
E)9.4%
Unlock Deck
Unlock for access to all 77 flashcards in this deck.
Unlock Deck
k this deck
75
Outlaws is a general goods retail chain in the High Plains region. Use the financial information in the table to calculate Outlaws maximum sustainable growth rate. Selected Ratios
Outlaws Inc. Year 5
A)11.0%
B)11.1%
C)11.2%
D)11.3%
E)11.4%
Outlaws Inc. Year 5
A)11.0%
B)11.1%
C)11.2%
D)11.3%
E)11.4%
Unlock Deck
Unlock for access to all 77 flashcards in this deck.
Unlock Deck
k this deck
76
CN Railways is North America's fifth largest railway. Use the financial information in the table to calculate CN's maximum sustainable growth rate. CN Railway Company
As of December 31, Year 10
A)2.2%
B)3.1%
C)6.4%
D)7.0%
E)9.4%
As of December 31, Year 10
A)2.2%
B)3.1%
C)6.4%
D)7.0%
E)9.4%
Unlock Deck
Unlock for access to all 77 flashcards in this deck.
Unlock Deck
k this deck
77
Outlaws is a general goods retail chain in the High Plains region. Use the equation approach and Outlaws financial information for Year 6 to calculate additional funds needed (AFN)in Year 7. Selected Financial Statement Values and Ratios
Outlaws Inc. As of December 31, Year 6 ($ millions)
A)-$381 million
B)-$290 million
C)-$91 million
D)$127 million
E)$189 million
Outlaws Inc. As of December 31, Year 6 ($ millions)
A)-$381 million
B)-$290 million
C)-$91 million
D)$127 million
E)$189 million
Unlock Deck
Unlock for access to all 77 flashcards in this deck.
Unlock Deck
k this deck
Unlock Deck
Unlock for access to all 77 flashcards in this deck.


