Deck 3: Numerical Summaries of Center and Variation
Full screen (f)
Question
Use the following information to answer the question. The mean age of lead actors from the top ten grossing movies of 2007 was 36.4 years with a standard deviation of 9.87 years. Assume the distribution of the actors ages is approximately unimodal and symmetric.
In 2002, actor Adrian Brody won an academy award in for the movie "The Pianist." He was 1- years- old. Finish the statement: "According to the Empirical Rule, the ages of nearly all lead actors will be between and years. Adrien Brody was this range when she won the academy award."


A)26.5; 46.3; not within
B)6.8; 66.0; not within
C)6.8; 66.0; within
D)16.7; 56.1; within
In 2002, actor Adrian Brody won an academy award in for the movie "The Pianist." He was 1- years- old. Finish the statement: "According to the Empirical Rule, the ages of nearly all lead actors will be between and years. Adrien Brody was this range when she won the academy award."
A)26.5; 46.3; not within
B)6.8; 66.0; not within
C)6.8; 66.0; within
D)16.7; 56.1; within
Question
Use the following information to answer the question. The mean age of lead actresses from the top ten grossing movies of 2010 was 29.6 years with a standard deviation of 6.35 years. Assume the distribution of the actresses' ages is approximately unimodal and symmetric.
In 1993, actress Anna Paquin won an academy award in for the movie "The Piano." She was 11- years- old. Finish the statement: "According to the Empirical Rule, the ages of nearly all lead actresses will be between and years. Anna Paquin was this range when she won the academy award."


A)23.3; 36.0; within
B)16.9; 42.3; not within
C)10.6; 48.7; within
D)10.6; 48.7; not within
In 1993, actress Anna Paquin won an academy award in for the movie "The Piano." She was 11- years- old. Finish the statement: "According to the Empirical Rule, the ages of nearly all lead actresses will be between and years. Anna Paquin was this range when she won the academy award."
A)23.3; 36.0; within
B)16.9; 42.3; not within
C)10.6; 48.7; within
D)10.6; 48.7; not within
Question
Question
Question
Question
Question
The following nine values represent race finish times in hours for a randomly selected group of participants in an extreme 10k race (a 10k race with obstacles). Which of the following is closest to the mean of the following data set? 


A)x is about 1.6 hours
B)x is about 1.3 hours
C)x is about 1.1 hours
D)x is about 1.5 hours
A)x is about 1.6 hours
B)x is about 1.3 hours
C)x is about 1.1 hours
D)x is about 1.5 hours
Question
Question
Question
The following list shows the age at appointment of U.S. Supreme Court Chief Justices appointed since 1900. Use the data to answer the question.
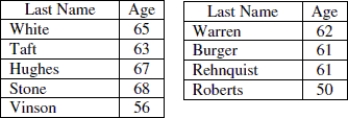
Find the mean, rounding to the nearest tenth of a year, and interpret the mean in this context.
A)The typical age of a U.S. Supreme Court Chief Justice appointed since 1900 is 64.1.
B)The typical age of a U.S. Supreme Court Chief Justice appointed since 1900 is 61.0.
C)The typical age of a U.S. Supreme Court Chief Justice appointed since 1900 is 63.0.
D)The typical age of a U.S. Supreme Court Chief Justice appointed since 1900 is 61.4.
Question
Question
Question
Question
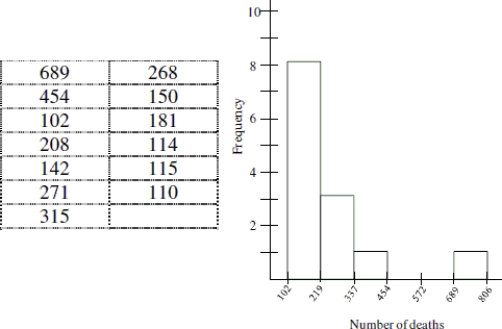
Use the following information to answer the question. Here is a table recording the number of deaths for the top thirteen worst U.S. tornados since 1925. A histogram showing the distribution is also included.

Estimate the most appropriate measure of variability.
A)Standard Deviation; 178.5
B)Standard Deviation; 169.4
C)IQR; 156
D)IQR; 574
Estimate the most appropriate measure of variability.
A)Standard Deviation; 178.5
B)Standard Deviation; 169.4
C)IQR; 156
D)IQR; 574
Question
The following list shows the age at appointment of U.S. Supreme Court Chief Justices appointed since 1900. Use the data to answer the question.

The U.S. Supreme Court Chief Justice data was used to create the following output in an Excel spreadsheet. Choose the statement that best summarizes the variability of the dataset.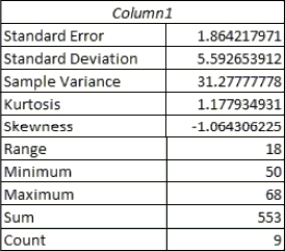
A)The age of most of the U.S. Supreme Court Chief Justice's since 1900 are within 5.6 years of the mean age.
B)The age of most of the U.S. Supreme Court Chief Justice's since 1900 are within 31.3 years of the mean age.
C)The ages of most of the U.S. Supreme Court Chief Justices are between 50 and 68 years.
D)None of these.
Question
Question
Use the following information to answer the question. Here is a table recording the number of deaths for the top thirteen worst U.S. tornados since 1925. A histogram showing the distribution is also included.

Estimate the most appropriate measure of variability.
A)Standard Deviation; 178.5
B)IQR; 156
C)IQR; 574
D)Standard Deviation; 169.4
Estimate the most appropriate measure of variability.
A)Standard Deviation; 178.5
B)IQR; 156
C)IQR; 574
D)Standard Deviation; 169.4
Question
Question
Question
Below is the standard deviation for extreme 10k finish times for a randomly selected group of women and men. Chose the statement that best summarizes the meaning of the standard deviation. 
A)On average, women's finish times will be 0.16 hours less than men's finish times.
B)On average, men's finish times will be 0.25 hours faster than the overall average finish time.
C)The distribution of women's finish times is less varied than the distribution of men's finish times.
D)The distribution of men's finish times is less varied than the distribution of women's finish times.
Question
Use the following information to answer the question. Here is a table recording the number of deaths for the top thirteen worst U.S. tornados since 1925. A histogram showing the distribution is also included.
Choose the most appropriate measure of center then calculate the typical value rounded to the nearest tenth.
A)Mean; 181.0
B)Mean; 239.9
C)Median; 181.0
D)Median; 239.9
Choose the most appropriate measure of center then calculate the typical value rounded to the nearest tenth.
A)Mean; 181.0
B)Mean; 239.9
C)Median; 181.0
D)Median; 239.9
Question
Question
Question
Calculate the five- number summary for the following dataset. 
A)34, 37.5, 53, 68, 79
B)34, 37.5, 51, 62.5, 73
C)32, 39, 52, 63, 79
D)34, 39, 52, 63, 79
A)34, 37.5, 53, 68, 79
B)34, 37.5, 51, 62.5, 73
C)32, 39, 52, 63, 79
D)34, 39, 52, 63, 79
Question
Question
The following nine values represent race finish times in hours for a randomly selected group of participants in an extreme 10k race (a 10k race with obstacles). Which of the following is closest to the mean of the following data set? 


A)x is about 1.6 hours
B)x is about 1.1 hours
C)x is about 1.3 hours
D)x is about 1.4 hours
A)x is about 1.6 hours
B)x is about 1.1 hours
C)x is about 1.3 hours
D)x is about 1.4 hours
Question
Question
The following list shows the age at appointment of U.S. Supreme Court Chief Justices appointed since 1900. Use the data to answer the question.

Find the mean, rounding to the nearest tenth of a year, and interpret the mean in this context.
A)The typical age of a U.S. Supreme Court Chief Justice appointed since 1900 is 61.0.
B)The typical age of a U.S. Supreme Court Chief Justice appointed since 1900 is 61.4.
C)The typical age of a U.S. Supreme Court Chief Justice appointed since 1900 is 64.1.
D)The typical age of a U.S. Supreme Court Chief Justice appointed since 1900 is 63.0.
Question
The following list shows the age at appointment of U.S. Supreme Court Chief Justices appointed since 1900. Use the data to answer the question.

The U.S. Supreme Court Chief Justice data was used to create the following output in an Excel spreadsheet. Choose the statement that best summarizes the variability of the dataset.
A)The age of most of the U.S. Supreme Court Chief Justice's since 1900 are within 5.6 years of the mean age.
B)The ages of most of the U.S. Supreme Court Chief Justices are between 50 and 68 years.
C)The age of most of the U.S. Supreme Court Chief Justice's since 1900 are within 31.3 years of the mean age.
D)None of these.
Question
Question
Question
Question
Use the following information to answer the question. Here is a table recording the number of deaths for the top thirteen worst U.S. tornados since 1925. A histogram showing the distribution is also included.

The worst tornado on record since 1925 is a tornado that went through Missouri, Illinois, and Indiana on March 18, 1925. It killed 689 people. Suppose that when this value was entered into a calculator or other software a mistake was made and it was entered as 1,689. Choose the statement that describes what affect this mistake will have on the median and the mean.
A)The median will be higher than it should be, but the mean will not be affected by the error.
B)The median and the mean will not be affected by the error. Both measures of center are resistant to extreme values.
C)The median will not be affected by the error, but the mean will be higher than it should be.
D)Both the median and the mean will be higher than they should be.
Question
Question
Use the following information to answer the question. Here is a table recording the number of deaths for the top thirteen worst U.S. tornados since 1925. A histogram showing the distribution is also included.

The worst tornado on record since 1925 is a tornado that went through Missouri, Illinois, and Indiana on March 18, 1925. It killed 689 people. Suppose that when this value was entered into a calculator or other software a mistake was made and it was entered as 1,689. Choose the statement that describes what affect this mistake will have on the mean and median.
A)The median and the mean will not be affected by the error. Both measures of center are resistant to extreme values.
B)The median will not be affected by the error, but the mean will be higher than it should be.
C)Both the median and the mean will be higher than they should be.
D)The median will be higher than it should be, but the mean will not be affected by the error.
Question
Below is the standard deviation for extreme 10k finish times for a randomly selected group of women and men. Chose the statement that best summarizes the meaning of the standard deviation. 
A)The distribution of women's finish times is less varied than the distribution of men's finish times.
B)On average, men's finish times will be 0.21 hours faster than the overall average finish time.
C)On average, women's finish times will be 0.17 hours less than men's finish times.
D)The distribution of men's finish times is less varied than the distribution of women's finish times.
Question
Question
Question
Question
Question
Use the following information to answer the question. A junior high gym teacher recorded the time, in minutes, that it took two of her classes to run one mile. Here are the summary statistics for each class:

 Class A: x = 9.6, s = 1.1 Class B: x = 9.9; s = 1.5
Calculate the sample variance for each class. Round to the nearest hundredth and be sure to use the correct symbols and units.
Class A: x = 9.6, s = 1.1 Class B: x = 9.9; s = 1.5Calculate the sample variance for each class. Round to the nearest hundredth and be sure to use the correct symbols and units.
Question
Use the following information to answer the question. A junior high gym teacher recorded the time, in minutes, that it took two of her classes to run one mile. Here are the summary statistics for each class:

 Class A: x = 9.6, s = 1.1 Class B: x = 9.9; s = 1.5
Write a sentence comparing the Class A and Class B. Does one class run faster than the other? Explain.
Class A: x = 9.6, s = 1.1 Class B: x = 9.9; s = 1.5Write a sentence comparing the Class A and Class B. Does one class run faster than the other? Explain.
Question
Question
Use the following data to answer the question. Here are the scores on a recent statistics midterm exam (Scores have been listed from lowest to highest). A histogram showing the distribution is also included.

Choose the most appropriate measure of variability for the data and calculate it. Explain why you chose the measure of variability that you did. Round all calculations to the nearest tenth if necessary.
Choose the most appropriate measure of variability for the data and calculate it. Explain why you chose the measure of variability that you did. Round all calculations to the nearest tenth if necessary.
Question
Question
Use the following information for the question. The boxplots below are from a Graphing Calulator. The boxplots summarize the cost in dollars of a typical evening out for two people (dinner and a movie)in two different cities in west Michigan, Muskegon (top boxplot)and Grand Rapids (bottom boxplot). The five- number summaries are also given for each city.
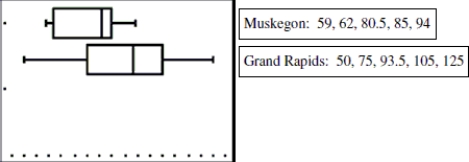
Explain which city you think is more economical for an evening out and why. Be sure to comment on differences in typical value and variation for each city.
Explain which city you think is more economical for an evening out and why. Be sure to comment on differences in typical value and variation for each city.
Question
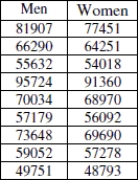
Use the following information to answer the question. Data and summary statistics about college professor's salaries was gathered from nine institutions and is presented below. This salary information is from professors teaching at the Master's level.


 Men: x = 67691; s = 14506 Women: x = 65323; s = 13274
Which group has more variability? How would this affect the histogram for the group, compared to the other group? Explain.
Men: x = 67691; s = 14506 Women: x = 65323; s = 13274Which group has more variability? How would this affect the histogram for the group, compared to the other group? Explain.
Question
Question
Use the following information to answer the question. Data and summary statistics about college professor's salaries was gathered from nine institutions and is presented below. This salary information is from professors teaching at the Master's level.


 Men: x = 67691; s = 14506 Women: x = 65323; s = 13274
Suppose a female professor is offered a position with an annual salary of $80,000. Compared to the women from the nine institutions in the study, would this be an unusually good salary? Explain.
Men: x = 67691; s = 14506 Women: x = 65323; s = 13274Suppose a female professor is offered a position with an annual salary of $80,000. Compared to the women from the nine institutions in the study, would this be an unusually good salary? Explain.
Question
Question
Question
Question
Question
Use the following information to answer the question. Data and summary statistics about college professor's salaries was gathered from nine institutions and is presented below. This salary information is from professors teaching at the Master's level.

 Men: x = 67691; s = 14506 Women: x = 65323; s = 13274
According to a national study, the average salary for a professor teaching at the Master's level is approximately $70,000. How does the data from these nine institutions compare to this? Does it appear that salaries for either group at these nine institutions agrees or disagrees with the study?
Men: x = 67691; s = 14506 Women: x = 65323; s = 13274According to a national study, the average salary for a professor teaching at the Master's level is approximately $70,000. How does the data from these nine institutions compare to this? Does it appear that salaries for either group at these nine institutions agrees or disagrees with the study?
Question
Question
Use the following data to answer the question. Here are the scores on a recent statistics midterm exam (Scores have been listed from lowest to highest). A histogram showing the distribution is also included.
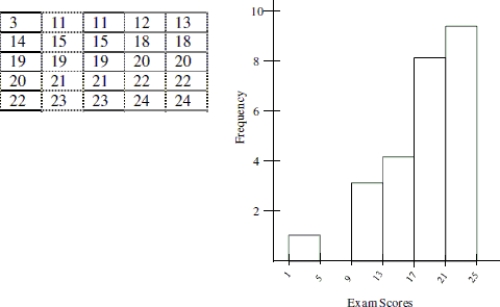
Which measure of center, mean or median, would be most appropriate, and why? Using the data and the histogram, find the approximate value of the appropriate measure of center, and describe how you found it.
Which measure of center, mean or median, would be most appropriate, and why? Using the data and the histogram, find the approximate value of the appropriate measure of center, and describe how you found it.
Question
Use the following data to answer the question. Here are the scores on a recent statistics midterm exam (Scores have been listed from lowest to highest). A histogram showing the distribution is also included.

The worst midterm grade was received by a student who was absent the week prior to the exam due to illness. Should this grade be considered an outlier? Explain and support your reasoning. Be sure to state what you would do with this data value.
The worst midterm grade was received by a student who was absent the week prior to the exam due to illness. Should this grade be considered an outlier? Explain and support your reasoning. Be sure to state what you would do with this data value.
Question
Question
Use the following information for the question. The boxplots below are from a Graphing Calulator. The boxplots summarize the cost in dollars of a typical evening out for two people (dinner and a movie)in two different cities in west Michigan, Muskegon (top boxplot)and Grand Rapids (bottom boxplot). The five- number summaries are also given for each city.

Brian and his significant other plan to visit west Michigan and eat out every night at a different restaurant. He wants to be careful about his budget. Based on the information provided, which city would be best for them to visit and why?
Brian and his significant other plan to visit west Michigan and eat out every night at a different restaurant. He wants to be careful about his budget. Based on the information provided, which city would be best for them to visit and why?
Question

Unlock Deck
Sign up to unlock the cards in this deck!
Unlock Deck
Unlock Deck
1/60
Play
Full screen (f)
Deck 3: Numerical Summaries of Center and Variation
1
Use the following information to answer the question. The mean age of lead actors from the top ten grossing movies of 2007 was 36.4 years with a standard deviation of 9.87 years. Assume the distribution of the actors ages is approximately unimodal and symmetric.
In 2002, actor Adrian Brody won an academy award in for the movie "The Pianist." He was 1- years- old. Finish the statement: "According to the Empirical Rule, the ages of nearly all lead actors will be between and years. Adrien Brody was this range when she won the academy award."
A)26.5; 46.3; not within
B)6.8; 66.0; not within
C)6.8; 66.0; within
D)16.7; 56.1; within
6.8; 66.0; within
2
Use the following information to answer the question. The mean age of lead actresses from the top ten grossing movies of 2010 was 29.6 years with a standard deviation of 6.35 years. Assume the distribution of the actresses' ages is approximately unimodal and symmetric.
In 1993, actress Anna Paquin won an academy award in for the movie "The Piano." She was 11- years- old. Finish the statement: "According to the Empirical Rule, the ages of nearly all lead actresses will be between and years. Anna Paquin was this range when she won the academy award."
A)23.3; 36.0; within
B)16.9; 42.3; not within
C)10.6; 48.7; within
D)10.6; 48.7; not within
10.6; 48.7; within
3
Use the following information to answer the question. The mean age of lead actors from the top ten grossing movies of 2007 was 36.4 years with a standard deviation of 9.87 years. Assume the distribution of the actors ages is approximately unimodal and symmetric.
Between what two values would you expect to find about 68% of the lead actors ages?
A)16.66 and 56.14 years
B)6.87 and 66.01 years
C)26.53 and 46.27 years
D)None of these
Between what two values would you expect to find about 68% of the lead actors ages?
A)16.66 and 56.14 years
B)6.87 and 66.01 years
C)26.53 and 46.27 years
D)None of these
26.53 and 46.27 years
4
Use the following information to answer the question. The mean age of lead actresses from the top ten grossing movies of 2010 was 29.6 years with a standard deviation of 6.35 years. Assume the distribution of the actresses' ages is approximately unimodal and symmetric.
In 2010, popular actress Jennifer Aniston was 41- years- old. What is Jennifer Aniston's age if it is standardized? Would it be unusual for a 41- year- old actress to be in a top- grossing film of 2010? Assume the Empirical Rule applies and round to the nearest hundredth.
A)z = - 1.80; It would be unusual.
B)z = - 1.80; It would not be unusual.
C)z = 1.80; It would be unusual.
D)z = 1.80; It would not be unusual.
Unlock Deck
Unlock for access to all 60 flashcards in this deck.
Unlock Deck
k this deck
5
Based on the boxplot for the Midwest, which of the following is true?
A)50% of the states sentenced more than 29,928 prisoners.
B)50% of the states sentenced less than 4,322 prisoners.
C)25% of the states sentenced more than 29,928 prisoners.
D)25% of the states sentenced less than 1,435 prisoners.
A)50% of the states sentenced more than 29,928 prisoners.
B)50% of the states sentenced less than 4,322 prisoners.
C)25% of the states sentenced more than 29,928 prisoners.
D)25% of the states sentenced less than 1,435 prisoners.
Unlock Deck
Unlock for access to all 60 flashcards in this deck.
Unlock Deck
k this deck
6
Use the following information to answer the question. The economic impact of an industry, such as sport fishing, can be measured by the retail sales it generates. In 2006, the economic impact of great lakes fishing in states bordering the great lakes had a mean of $318 and a standard deviation of $83.5. Note that all dollar amounts are in millions of dollars. Assume the distribution of retail sales is unimodal and symmetric. (Source: National Oceanic and Atmospheric Administration).
If a new report came out saying that the economic impact of great lakes sport fishing on the economy of Illinois was $93,588,546, would you say this was unusual? Note that this dollar amount must be converted before calculating a standard score.
A)Not enough information available
B)Yes, it is unusually high.
C)Yes, it is unusually low.
D)No, it is in the range of typical values.
Unlock Deck
Unlock for access to all 60 flashcards in this deck.
Unlock Deck
k this deck
7
The following nine values represent race finish times in hours for a randomly selected group of participants in an extreme 10k race (a 10k race with obstacles). Which of the following is closest to the mean of the following data set?
A)x is about 1.6 hours
B)x is about 1.3 hours
C)x is about 1.1 hours
D)x is about 1.5 hours
A)x is about 1.6 hours
B)x is about 1.3 hours
C)x is about 1.1 hours
D)x is about 1.5 hours
Unlock Deck
Unlock for access to all 60 flashcards in this deck.
Unlock Deck
k this deck
8
Use the following information to answer the question. The economic impact of an industry, such as sport fishing, can be measured by the retail sales it generates. In 2006, the economic impact of great lakes fishing in states bordering the great lakes had a mean of $318 and a standard deviation of $83.5. Note that all dollar amounts are in millions of dollars. Assume the distribution of retail sales is unimodal and symmetric. (Source: National Oceanic and Atmospheric Administration).
For what percentage of great lakes states would you expect the economic impact from fishing to be between $234.5 and $401.5 (in millions of dollars)?
A)68%
B)Nearly all
C)95%
D)None of these
For what percentage of great lakes states would you expect the economic impact from fishing to be between $234.5 and $401.5 (in millions of dollars)?
A)68%
B)Nearly all
C)95%
D)None of these
Unlock Deck
Unlock for access to all 60 flashcards in this deck.
Unlock Deck
k this deck
9
The mean price of a pound of ground beef in 75 cities in the Midwest is $2.11 and the standard deviation is $0.56. A histogram of the data shows that the distribution is symmetrical. A local Midwest grocer is selling a pound of ground beef for $3.25. What is this price in standard units? Assuming the Empirical Rule applies, would this price be unusual or not? Round to the nearest hundredth.
A)z = 2.04; This price would not be unusual.
B)z = - 2.04; This is unusually inexpensive ground beef.
C)z = 2.04; This is unusually expensive ground beef.
D)z = - 2.04; This price would not be unusual.
A)z = 2.04; This price would not be unusual.
B)z = - 2.04; This is unusually inexpensive ground beef.
C)z = 2.04; This is unusually expensive ground beef.
D)z = - 2.04; This price would not be unusual.
Unlock Deck
Unlock for access to all 60 flashcards in this deck.
Unlock Deck
k this deck
10
The following list shows the age at appointment of U.S. Supreme Court Chief Justices appointed since 1900. Use the data to answer the question.
Find the mean, rounding to the nearest tenth of a year, and interpret the mean in this context.
A)The typical age of a U.S. Supreme Court Chief Justice appointed since 1900 is 64.1.
B)The typical age of a U.S. Supreme Court Chief Justice appointed since 1900 is 61.0.
C)The typical age of a U.S. Supreme Court Chief Justice appointed since 1900 is 63.0.
D)The typical age of a U.S. Supreme Court Chief Justice appointed since 1900 is 61.4.
Unlock Deck
Unlock for access to all 60 flashcards in this deck.
Unlock Deck
k this deck
11
Between what two values would you expect to find about 95% of the lead actors ages?
A)6.87 and 66.01 years
B)16.66 and 56.14 years
C)26.53 and 46.27 years
D)None of these
A)6.87 and 66.01 years
B)16.66 and 56.14 years
C)26.53 and 46.27 years
D)None of these
Unlock Deck
Unlock for access to all 60 flashcards in this deck.
Unlock Deck
k this deck
12
In 2007, the mean price per pound of lobster in New England was $11.48 and the standard deviation was $2.12. A histogram of the data shows that the distribution is symmetrical. A local New England grocer is selling lobster for $8.99 per pound. What is this price in standard units? Assuming the Empirical Rule applies, would this price be considered unusual or not? Round to the nearest hundredth.
A)z = 1.17; This is unusually expensive lobster.
B)z = 1.17; This price would not be unusual.
C)z = - 1.17; This is unusually inexpensive lobster.
D)z = - 1.17; This price would not be unusual.
A)z = 1.17; This is unusually expensive lobster.
B)z = 1.17; This price would not be unusual.
C)z = - 1.17; This is unusually inexpensive lobster.
D)z = - 1.17; This price would not be unusual.
Unlock Deck
Unlock for access to all 60 flashcards in this deck.
Unlock Deck
k this deck
13
A city planner says, "The typical commute to work for someone living in the city limits is less than the commute to work for someone living in the suburbs." What does this statement mean?
A)If you live in the city limits you will have a longer commute time.
B)All city dwellers spend less time commuting to work than those living in the suburbs.
C)The center of the distribution of commute times for a city- dweller is less than the center of the distribution for those living in the suburbs.
D)There is less variation in the commute time of those living in the suburbs.
Unlock Deck
Unlock for access to all 60 flashcards in this deck.
Unlock Deck
k this deck
14
Use the following information to answer the question. Here is a table recording the number of deaths for the top thirteen worst U.S. tornados since 1925. A histogram showing the distribution is also included.
Estimate the most appropriate measure of variability.
A)Standard Deviation; 178.5
B)Standard Deviation; 169.4
C)IQR; 156
D)IQR; 574
Estimate the most appropriate measure of variability.
A)Standard Deviation; 178.5
B)Standard Deviation; 169.4
C)IQR; 156
D)IQR; 574
Unlock Deck
Unlock for access to all 60 flashcards in this deck.
Unlock Deck
k this deck
15
The following list shows the age at appointment of U.S. Supreme Court Chief Justices appointed since 1900. Use the data to answer the question.
The U.S. Supreme Court Chief Justice data was used to create the following output in an Excel spreadsheet. Choose the statement that best summarizes the variability of the dataset.
A)The age of most of the U.S. Supreme Court Chief Justice's since 1900 are within 5.6 years of the mean age.
B)The age of most of the U.S. Supreme Court Chief Justice's since 1900 are within 31.3 years of the mean age.
C)The ages of most of the U.S. Supreme Court Chief Justices are between 50 and 68 years.
D)None of these.
Unlock Deck
Unlock for access to all 60 flashcards in this deck.
Unlock Deck
k this deck
16
Use the following information to answer the question. The economic impact of an industry, such as sport fishing, can be measured by the retail sales it generates. In 2006, the economic impact of great lakes fishing in states bordering the great lakes had a mean of $318 and a standard deviation of $83.5. Note that all dollar amounts are in millions of dollars. Assume the distribution of retail sales is unimodal and symmetric. (Source: National Oceanic and Atmospheric Administration).
If a new report came out saying that the economic impact of great lakes sport fishing on the economy of Illinois was $93,588,546, would you say this was unusual? Note that this dollar amount must be converted before calculating a standard score.
A)Yes, it is unusually high.
B)No, it is in the range of typical values.
C)Yes, it is unusually low.
D)Not enough information available
Unlock Deck
Unlock for access to all 60 flashcards in this deck.
Unlock Deck
k this deck
17
Use the following information to answer the question. Here is a table recording the number of deaths for the top thirteen worst U.S. tornados since 1925. A histogram showing the distribution is also included.
Estimate the most appropriate measure of variability.
A)Standard Deviation; 178.5
B)IQR; 156
C)IQR; 574
D)Standard Deviation; 169.4
Estimate the most appropriate measure of variability.
A)Standard Deviation; 178.5
B)IQR; 156
C)IQR; 574
D)Standard Deviation; 169.4
Unlock Deck
Unlock for access to all 60 flashcards in this deck.
Unlock Deck
k this deck
18
Using the boxplot for the West, determine which of the following statements about the distribution cannot be justified.
A)The interquartile range is about 11,819.
B)The distribution is skewed to the right.
C)The range is 32,467.
D)There are fewer states with 3887.5 to 6887 prisoners than states with 6887 to 15,706 prisoners.
E)About 75% of the West states had 3,887 or more prisoners.
A)The interquartile range is about 11,819.
B)The distribution is skewed to the right.
C)The range is 32,467.
D)There are fewer states with 3887.5 to 6887 prisoners than states with 6887 to 15,706 prisoners.
E)About 75% of the West states had 3,887 or more prisoners.
Unlock Deck
Unlock for access to all 60 flashcards in this deck.
Unlock Deck
k this deck
19
Use the following information to answer the question. The mean age of lead actresses from the top ten grossing movies of 2010 was 29.6 years with a standard deviation of 6.35 years. Assume the distribution of the actresses' ages is approximately unimodal and symmetric.
Between what two values would you expect to find about 95% of the lead actresses ages?
A)10.55 and 48.65 years
B)23.25 and 35.95 years
C)16.9 and 42.3 years
D)None of these
Between what two values would you expect to find about 95% of the lead actresses ages?
A)10.55 and 48.65 years
B)23.25 and 35.95 years
C)16.9 and 42.3 years
D)None of these
Unlock Deck
Unlock for access to all 60 flashcards in this deck.
Unlock Deck
k this deck
20
Below is the standard deviation for extreme 10k finish times for a randomly selected group of women and men. Chose the statement that best summarizes the meaning of the standard deviation.
A)On average, women's finish times will be 0.16 hours less than men's finish times.
B)On average, men's finish times will be 0.25 hours faster than the overall average finish time.
C)The distribution of women's finish times is less varied than the distribution of men's finish times.
D)The distribution of men's finish times is less varied than the distribution of women's finish times.
Unlock Deck
Unlock for access to all 60 flashcards in this deck.
Unlock Deck
k this deck
21
Use the following information to answer the question. Here is a table recording the number of deaths for the top thirteen worst U.S. tornados since 1925. A histogram showing the distribution is also included.
Choose the most appropriate measure of center then calculate the typical value rounded to the nearest tenth.
A)Mean; 181.0
B)Mean; 239.9
C)Median; 181.0
D)Median; 239.9
Choose the most appropriate measure of center then calculate the typical value rounded to the nearest tenth.
A)Mean; 181.0
B)Mean; 239.9
C)Median; 181.0
D)Median; 239.9
Unlock Deck
Unlock for access to all 60 flashcards in this deck.
Unlock Deck
k this deck
22
A school board member says, "The typical bus ride to school for a student living in the city limits is more than the bus ride to school for a student living in the suburbs." What does this statement mean?
A)There is less variation in the bus ride times of those living in the suburbs.
B)The center of the distribution of bus ride times for a city- dweller is more than the center of the distribution for those living in the suburbs
C)All students living in the city spend less time riding the bus to school than those living in the suburbs.
D)If you are a student living in the city limits you will have a shorter commute time.
Unlock Deck
Unlock for access to all 60 flashcards in this deck.
Unlock Deck
k this deck
23
Choose the most appropriate measure of center then calculate the typical value rounded to the nearest tenth.
A)Median; 181.0
B)Mean; 239.9
C)Mean; 181.0
D)Median; 239.9
A)Median; 181.0
B)Mean; 239.9
C)Mean; 181.0
D)Median; 239.9
Unlock Deck
Unlock for access to all 60 flashcards in this deck.
Unlock Deck
k this deck
24
Calculate the five- number summary for the following dataset.
A)34, 37.5, 53, 68, 79
B)34, 37.5, 51, 62.5, 73
C)32, 39, 52, 63, 79
D)34, 39, 52, 63, 79
A)34, 37.5, 53, 68, 79
B)34, 37.5, 51, 62.5, 73
C)32, 39, 52, 63, 79
D)34, 39, 52, 63, 79
Unlock Deck
Unlock for access to all 60 flashcards in this deck.
Unlock Deck
k this deck
25
Use the following information to answer the question. The economic impact of an industry, such as sport fishing, can be measured by the retail sales it generates. In 2006, the economic impact of great lakes fishing in states bordering the great lakes had a mean of $318 and a standard deviation of $83.5. Note that all dollar amounts are in millions of dollars. Assume the distribution of retail sales is unimodal and symmetric. (Source: National Oceanic and Atmospheric Administration).
The economic impact of fishing for nearly all great lakes states should fall within what range (in millions of dollars)?
A)$234.5 to $401.5
B)$67.5 to $568.5
C)$151 to $485
D)$83.5 to $318
The economic impact of fishing for nearly all great lakes states should fall within what range (in millions of dollars)?
A)$234.5 to $401.5
B)$67.5 to $568.5
C)$151 to $485
D)$83.5 to $318
Unlock Deck
Unlock for access to all 60 flashcards in this deck.
Unlock Deck
k this deck
26
The following nine values represent race finish times in hours for a randomly selected group of participants in an extreme 10k race (a 10k race with obstacles). Which of the following is closest to the mean of the following data set?
A)x is about 1.6 hours
B)x is about 1.1 hours
C)x is about 1.3 hours
D)x is about 1.4 hours
A)x is about 1.6 hours
B)x is about 1.1 hours
C)x is about 1.3 hours
D)x is about 1.4 hours
Unlock Deck
Unlock for access to all 60 flashcards in this deck.
Unlock Deck
k this deck
27
Use the following information to answer the question. The economic impact of an industry, such as sport fishing, can be measured by the retail sales it generates. In 2006, the economic impact of great lakes fishing in states bordering the great lakes had a mean of $318 and a standard deviation of $83.5. Note that all dollar amounts are in millions of dollars. Assume the distribution of retail sales is unimodal and symmetric. (Source: National Oceanic and Atmospheric Administration).
For what percentage of great lakes states would you expect the economic impact from fishing to be between $151.00 and $485.00 (in millions of dollars)?
A)68%
B)95%
C)Nearly all
D)None of these
For what percentage of great lakes states would you expect the economic impact from fishing to be between $151.00 and $485.00 (in millions of dollars)?
A)68%
B)95%
C)Nearly all
D)None of these
Unlock Deck
Unlock for access to all 60 flashcards in this deck.
Unlock Deck
k this deck
28
The following list shows the age at appointment of U.S. Supreme Court Chief Justices appointed since 1900. Use the data to answer the question.
Find the mean, rounding to the nearest tenth of a year, and interpret the mean in this context.
A)The typical age of a U.S. Supreme Court Chief Justice appointed since 1900 is 61.0.
B)The typical age of a U.S. Supreme Court Chief Justice appointed since 1900 is 61.4.
C)The typical age of a U.S. Supreme Court Chief Justice appointed since 1900 is 64.1.
D)The typical age of a U.S. Supreme Court Chief Justice appointed since 1900 is 63.0.
Unlock Deck
Unlock for access to all 60 flashcards in this deck.
Unlock Deck
k this deck
29
The following list shows the age at appointment of U.S. Supreme Court Chief Justices appointed since 1900. Use the data to answer the question.
The U.S. Supreme Court Chief Justice data was used to create the following output in an Excel spreadsheet. Choose the statement that best summarizes the variability of the dataset.
A)The age of most of the U.S. Supreme Court Chief Justice's since 1900 are within 5.6 years of the mean age.
B)The ages of most of the U.S. Supreme Court Chief Justices are between 50 and 68 years.
C)The age of most of the U.S. Supreme Court Chief Justice's since 1900 are within 31.3 years of the mean age.
D)None of these.
Unlock Deck
Unlock for access to all 60 flashcards in this deck.
Unlock Deck
k this deck
30
Calculate the five- number summary for the following dataset. 41.19, 83.51, 19.98, 114.60, 63.08, 83.88
A)41.19, 73.295, 83.88, 114.6
B)19, 41, 63, 84, 115
C)19.98, 41.19, 75, 115, 83.88
D)19.98, 41.19, 73.295, 83.88, 114.6
A)41.19, 73.295, 83.88, 114.6
B)19, 41, 63, 84, 115
C)19.98, 41.19, 75, 115, 83.88
D)19.98, 41.19, 73.295, 83.88, 114.6
Unlock Deck
Unlock for access to all 60 flashcards in this deck.
Unlock Deck
k this deck
31
Use the following information to answer the question. The mean age of lead actresses from the top ten grossing movies of 2010 was 29.6 years with a standard deviation of 6.35 years. Assume the distribution of the actresses' ages is approximately unimodal and symmetric.
Between what two values would you expect to find about 68% of the lead actresses ages?
A)10.55 and 48.65 years
B)23.25 and 35.95 years
C)16.9 and 42.3 years
D)None of these
Between what two values would you expect to find about 68% of the lead actresses ages?
A)10.55 and 48.65 years
B)23.25 and 35.95 years
C)16.9 and 42.3 years
D)None of these
Unlock Deck
Unlock for access to all 60 flashcards in this deck.
Unlock Deck
k this deck
32
Use the following information to answer the question. The economic impact of an industry, such as sport fishing, can be measured by the retail sales it generates. In 2006, the economic impact of great lakes fishing in states bordering the great lakes had a mean of $318 and a standard deviation of $83.5. Note that all dollar amounts are in millions of dollars. Assume the distribution of retail sales is unimodal and symmetric. (Source: National Oceanic and Atmospheric Administration).
The economic impact of fishing for nearly all great lakes states should fall within what range (in millions of dollars)?
A)$67.5 to $568.5
B)$234.5 to $401.5
C)$83.5 to $318
D)$151 to $485
The economic impact of fishing for nearly all great lakes states should fall within what range (in millions of dollars)?
A)$67.5 to $568.5
B)$234.5 to $401.5
C)$83.5 to $318
D)$151 to $485
Unlock Deck
Unlock for access to all 60 flashcards in this deck.
Unlock Deck
k this deck
33
Use the following information to answer the question. Here is a table recording the number of deaths for the top thirteen worst U.S. tornados since 1925. A histogram showing the distribution is also included.
The worst tornado on record since 1925 is a tornado that went through Missouri, Illinois, and Indiana on March 18, 1925. It killed 689 people. Suppose that when this value was entered into a calculator or other software a mistake was made and it was entered as 1,689. Choose the statement that describes what affect this mistake will have on the median and the mean.
A)The median will be higher than it should be, but the mean will not be affected by the error.
B)The median and the mean will not be affected by the error. Both measures of center are resistant to extreme values.
C)The median will not be affected by the error, but the mean will be higher than it should be.
D)Both the median and the mean will be higher than they should be.
Unlock Deck
Unlock for access to all 60 flashcards in this deck.
Unlock Deck
k this deck
34
Use the following information to answer the question. The mean age of lead actors from the top ten grossing movies of 2007 was 36.4 years with a standard deviation of 9.87 years. Assume the distribution of the actors ages is approximately unimodal and symmetric.
In 2007, popular actor and singer Justin Timberlake was 26- years- old. What is Justin Timberlake's age in 2007 if it is standardized? Would it be unusual for a 26- year- old actor to be in a top- grossing film of 2007? Assume the Empirical Rule applies and round to the nearest hundredth.
A)z = - 1.05; It would not be unusual.
B)z = 1.05; It would be unusual.
C)z = 1.05; It would not be unusual.
D)z = - 1.05; It would be unusual.
Unlock Deck
Unlock for access to all 60 flashcards in this deck.
Unlock Deck
k this deck
35
Use the following information to answer the question. Here is a table recording the number of deaths for the top thirteen worst U.S. tornados since 1925. A histogram showing the distribution is also included.
The worst tornado on record since 1925 is a tornado that went through Missouri, Illinois, and Indiana on March 18, 1925. It killed 689 people. Suppose that when this value was entered into a calculator or other software a mistake was made and it was entered as 1,689. Choose the statement that describes what affect this mistake will have on the mean and median.
A)The median and the mean will not be affected by the error. Both measures of center are resistant to extreme values.
B)The median will not be affected by the error, but the mean will be higher than it should be.
C)Both the median and the mean will be higher than they should be.
D)The median will be higher than it should be, but the mean will not be affected by the error.
Unlock Deck
Unlock for access to all 60 flashcards in this deck.
Unlock Deck
k this deck
36
Below is the standard deviation for extreme 10k finish times for a randomly selected group of women and men. Chose the statement that best summarizes the meaning of the standard deviation.
A)The distribution of women's finish times is less varied than the distribution of men's finish times.
B)On average, men's finish times will be 0.21 hours faster than the overall average finish time.
C)On average, women's finish times will be 0.17 hours less than men's finish times.
D)The distribution of men's finish times is less varied than the distribution of women's finish times.
Unlock Deck
Unlock for access to all 60 flashcards in this deck.
Unlock Deck
k this deck
37
Using the boxplot for the Midwest, determine which of the following statements about the distribution cannot be justified.
A)The range is 32,467.
B)The distribution is skewed to the right.
C)There are fewer states with 3887.5 to 6887 prisoners than states with 6887 to 15,706 prisoners.
D)About 75% of the West states had 3,887 or more prisoners.
A)The range is 32,467.
B)The distribution is skewed to the right.
C)There are fewer states with 3887.5 to 6887 prisoners than states with 6887 to 15,706 prisoners.
D)About 75% of the West states had 3,887 or more prisoners.
Unlock Deck
Unlock for access to all 60 flashcards in this deck.
Unlock Deck
k this deck
38
Pick the statement that best describes the shape of the distribution for the states in the West.
A)The data appears to be roughly symmetrical with a possible outlier.
B)The data appears to be left- skewed with large variability.
C)The data appears to be right- skewed with a possible outlier.
A)The data appears to be roughly symmetrical with a possible outlier.
B)The data appears to be left- skewed with large variability.
C)The data appears to be right- skewed with a possible outlier.
Unlock Deck
Unlock for access to all 60 flashcards in this deck.
Unlock Deck
k this deck
39
Based on the boxplot for the West, which of the following is true?
A)25% of the states sentenced more than 15,706 prisoners.
B)50% of the states sentenced less than 22,662 prisoners.
C)25% of the states sentenced less than 3,888 prisoners.
D)50% of the states sentenced less than 15,706 prisoners.
A)25% of the states sentenced more than 15,706 prisoners.
B)50% of the states sentenced less than 22,662 prisoners.
C)25% of the states sentenced less than 3,888 prisoners.
D)50% of the states sentenced less than 15,706 prisoners.
Unlock Deck
Unlock for access to all 60 flashcards in this deck.
Unlock Deck
k this deck
40
Pick the statement that best describes the shape of the distribution for the states in the Midwest.
A)The data appears to be right- skewed with a possible outlier.
B)The data appears to be right- skewed with large variability.
C)The data appears to be roughly symmetrical with a possible outlier.
D)The data appears to be left- skewed with large variability.
A)The data appears to be right- skewed with a possible outlier.
B)The data appears to be right- skewed with large variability.
C)The data appears to be roughly symmetrical with a possible outlier.
D)The data appears to be left- skewed with large variability.
Unlock Deck
Unlock for access to all 60 flashcards in this deck.
Unlock Deck
k this deck
41
Use the following information to answer the question. A junior high gym teacher recorded the time, in minutes, that it took two of her classes to run one mile. Here are the summary statistics for each class:
Class A: x = 9.6, s = 1.1 Class B: x = 9.9; s = 1.5
Calculate the sample variance for each class. Round to the nearest hundredth and be sure to use the correct symbols and units.
Class A: x = 9.6, s = 1.1 Class B: x = 9.9; s = 1.5Calculate the sample variance for each class. Round to the nearest hundredth and be sure to use the correct symbols and units.
Unlock Deck
Unlock for access to all 60 flashcards in this deck.
Unlock Deck
k this deck
42
Use the following information to answer the question. A junior high gym teacher recorded the time, in minutes, that it took two of her classes to run one mile. Here are the summary statistics for each class:
Class A: x = 9.6, s = 1.1 Class B: x = 9.9; s = 1.5
Write a sentence comparing the Class A and Class B. Does one class run faster than the other? Explain.
Class A: x = 9.6, s = 1.1 Class B: x = 9.9; s = 1.5Write a sentence comparing the Class A and Class B. Does one class run faster than the other? Explain.
Unlock Deck
Unlock for access to all 60 flashcards in this deck.
Unlock Deck
k this deck
43
Explain in your own words what the sample standard deviation is and why it is an important summary statistic.
Unlock Deck
Unlock for access to all 60 flashcards in this deck.
Unlock Deck
k this deck
44
Use the following data to answer the question. Here are the scores on a recent statistics midterm exam (Scores have been listed from lowest to highest). A histogram showing the distribution is also included.
Choose the most appropriate measure of variability for the data and calculate it. Explain why you chose the measure of variability that you did. Round all calculations to the nearest tenth if necessary.
Choose the most appropriate measure of variability for the data and calculate it. Explain why you chose the measure of variability that you did. Round all calculations to the nearest tenth if necessary.
Unlock Deck
Unlock for access to all 60 flashcards in this deck.
Unlock Deck
k this deck
45
Use the following information to answer the question. The average snowfall for cities in Michigan is 71.6 inches with a standard deviation of 9.7 inches. Assume the distribution for annual snowfall is approximately unimodal and symmetrical.
What is the range of values for annual snowfall that would contain roughly 95% of the cities in Michigan? Round calculations to the nearest tenth.
What is the range of values for annual snowfall that would contain roughly 95% of the cities in Michigan? Round calculations to the nearest tenth.
Unlock Deck
Unlock for access to all 60 flashcards in this deck.
Unlock Deck
k this deck
46
Use the following information for the question. The boxplots below are from a Graphing Calulator. The boxplots summarize the cost in dollars of a typical evening out for two people (dinner and a movie)in two different cities in west Michigan, Muskegon (top boxplot)and Grand Rapids (bottom boxplot). The five- number summaries are also given for each city.
Explain which city you think is more economical for an evening out and why. Be sure to comment on differences in typical value and variation for each city.
Explain which city you think is more economical for an evening out and why. Be sure to comment on differences in typical value and variation for each city.
Unlock Deck
Unlock for access to all 60 flashcards in this deck.
Unlock Deck
k this deck
47
Use the following information to answer the question. Data and summary statistics about college professor's salaries was gathered from nine institutions and is presented below. This salary information is from professors teaching at the Master's level.
Men: x = 67691; s = 14506 Women: x = 65323; s = 13274
Which group has more variability? How would this affect the histogram for the group, compared to the other group? Explain.
Men: x = 67691; s = 14506 Women: x = 65323; s = 13274Which group has more variability? How would this affect the histogram for the group, compared to the other group? Explain.
Unlock Deck
Unlock for access to all 60 flashcards in this deck.
Unlock Deck
k this deck
48
Use the following information to answer the question. The average snowfall for cities in Michigan is 71.6 inches with a standard deviation of 9.7 inches. Assume the distribution for annual snowfall is approximately unimodal and symmetrical.
In 2007, the annual snowfall in Grand Rapids, Michigan was 97.2 inches. What is the standard score for the 2007 snowfall? Was this an unusual amount of snowfall for a city in Michigan? Show all work and round any calculations to the nearest tenth.
In 2007, the annual snowfall in Grand Rapids, Michigan was 97.2 inches. What is the standard score for the 2007 snowfall? Was this an unusual amount of snowfall for a city in Michigan? Show all work and round any calculations to the nearest tenth.
Unlock Deck
Unlock for access to all 60 flashcards in this deck.
Unlock Deck
k this deck
49
Use the following information to answer the question. Data and summary statistics about college professor's salaries was gathered from nine institutions and is presented below. This salary information is from professors teaching at the Master's level.
Men: x = 67691; s = 14506 Women: x = 65323; s = 13274
Suppose a female professor is offered a position with an annual salary of $80,000. Compared to the women from the nine institutions in the study, would this be an unusually good salary? Explain.
Men: x = 67691; s = 14506 Women: x = 65323; s = 13274Suppose a female professor is offered a position with an annual salary of $80,000. Compared to the women from the nine institutions in the study, would this be an unusually good salary? Explain.
Unlock Deck
Unlock for access to all 60 flashcards in this deck.
Unlock Deck
k this deck
50
Use the following information to answer the question. In 2007, the average number of hours spent online at home for U. S. adults with internet access was 8.9 hours with a standard deviation of 0.4 hours. The U. S average was determined by collecting cluster data from thirty randomly selected states. Assume the distribution of time spent online at home is approximately unimodal and symmetric.
What is the range of time spent online at home for 95% of adults with internet access? Round to the nearest tenth.
What is the range of time spent online at home for 95% of adults with internet access? Round to the nearest tenth.
Unlock Deck
Unlock for access to all 60 flashcards in this deck.
Unlock Deck
k this deck
51
In your own words, explain what the Empirical Rule says and what conditions a distribution must meet in order to apply the rule.
Unlock Deck
Unlock for access to all 60 flashcards in this deck.
Unlock Deck
k this deck
52
Use the following information to answer the question. In 2007, the average number of hours spent online at home for U. S. adults with internet access was 8.9 hours with a standard deviation of 0.4 hours. The U. S average was determined by collecting cluster data from thirty randomly selected states. Assume the distribution of time spent online at home is approximately unimodal and symmetric.
The standard score for hours spent online at home for Minnesotans was 3.00. Approximately how many hours do Minnesotan adults spend online at home? Show your work and round all calculations to the nearest tenth.
The standard score for hours spent online at home for Minnesotans was 3.00. Approximately how many hours do Minnesotan adults spend online at home? Show your work and round all calculations to the nearest tenth.
Unlock Deck
Unlock for access to all 60 flashcards in this deck.
Unlock Deck
k this deck
53
Use the following information to answer the question. In 2007, the average number of hours spent online at home for U. S. adults with internet access was 8.9 hours with a standard deviation of 0.4 hours. The U. S average was determined by collecting cluster data from thirty randomly selected states. Assume the distribution of time spent online at home is approximately unimodal and symmetric.
If a new report came out saying that on average, Floridian adults spent 8.0 hours online while at home, would you say this was an unusual value? If it was unusual, explain how you reached your conclusion and whether it was unusually high or low.
If a new report came out saying that on average, Floridian adults spent 8.0 hours online while at home, would you say this was an unusual value? If it was unusual, explain how you reached your conclusion and whether it was unusually high or low.
Unlock Deck
Unlock for access to all 60 flashcards in this deck.
Unlock Deck
k this deck
54
Use the following information to answer the question. Data and summary statistics about college professor's salaries was gathered from nine institutions and is presented below. This salary information is from professors teaching at the Master's level.
Men: x = 67691; s = 14506 Women: x = 65323; s = 13274
According to a national study, the average salary for a professor teaching at the Master's level is approximately $70,000. How does the data from these nine institutions compare to this? Does it appear that salaries for either group at these nine institutions agrees or disagrees with the study?
Men: x = 67691; s = 14506 Women: x = 65323; s = 13274According to a national study, the average salary for a professor teaching at the Master's level is approximately $70,000. How does the data from these nine institutions compare to this? Does it appear that salaries for either group at these nine institutions agrees or disagrees with the study?
Unlock Deck
Unlock for access to all 60 flashcards in this deck.
Unlock Deck
k this deck
55
Eric is contemplating whether to accept a job offer in an unfamiliar city. The move would mean buying a new home for his family of five people. He is curious about typical home prices in the new city. Which information would more useful to him, average house prices or median house prices? Explain.
Unlock Deck
Unlock for access to all 60 flashcards in this deck.
Unlock Deck
k this deck
56
Use the following data to answer the question. Here are the scores on a recent statistics midterm exam (Scores have been listed from lowest to highest). A histogram showing the distribution is also included.
Which measure of center, mean or median, would be most appropriate, and why? Using the data and the histogram, find the approximate value of the appropriate measure of center, and describe how you found it.
Which measure of center, mean or median, would be most appropriate, and why? Using the data and the histogram, find the approximate value of the appropriate measure of center, and describe how you found it.
Unlock Deck
Unlock for access to all 60 flashcards in this deck.
Unlock Deck
k this deck
57
Use the following data to answer the question. Here are the scores on a recent statistics midterm exam (Scores have been listed from lowest to highest). A histogram showing the distribution is also included.
The worst midterm grade was received by a student who was absent the week prior to the exam due to illness. Should this grade be considered an outlier? Explain and support your reasoning. Be sure to state what you would do with this data value.
The worst midterm grade was received by a student who was absent the week prior to the exam due to illness. Should this grade be considered an outlier? Explain and support your reasoning. Be sure to state what you would do with this data value.
Unlock Deck
Unlock for access to all 60 flashcards in this deck.
Unlock Deck
k this deck
58
Use the following information to answer the question. The average snowfall for cities in Michigan is 71.6 inches with a standard deviation of 9.7 inches. Assume the distribution for annual snowfall is approximately unimodal and symmetrical.
What is the range of values for annual snowfall that would contain roughly 68% of the cities in Michigan? Round calculations to the nearest tenth.
What is the range of values for annual snowfall that would contain roughly 68% of the cities in Michigan? Round calculations to the nearest tenth.
Unlock Deck
Unlock for access to all 60 flashcards in this deck.
Unlock Deck
k this deck
59
Use the following information for the question. The boxplots below are from a Graphing Calulator. The boxplots summarize the cost in dollars of a typical evening out for two people (dinner and a movie)in two different cities in west Michigan, Muskegon (top boxplot)and Grand Rapids (bottom boxplot). The five- number summaries are also given for each city.
Brian and his significant other plan to visit west Michigan and eat out every night at a different restaurant. He wants to be careful about his budget. Based on the information provided, which city would be best for them to visit and why?
Brian and his significant other plan to visit west Michigan and eat out every night at a different restaurant. He wants to be careful about his budget. Based on the information provided, which city would be best for them to visit and why?
Unlock Deck
Unlock for access to all 60 flashcards in this deck.
Unlock Deck
k this deck
60
The average grade on an algebra exam was 76% with a standard deviation of 6 percentage points. The average grade on a chemistry exam was 81% with a standard deviation of 2 percentage points. Julie got a grade of 83% on both exams. Which exam did she do relatively better on? Show all work and round any calculations to the nearest hundredth.
Unlock Deck
Unlock for access to all 60 flashcards in this deck.
Unlock Deck
k this deck
Unlock Deck
Unlock for access to all 60 flashcards in this deck.


