Deck 4: Regression Analysis: Exploring Associations Between Variables
Full screen (f)
Question
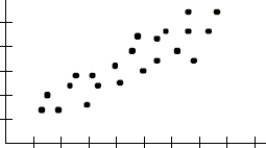
The scatterplot below shows the number of tackles received and the number of concussions received for a team of football players for the most recent season. Choose the statement that best describes the trend. 
A)There is no association between the number of tackles a team receives and the number of concussions.
B)Teams that receive a greater number of tackles tend to have a higher number of concussions.
C)Teams that receive a greater number of tackles tend to receive a lower number of concussions.
A)There is no association between the number of tackles a team receives and the number of concussions.
B)Teams that receive a greater number of tackles tend to have a higher number of concussions.
C)Teams that receive a greater number of tackles tend to receive a lower number of concussions.
Question
Suppose it has been established that "annual income" and "Years of college" are linearly related, and that the relationship can be modeled using the following equation: Annual Income = $23,400+$7200(Years of College). In this model, "Annual Income" is the
? variable, and "Years of College" is the ? variable. The two variables have a ? linear relationship.


A)Independent; Dependent; Positive
B)Independent; Dependent; Negative
C)Dependent; Independent; Negative
D)Dependent; Independent; Positive
? variable, and "Years of College" is the ? variable. The two variables have a ? linear relationship.
A)Independent; Dependent; Positive
B)Independent; Dependent; Negative
C)Dependent; Independent; Negative
D)Dependent; Independent; Positive
Question
The table shows the number of minutes ridden on a stationary bike and the approximate number of calories burned. Plot the points on the grid provided then choose the most likely correlation coefficient from the answer choices below. 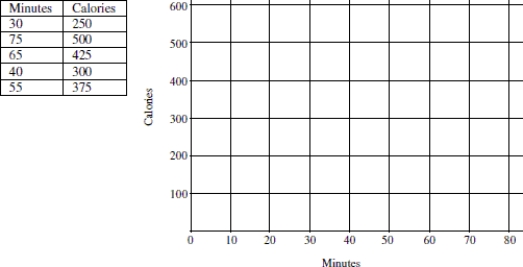
A)- 0.99
B)- 0.20
C)0.20
D)0.99
A)- 0.99
B)- 0.20
C)0.20
D)0.99
Question
Question
Doctors believe that smoking cigarettes inflames the bronchial tubes and so makes it harder to breathe. To test this they measured the lung capacity (in liters)and the number of cigarettes smoked in a typical day for a sample of adults. Is the scatterplot below consistent with the researcher's hypothesis? 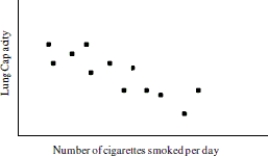
A)Yes, it is consistent.
B)There is no evidence in support or contradiction of the hypothesis.
C)No, it contradicts this hypothesis.
A)Yes, it is consistent.
B)There is no evidence in support or contradiction of the hypothesis.
C)No, it contradicts this hypothesis.
Question
Question
Question
A veterinarian is going to investigate whether homes with more pets tend to have more fleas. In this scenario, the explanatory variable is and the response variable is  .
.

A)Number of pets; number of fleas spotted in a period of time
B)Slope; intercept
C)Number of fleas spotted in a period of time; number of pets
D)None of these
.A)Number of pets; number of fleas spotted in a period of time
B)Slope; intercept
C)Number of fleas spotted in a period of time; number of pets
D)None of these
Question
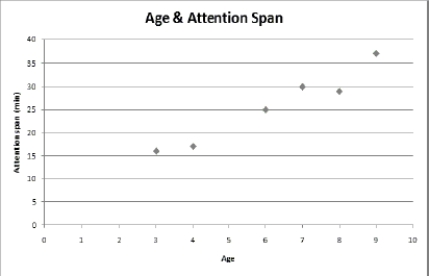
It is determined that a positive linear association exists between age (for children between the ages of 3 and 9 years)and attention span (measured in minutes). The scatterplot below shows the association. The prediction equation is also given. A college instructor uses the model to predict the attention span of the students in her class who have an average age of 29. Choose the best statement to summarize why this is not an appropriate use for the model. attention span = 4.68 + 3.40(age)
A)This is an inappropriate use of the model because the model was used to make predictions beyond the scope of the data. The college instructor is extrapolating.
B)This is an inappropriate use of the model because age does not cause attention span to increase. Correlation does not mean causation.
C)This is an inappropriate use of the model because a 29- year- old person would be an outlier in this context.
Question
Question
r = 0.8670
A)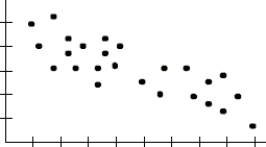
B)
C)
A)
B)
C)
Question
Question
The following calculator screenshots show the scatterplot and the correlation coefficient between car weight and car length for a sample of 2009 model year cars. 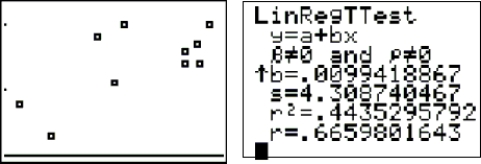 The relationship between "car length" and "car weight" can be described as
A)A moderate positive linear relationship
B)A strong positive linear relationship
C)A weak negative relationship
D)A strong negative linear relationship
The relationship between "car length" and "car weight" can be described asA)A moderate positive linear relationship
B)A strong positive linear relationship
C)A weak negative relationship
D)A strong negative linear relationship
Question
Question
The data in the table represent the amount of raw material (in tons)put into an injection molding machine each day (x), and the amount of scrap plastic (in tons)that is collected from the machine every four weeks (y). Also shown below are the outputs from two different statistical technologies (TI- 83/84 Calculator and Excel). A scatterplot of the data confirms that there is a linear association. Report the equation for predicting scrap from raw material using words such as scrap, not x and y. State the slope and intercept of the prediction equation. Round all calculations to the nearest hundredth. 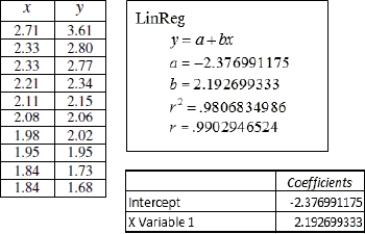
A)scrap = - 2.38 + 2.19(raw material); slope = 2.19 and the intercept is - 2.38.
B)scrap = 2.19 - 2.38(raw material); slope = - 2.38 and the intercept is 2.19.
C)scrap = 2.19 - 2.38(raw material); slope = 2.19 and the intercept is - 2.38.
D)scrap = - 2.38 + 2.19(raw material); slope = - 2.38 and the intercept is 2.19.
Question
r = - 0.3120
A)
B)

C)
A)
B)
C)
Question
Question
r = 0.8787
A)
B)

C)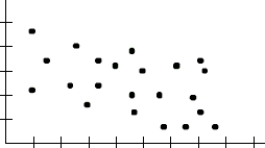
A)
B)
C)
Question
The following calculator screenshots show the scatterplot and the correlation coefficient between the number of days absent and the final grade for a sample of college students in a general education statistics course at a large community college. 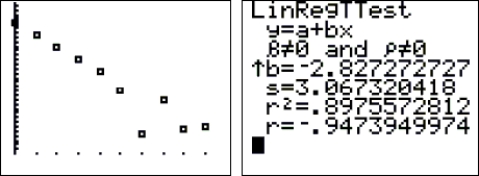 The relationship between "days absent" and "final grade" can be described as
A)A strong negative linear relationship
B)A strong positive linear relationship
C)A weak negative relationship
D)A moderate positive linear relationship
The relationship between "days absent" and "final grade" can be described asA)A strong negative linear relationship
B)A strong positive linear relationship
C)A weak negative relationship
D)A moderate positive linear relationship
Question
r = - 0.6542
A)
B)

C)
A)
B)
C)
Question
Question
Question
Question
Question
Question
The scatterplot below shows the hat size and IQ of some adults. Is the trend positive, negative, or near zero? 
A)Positive
B)Near Zero
C)Negative
A)Positive
B)Near Zero
C)Negative
Question
Use the following information to answer the question. The following linear regression model can be used to predict ticket sales at a popular water park.
Ticket sales per hour = - 631.25 + 11.25(current temperature in °F)
Choose the best statement to summarize the association shown between hat size and IQ in the scatterplot below.
A)The scatterplot does not show a trend that would indicate an association between hat size and IQ scores.
B)As hat size increases, IQ scores tend to increase.
C)Hat size causes IQ to increase.
D)As hat size increases, IQ scores tend to decrease.
Question
r = - 0.6542
A)
B)

C)
A)
B)
C)
Question
The scatterplot below shows the number of tackles received and the number of concussions received for a team of football players for the most recent season. Choose the statement that best describes the trend. 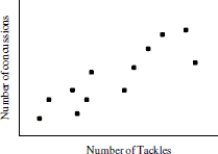
A)Teams that receive a greater number of tackles tend to have a higher number of concussions.
B)There is no association between the number of tackles a team receives and the number of concussions.
C)Teams that receive a greater number of tackles tend to receive a lower number of concussions.
A)Teams that receive a greater number of tackles tend to have a higher number of concussions.
B)There is no association between the number of tackles a team receives and the number of concussions.
C)Teams that receive a greater number of tackles tend to receive a lower number of concussions.
Question
Doctors hypothesize that smoking cigarettes inflames the bronchial tubes and so makes it harder to breathe. To test this they measured the lung capacity (in liters)and the number of cigarettes smoked in a typical day for a sample of adults. Is the scatterplot below consistent with the researcher's hypothesis? 
A)No, it contradicts this hypothesis.
B)There is no evidence in support or contradiction of the hypothesis.
C)Yes, it is consistent.
A)No, it contradicts this hypothesis.
B)There is no evidence in support or contradiction of the hypothesis.
C)Yes, it is consistent.
Question
A concert ticket agent is going to investigate whether an increase in money spent on radio advertisements for a particular venue tends to lead to more concert ticket sales. In this scenario, the response variable is and the explanatory variable is . 

A)Slope; intercept
B)Amount of radio advertisement money spent; concert ticket sales
C)Concert ticket sales; amount of radio advertisement money spent
D)None of these
A)Slope; intercept
B)Amount of radio advertisement money spent; concert ticket sales
C)Concert ticket sales; amount of radio advertisement money spent
D)None of these
Question
The scatterplot below shows the hat size and IQ of some adults. Is the trend positive, negative, or near zero? 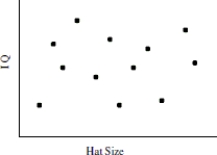
A)Negative
B)Positive
C)Near Zero
A)Negative
B)Positive
C)Near Zero
Question
Question
Question
r = - 0.3526
A)
B)

C)
A)
B)
C)
Question
The table shows the number of minutes ridden on a stationary bike and the approximate number of calories burned. Plot the points on the grid provided then choose the most likely correlation coefficient from the answer choices below. 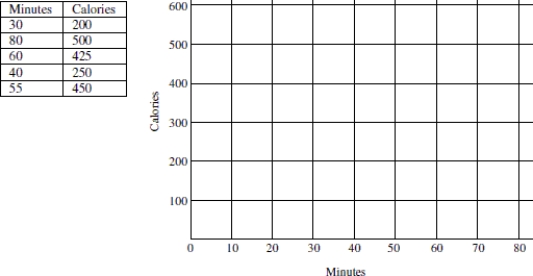
A)- 0.30
B)0.99
C)0.30
D)- 0.99
A)- 0.30
B)0.99
C)0.30
D)- 0.99
Question
Suppose it has been established that "home value" and "Years of college" are linearly related, and that the relationship can be modeled using the following equation: Home value = $75,000+$12,500(Years of College). In this model, "years of college" is the
? variable, and "home value" is the ? variable. The two variables have a ? .


A)Independent; Dependent; Positive
B)Dependent; Independent; Positive
C)Independent; Dependent; Negative
D)Dependent; Independent; Negative
? variable, and "home value" is the ? variable. The two variables have a ? .
A)Independent; Dependent; Positive
B)Dependent; Independent; Positive
C)Independent; Dependent; Negative
D)Dependent; Independent; Negative
Question
The data in the table represent the amount of pressure (psi)exerted by a stamping machine (x), and the amount of scrap brass shavings (in pounds)that are collected from the machine each hour (y). Also shown below are the outputs from two different statistical technologies (TI- 83/84 Calculator and Excel). A scatterplot of the data confirms that there is a linear association. Report the equation for predicting scrap brass shavings using words such as scrap, not x and y. State the slope and intercept of the prediction equation. Round all calculations to the nearest thousandth. 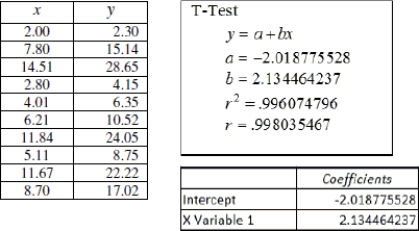
A)scrap = - 2.019 + 2.134(pressure); slope = - 2.019 and the intercept is 2.134.
B)scrap = 2.134 - 2.019(pressure); slope = - 2.019 and the intercept is 2.134.
C)scrap = - 2.019 + 2.134(pressure); slope = 2.134 and the intercept is - 2.019.
D)scrap = 2.134 - 2.019(pressure); slope = 2.134 and the intercept is - 2.019.
Question
Question
Question
Use the data provided in the table below to answer the question. The table shows city size and annual grocery expenditures for eight families. City size is in thousands and expenditures is in hundreds of dollars.
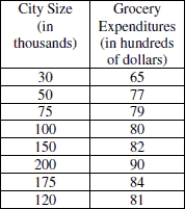
Suppose each of these families is given a grocery credit of $100, therefore reducing expenditures in the table by one unit (since this variable was recorded in hundreds of dollars). Estimate the new correlation with city size. What happens to the correlation when a constant is added (in this case - 100 dollars is added to each number)? Explain your reasoning.
Suppose each of these families is given a grocery credit of $100, therefore reducing expenditures in the table by one unit (since this variable was recorded in hundreds of dollars). Estimate the new correlation with city size. What happens to the correlation when a constant is added (in this case - 100 dollars is added to each number)? Explain your reasoning.
Question
Question
Question
Use the following information to answer the question. A scatterplot of data from a large sample of adult women shows that height in inches and weight in pounds have a linear association. Shown below are the outputs from two different statistical technologies (TI- 83/84 Calculator and Excel).
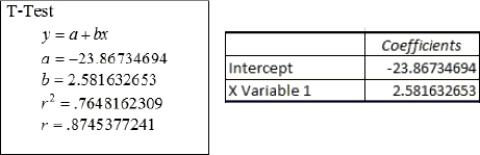
Height and weight charts for women show that a woman who is 71 inches tall has a target weight between 135 and 176 pounds. Would the regression model you found for the large sample of (in question 15)place a woman who was 71 inches tall within this range?
Height and weight charts for women show that a woman who is 71 inches tall has a target weight between 135 and 176 pounds. Would the regression model you found for the large sample of (in question 15)place a woman who was 71 inches tall within this range?
Question
Question
Question
Use the data provided in the table below to answer the question. The table shows city size and annual grocery expenditures for eight families. City size is in thousands and expenditures is in hundreds of dollars.

Using the data from the table, sketch a scatterplot (by hand or with the aid of technology)of the data. Describe any association that you see. Would it be appropriate to fit a linear model to this data?
Using the data from the table, sketch a scatterplot (by hand or with the aid of technology)of the data. Describe any association that you see. Would it be appropriate to fit a linear model to this data?
Question
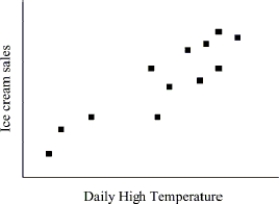
The scatterplot below shows the ice cream sales and daily high temperatures for a three week period of time during the summer. Does there appear to be an association between these two variables? If so, describe the pattern. Be sure to comment on trend, shape, and the strength of the association.
Question
Question
Question
Question
Use the following information to answer the question. A scatterplot of data from a large sample of adult women shows that height in inches and weight in pounds have a linear association. Shown below are the outputs from two different statistical technologies (TI- 83/84 Calculator and Excel).

Report the equation for predicting weight in pounds from height in inches using words such as weight, not x and y.
Report the equation for predicting weight in pounds from height in inches using words such as weight, not x and y.
Question
Question
Question
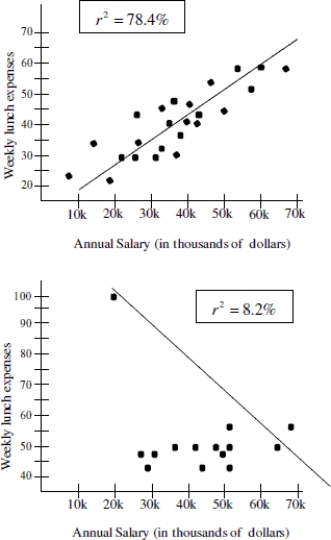
The figures below show the relationship between salary and personal lunch expenses on week days for a group of business men. Comment on the difference in graphs and in the coefficient of determination between the graph that includes a data point of someone who reported earnings of $21,000 per year and weekly personal lunch expenses of $100 per week (second graph)and the graph that did not include this data point (first graph).
Question
Use the data provided in the table below to answer the question. The table shows city size and annual grocery expenditures for eight families. City size is in thousands and expenditures is in hundreds of dollars.

Based on the scatterplots below, what is the better predictor for head circumference-- height or shoulder width? Explain how you made your decision.
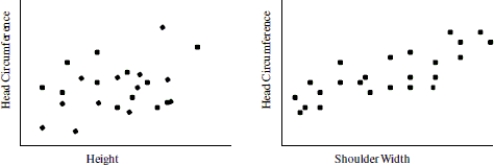
Based on the scatterplots below, what is the better predictor for head circumference-- height or shoulder width? Explain how you made your decision.
Question
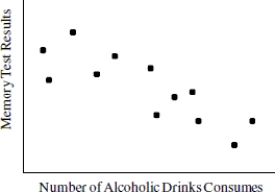
The scatterplot below shows the number of alcoholic drinks consumed and memory test results for some college students. Is there an association? If so, describe the pattern. Be sure to comment on trend, shape, and the strength of the association.
Question
Question
Question
Use the data provided in the table below to answer the question. The table shows city size and annual grocery expenditures for eight families. City size is in thousands and expenditures is in hundreds of dollars.
Based on the scatterplot, estimate the correlation coefficient between city size and expenditures for these eight families. Explain your reasons for choosing your estimate.
Based on the scatterplot, estimate the correlation coefficient between city size and expenditures for these eight families. Explain your reasons for choosing your estimate.

Unlock Deck
Sign up to unlock the cards in this deck!
Unlock Deck
Unlock Deck
1/60
Play
Full screen (f)
Deck 4: Regression Analysis: Exploring Associations Between Variables
1
The scatterplot below shows the number of tackles received and the number of concussions received for a team of football players for the most recent season. Choose the statement that best describes the trend.
A)There is no association between the number of tackles a team receives and the number of concussions.
B)Teams that receive a greater number of tackles tend to have a higher number of concussions.
C)Teams that receive a greater number of tackles tend to receive a lower number of concussions.
A)There is no association between the number of tackles a team receives and the number of concussions.
B)Teams that receive a greater number of tackles tend to have a higher number of concussions.
C)Teams that receive a greater number of tackles tend to receive a lower number of concussions.
Teams that receive a greater number of tackles tend to have a higher number of concussions.
2
Suppose it has been established that "annual income" and "Years of college" are linearly related, and that the relationship can be modeled using the following equation: Annual Income = $23,400+$7200(Years of College). In this model, "Annual Income" is the
? variable, and "Years of College" is the ? variable. The two variables have a ? linear relationship.
A)Independent; Dependent; Positive
B)Independent; Dependent; Negative
C)Dependent; Independent; Negative
D)Dependent; Independent; Positive
? variable, and "Years of College" is the ? variable. The two variables have a ? linear relationship.
A)Independent; Dependent; Positive
B)Independent; Dependent; Negative
C)Dependent; Independent; Negative
D)Dependent; Independent; Positive
Dependent; Independent; Positive
3
The table shows the number of minutes ridden on a stationary bike and the approximate number of calories burned. Plot the points on the grid provided then choose the most likely correlation coefficient from the answer choices below.
A)- 0.99
B)- 0.20
C)0.20
D)0.99
A)- 0.99
B)- 0.20
C)0.20
D)0.99
0.99
4
Use the following information to answer the question. The following linear regression model can be used to predict ticket sales at a popular water park.
Ticket sales per hour = - 631.25 + 11.25(current temperature in °F)
What is the predicted number of tickets sold per hour if the temperature is 86°F? Round to the nearest whole ticket.
A)About 252 tickets
B)About 276 tickets
C)About 336 tickets
D)About 301 tickets
Ticket sales per hour = - 631.25 + 11.25(current temperature in °F)
What is the predicted number of tickets sold per hour if the temperature is 86°F? Round to the nearest whole ticket.
A)About 252 tickets
B)About 276 tickets
C)About 336 tickets
D)About 301 tickets
Unlock Deck
Unlock for access to all 60 flashcards in this deck.
Unlock Deck
k this deck
5
Doctors believe that smoking cigarettes inflames the bronchial tubes and so makes it harder to breathe. To test this they measured the lung capacity (in liters)and the number of cigarettes smoked in a typical day for a sample of adults. Is the scatterplot below consistent with the researcher's hypothesis?
A)Yes, it is consistent.
B)There is no evidence in support or contradiction of the hypothesis.
C)No, it contradicts this hypothesis.
A)Yes, it is consistent.
B)There is no evidence in support or contradiction of the hypothesis.
C)No, it contradicts this hypothesis.
Unlock Deck
Unlock for access to all 60 flashcards in this deck.
Unlock Deck
k this deck
6
Use the following information to answer the question. The following linear regression model can be used to predict ticket sales at a popular water park.
Ticket sales per hour = - 631.25 + 11.25(current temperature in °F)
Choose the statement that best states the meaning of the slope in this context.
A)The slope tells us that a one degree increase in temperature is associated with an average increase in ticket sales of 11.25 tickets.
B)The slope tells us that if ticket sales are decreasing there must have been a drop in temperature.
C)The slope tells us that high temperatures are causing more people to buy tickets to the water park.
D)None of these
Unlock Deck
Unlock for access to all 60 flashcards in this deck.
Unlock Deck
k this deck
7
What key things should you look for when examining the potential linear association between two variables?
A)A noticeable overall linear shape on the scatterplot.
B)The vertical spread of the points on the scatterplot which indicate the strength of an association.
C)A noticeable positive or negative trend on the scatterplot.
D)All of these.
A)A noticeable overall linear shape on the scatterplot.
B)The vertical spread of the points on the scatterplot which indicate the strength of an association.
C)A noticeable positive or negative trend on the scatterplot.
D)All of these.
Unlock Deck
Unlock for access to all 60 flashcards in this deck.
Unlock Deck
k this deck
8
A veterinarian is going to investigate whether homes with more pets tend to have more fleas. In this scenario, the explanatory variable is and the response variable is .
A)Number of pets; number of fleas spotted in a period of time
B)Slope; intercept
C)Number of fleas spotted in a period of time; number of pets
D)None of these
.A)Number of pets; number of fleas spotted in a period of time
B)Slope; intercept
C)Number of fleas spotted in a period of time; number of pets
D)None of these
Unlock Deck
Unlock for access to all 60 flashcards in this deck.
Unlock Deck
k this deck
9
It is determined that a positive linear association exists between age (for children between the ages of 3 and 9 years)and attention span (measured in minutes). The scatterplot below shows the association. The prediction equation is also given. A college instructor uses the model to predict the attention span of the students in her class who have an average age of 29. Choose the best statement to summarize why this is not an appropriate use for the model. attention span = 4.68 + 3.40(age)
A)This is an inappropriate use of the model because the model was used to make predictions beyond the scope of the data. The college instructor is extrapolating.
B)This is an inappropriate use of the model because age does not cause attention span to increase. Correlation does not mean causation.
C)This is an inappropriate use of the model because a 29- year- old person would be an outlier in this context.
A)This is an inappropriate use of the model because the model was used to make predictions beyond the scope of the data. The college instructor is extrapolating.
B)This is an inappropriate use of the model because age does not cause attention span to increase. Correlation does not mean causation.
C)This is an inappropriate use of the model because a 29- year- old person would be an outlier in this context.
Unlock Deck
Unlock for access to all 60 flashcards in this deck.
Unlock Deck
k this deck
10
Use the following information to answer the question. The following linear regression model can be used to predict ticket sales at a popular water park.
Ticket sales per hour = - 631.25 + 11.25(current temperature in °F)
In this context, does the intercept have a reasonable interpretation?
A)Not enough information available
B)No, at a temperature of 0°F, ticket sales would be - 631.25 and it is not reasonable (or possible)to have negative ticket sales.
C)Yes, it is reasonable for people to go to a water park when it is 0°F, so park managers might want to know how many tickets they would sell on average on a 0°F day.
Unlock Deck
Unlock for access to all 60 flashcards in this deck.
Unlock Deck
k this deck
11
r = 0.8670
A)
B)
C)
A)
B)
C)
Unlock Deck
Unlock for access to all 60 flashcards in this deck.
Unlock Deck
k this deck
12
It is determined that a positive linear association exists between amount of a new smoking cessation drug taken (in milliliters)and weight gain in women (in pounds). The scatterplot below shows the association. The prediction equation is also given. A pharmacy technician uses the model to predict the potential weight gain for a man who takes the recommended dosage. Choose the best statement to summarize why this is not an appropriate use for the model.
A)This is an inappropriate use of the model because taking the smoking cessation drug does not cause weight gain. Correlation does not mean causation.
B)This is an inappropriate use of the model because a man would be an outlier in this context.
C)This is an inappropriate use of the model because the model was used to make predictions beyond the scope of the data. The Pharmecy Technician is extrapolating.
Unlock Deck
Unlock for access to all 60 flashcards in this deck.
Unlock Deck
k this deck
13
The following calculator screenshots show the scatterplot and the correlation coefficient between car weight and car length for a sample of 2009 model year cars. The relationship between "car length" and "car weight" can be described as
A)A moderate positive linear relationship
B)A strong positive linear relationship
C)A weak negative relationship
D)A strong negative linear relationship
The relationship between "car length" and "car weight" can be described asA)A moderate positive linear relationship
B)A strong positive linear relationship
C)A weak negative relationship
D)A strong negative linear relationship
Unlock Deck
Unlock for access to all 60 flashcards in this deck.
Unlock Deck
k this deck
14
Which of the following statements regarding the correlation coefficient is not true?
A)The correlation coefficient measures the strength of the linear relationship between two numerical variables.
B)A value of 0.00 indicates that two variables are perfectly linearly correlated.
C)The correlation coefficient has values that range from - 1.0 to 1.0 inclusive.
D)All of these are true statements.
Unlock Deck
Unlock for access to all 60 flashcards in this deck.
Unlock Deck
k this deck
15
The data in the table represent the amount of raw material (in tons)put into an injection molding machine each day (x), and the amount of scrap plastic (in tons)that is collected from the machine every four weeks (y). Also shown below are the outputs from two different statistical technologies (TI- 83/84 Calculator and Excel). A scatterplot of the data confirms that there is a linear association. Report the equation for predicting scrap from raw material using words such as scrap, not x and y. State the slope and intercept of the prediction equation. Round all calculations to the nearest hundredth.
A)scrap = - 2.38 + 2.19(raw material); slope = 2.19 and the intercept is - 2.38.
B)scrap = 2.19 - 2.38(raw material); slope = - 2.38 and the intercept is 2.19.
C)scrap = 2.19 - 2.38(raw material); slope = 2.19 and the intercept is - 2.38.
D)scrap = - 2.38 + 2.19(raw material); slope = - 2.38 and the intercept is 2.19.
Unlock Deck
Unlock for access to all 60 flashcards in this deck.
Unlock Deck
k this deck
16
r = - 0.3120
A)
B)
C)
A)
B)
C)
Unlock Deck
Unlock for access to all 60 flashcards in this deck.
Unlock Deck
k this deck
17
The following model was created to show the association between the number of massages received per month and self- predicted stress level: Stress level = 10 - 0.02(number of massages per month). The coefficient of determination for the model is 0.066 or 6.6%. Choose the true statement regarding this model.
A)The model shows that getting even one massage a month will decrease your stress level.
B)The model shows that there is a negative association between stress level and number of monthly massages, but the relatively small coefficient of determination suggests that very little of the variation is explained by the model, so the model is probably not very good at predicting stress level.
C)The model shows that on average a person getting no massages will always have a stress level of 10.
D)All of these are true statements.
Unlock Deck
Unlock for access to all 60 flashcards in this deck.
Unlock Deck
k this deck
18
r = 0.8787
A)
B)
C)
A)
B)
C)
Unlock Deck
Unlock for access to all 60 flashcards in this deck.
Unlock Deck
k this deck
19
The following calculator screenshots show the scatterplot and the correlation coefficient between the number of days absent and the final grade for a sample of college students in a general education statistics course at a large community college. The relationship between "days absent" and "final grade" can be described as
A)A strong negative linear relationship
B)A strong positive linear relationship
C)A weak negative relationship
D)A moderate positive linear relationship
The relationship between "days absent" and "final grade" can be described asA)A strong negative linear relationship
B)A strong positive linear relationship
C)A weak negative relationship
D)A moderate positive linear relationship
Unlock Deck
Unlock for access to all 60 flashcards in this deck.
Unlock Deck
k this deck
20
r = - 0.6542
A)
B)
C)
A)
B)
C)
Unlock Deck
Unlock for access to all 60 flashcards in this deck.
Unlock Deck
k this deck
21
Which of the following statements regarding the correlation coefficient is not true?
A)The correlation coefficient has values that range from - 1.0 to 1.0 inclusive.
B)A correlation coefficient value of 0.00 indicates that two variables have no linear correlation at all.
C)The correlation coefficient measures the strength of the linear relationship between two numerical variables.
D)All of these are true statements.
Unlock Deck
Unlock for access to all 60 flashcards in this deck.
Unlock Deck
k this deck
22
In the NHL, the correlation between "Goals scored per game" and "minutes on the ice" for a team of players is found to be 0.8178. Choose the statement that is true about the coefficient of determination.
A)When given as a percent, the coefficient of determination is always between 0 and 100%.
B)The coefficient of determination states that about 66.88% of the variation in goals scored per game is explained by minutes on the ice.
C)The coefficient of determination, r2, is equal to approximately 0.6688.
D)All of these are true statements.
Unlock Deck
Unlock for access to all 60 flashcards in this deck.
Unlock Deck
k this deck
23
A horticulturist conducted an experiment on 110 thirty- six inch plant boxes to see if the amount of plant food given to the plant boxes was associated with the number of tomatoes harvested from the plants. The average amount of plant food given was 27.8 milliliters with a standard deviation of 2.1 milliliters. The average number of tomatoes harvested was 7.5 with a standard deviation of 1.5. The correlation coefficient was 0.7691. Use the information to calculate the slope of the linear model that predicts the number of tomatoes harvested from the amount of plant food given. Show your work and round to the nearest hundredth.
A)1.08
B)0.55
C)- 7.50
D)The slope cannot be determined without the actual data.
A)1.08
B)0.55
C)- 7.50
D)The slope cannot be determined without the actual data.
Unlock Deck
Unlock for access to all 60 flashcards in this deck.
Unlock Deck
k this deck
24
A horticulturist conducted an experiment on 140 thirty- six inch plant boxes to see if the amount of plant food given to the plant boxes was associated with the number of habanera peppers harvested from the plants. The average amount of plant food given was 17.8 milliliters with a standard deviation of 0.7 milliliters. The average number of habanera peppers harvested was 6.5 with a standard deviation of 1.5. The correlation coefficient was 0.8123. Use the information to calculate the slope of the linear model that predicts the number of habanera peppers harvested from the amount of plant food given. Show your work and round to the nearest hundredth.
A)1.74
B)The slope cannot be determined without the actual data.
C)0.38
D)- 1.50
A)1.74
B)The slope cannot be determined without the actual data.
C)0.38
D)- 1.50
Unlock Deck
Unlock for access to all 60 flashcards in this deck.
Unlock Deck
k this deck
25
Use the following information to answer the question. The following linear regression model can be used to predict ticket sales at a popular water park.
Ticket sales per hour = - 631.25 + 11.25(current temperature in °F)
What is the predicted number of tickets sold per hour if the temperature is 79°F? Round to the nearest whole ticket.
A)About 257 tickets
B)About 310 tickets
C)About 250 tickets
D)About 258 tickets
Ticket sales per hour = - 631.25 + 11.25(current temperature in °F)
What is the predicted number of tickets sold per hour if the temperature is 79°F? Round to the nearest whole ticket.
A)About 257 tickets
B)About 310 tickets
C)About 250 tickets
D)About 258 tickets
Unlock Deck
Unlock for access to all 60 flashcards in this deck.
Unlock Deck
k this deck
26
The scatterplot below shows the hat size and IQ of some adults. Is the trend positive, negative, or near zero?
A)Positive
B)Near Zero
C)Negative
A)Positive
B)Near Zero
C)Negative
Unlock Deck
Unlock for access to all 60 flashcards in this deck.
Unlock Deck
k this deck
27
Use the following information to answer the question. The following linear regression model can be used to predict ticket sales at a popular water park.
Ticket sales per hour = - 631.25 + 11.25(current temperature in °F)
Choose the best statement to summarize the association shown between hat size and IQ in the scatterplot below.
A)The scatterplot does not show a trend that would indicate an association between hat size and IQ scores.
B)As hat size increases, IQ scores tend to increase.
C)Hat size causes IQ to increase.
D)As hat size increases, IQ scores tend to decrease.
Unlock Deck
Unlock for access to all 60 flashcards in this deck.
Unlock Deck
k this deck
28
r = - 0.6542
A)
B)
C)
A)
B)
C)
Unlock Deck
Unlock for access to all 60 flashcards in this deck.
Unlock Deck
k this deck
29
The scatterplot below shows the number of tackles received and the number of concussions received for a team of football players for the most recent season. Choose the statement that best describes the trend.
A)Teams that receive a greater number of tackles tend to have a higher number of concussions.
B)There is no association between the number of tackles a team receives and the number of concussions.
C)Teams that receive a greater number of tackles tend to receive a lower number of concussions.
A)Teams that receive a greater number of tackles tend to have a higher number of concussions.
B)There is no association between the number of tackles a team receives and the number of concussions.
C)Teams that receive a greater number of tackles tend to receive a lower number of concussions.
Unlock Deck
Unlock for access to all 60 flashcards in this deck.
Unlock Deck
k this deck
30
Doctors hypothesize that smoking cigarettes inflames the bronchial tubes and so makes it harder to breathe. To test this they measured the lung capacity (in liters)and the number of cigarettes smoked in a typical day for a sample of adults. Is the scatterplot below consistent with the researcher's hypothesis?
A)No, it contradicts this hypothesis.
B)There is no evidence in support or contradiction of the hypothesis.
C)Yes, it is consistent.
A)No, it contradicts this hypothesis.
B)There is no evidence in support or contradiction of the hypothesis.
C)Yes, it is consistent.
Unlock Deck
Unlock for access to all 60 flashcards in this deck.
Unlock Deck
k this deck
31
A concert ticket agent is going to investigate whether an increase in money spent on radio advertisements for a particular venue tends to lead to more concert ticket sales. In this scenario, the response variable is and the explanatory variable is .
A)Slope; intercept
B)Amount of radio advertisement money spent; concert ticket sales
C)Concert ticket sales; amount of radio advertisement money spent
D)None of these
A)Slope; intercept
B)Amount of radio advertisement money spent; concert ticket sales
C)Concert ticket sales; amount of radio advertisement money spent
D)None of these
Unlock Deck
Unlock for access to all 60 flashcards in this deck.
Unlock Deck
k this deck
32
The scatterplot below shows the hat size and IQ of some adults. Is the trend positive, negative, or near zero?
A)Negative
B)Positive
C)Near Zero
A)Negative
B)Positive
C)Near Zero
Unlock Deck
Unlock for access to all 60 flashcards in this deck.
Unlock Deck
k this deck
33
Use the following information to answer the question. The following linear regression model can be used to predict ticket sales at a popular water park.
Ticket sales per hour = - 631.25 + 11.25(current temperature in °F)
Choose the statement that best states the meaning of the slope in this context.
A)The slope tells us that if ticket sales are decreasing there must have been a drop in temperature.
B)The slope tells us that high temperatures are causing more people to buy tickets to the water park.
C)The slope tells us that a one degree increase in temperature is associated with an average increase in ticket sales of 11.25 tickets.
D)None of these
Unlock Deck
Unlock for access to all 60 flashcards in this deck.
Unlock Deck
k this deck
34
The following model was created to show the association between the number of massages received per month and self- predicted stress level: Stress level = 10 - 0.02(number of massages per month). The coefficient of determination for the model is 0.066 or 6.6%. Choose the true statement regarding this model.
A)The model shows that there is a negative association between stress level and number of monthly massages, but the relatively small coefficient of determination suggests that very little of the variation is explained by the model, so the model is probably not very good at predicting stress level.
B)The model shows that on average a person getting no massages will always have a stress level of 10.
C)The model shows that getting even one massage a month will decrease your stress level.
D)None of these.
Unlock Deck
Unlock for access to all 60 flashcards in this deck.
Unlock Deck
k this deck
35
r = - 0.3526
A)
B)
C)
A)
B)
C)
Unlock Deck
Unlock for access to all 60 flashcards in this deck.
Unlock Deck
k this deck
36
The table shows the number of minutes ridden on a stationary bike and the approximate number of calories burned. Plot the points on the grid provided then choose the most likely correlation coefficient from the answer choices below.
A)- 0.30
B)0.99
C)0.30
D)- 0.99
A)- 0.30
B)0.99
C)0.30
D)- 0.99
Unlock Deck
Unlock for access to all 60 flashcards in this deck.
Unlock Deck
k this deck
37
Suppose it has been established that "home value" and "Years of college" are linearly related, and that the relationship can be modeled using the following equation: Home value = $75,000+$12,500(Years of College). In this model, "years of college" is the
? variable, and "home value" is the ? variable. The two variables have a ? .
A)Independent; Dependent; Positive
B)Dependent; Independent; Positive
C)Independent; Dependent; Negative
D)Dependent; Independent; Negative
? variable, and "home value" is the ? variable. The two variables have a ? .
A)Independent; Dependent; Positive
B)Dependent; Independent; Positive
C)Independent; Dependent; Negative
D)Dependent; Independent; Negative
Unlock Deck
Unlock for access to all 60 flashcards in this deck.
Unlock Deck
k this deck
38
The data in the table represent the amount of pressure (psi)exerted by a stamping machine (x), and the amount of scrap brass shavings (in pounds)that are collected from the machine each hour (y). Also shown below are the outputs from two different statistical technologies (TI- 83/84 Calculator and Excel). A scatterplot of the data confirms that there is a linear association. Report the equation for predicting scrap brass shavings using words such as scrap, not x and y. State the slope and intercept of the prediction equation. Round all calculations to the nearest thousandth.
A)scrap = - 2.019 + 2.134(pressure); slope = - 2.019 and the intercept is 2.134.
B)scrap = 2.134 - 2.019(pressure); slope = - 2.019 and the intercept is 2.134.
C)scrap = - 2.019 + 2.134(pressure); slope = 2.134 and the intercept is - 2.019.
D)scrap = 2.134 - 2.019(pressure); slope = 2.134 and the intercept is - 2.019.
Unlock Deck
Unlock for access to all 60 flashcards in this deck.
Unlock Deck
k this deck
39
Use the following information to answer the question. The following linear regression model can be used to predict ticket sales at a popular water park.
Ticket sales per hour = - 631.25 + 11.25(current temperature in °F)
In the NBA, the correlation between "steals per game" and "blocked shots per game" is found to be 0.8045. Choose the statement that is true about the coefficient of determination.
A)The coefficient of determination states that about 64.72% of the variation in blocked shots per game is explained by steals per game.
B)The coefficient of determination, r2, is equal to approximately 0.6472.
C)When given as a percent, the coefficient of determination is always between 0 and 100%.
D)All of these are true statements.
Unlock Deck
Unlock for access to all 60 flashcards in this deck.
Unlock Deck
k this deck
40
Use the following information to answer the question. The following linear regression model can be used to predict ticket sales at a popular water park.
Ticket sales per hour = - 631.25 + 11.25(current temperature in °F)
In this context, does the intercept have a reasonable interpretation?
A)No, at a temperature of 0°F, ticket sales would be - 631.25 and it is not reasonable (or possible)to have negative ticket sales.
B)Not enough information available
C)Yes, it is reasonable for people to go to a water park when it is 0°F, so park managers might want to know how many tickets they would sell on average on a 0°F day.
Unlock Deck
Unlock for access to all 60 flashcards in this deck.
Unlock Deck
k this deck
41
Use the data provided in the table below to answer the question. The table shows city size and annual grocery expenditures for eight families. City size is in thousands and expenditures is in hundreds of dollars.
Suppose each of these families is given a grocery credit of $100, therefore reducing expenditures in the table by one unit (since this variable was recorded in hundreds of dollars). Estimate the new correlation with city size. What happens to the correlation when a constant is added (in this case - 100 dollars is added to each number)? Explain your reasoning.
Suppose each of these families is given a grocery credit of $100, therefore reducing expenditures in the table by one unit (since this variable was recorded in hundreds of dollars). Estimate the new correlation with city size. What happens to the correlation when a constant is added (in this case - 100 dollars is added to each number)? Explain your reasoning.
Unlock Deck
Unlock for access to all 60 flashcards in this deck.
Unlock Deck
k this deck
42
The following regression equation was found to model commute distance (in miles)and number of minor accidents per year for a group of adults.
Minor accidents per year = 1.204 + 0.024(commute distance)
What is the intercept? What is the interpretation of the intercept in this context? Does it make sense to interpret the intercept in this context?
Minor accidents per year = 1.204 + 0.024(commute distance)
What is the intercept? What is the interpretation of the intercept in this context? Does it make sense to interpret the intercept in this context?
Unlock Deck
Unlock for access to all 60 flashcards in this deck.
Unlock Deck
k this deck
43
Explain in your own words what extrapolation is and give an example. Why should extrapolation be avoided when doing regression analysis?
Unlock Deck
Unlock for access to all 60 flashcards in this deck.
Unlock Deck
k this deck
44
Use the following information to answer the question. A scatterplot of data from a large sample of adult women shows that height in inches and weight in pounds have a linear association. Shown below are the outputs from two different statistical technologies (TI- 83/84 Calculator and Excel).
Height and weight charts for women show that a woman who is 71 inches tall has a target weight between 135 and 176 pounds. Would the regression model you found for the large sample of (in question 15)place a woman who was 71 inches tall within this range?
Height and weight charts for women show that a woman who is 71 inches tall has a target weight between 135 and 176 pounds. Would the regression model you found for the large sample of (in question 15)place a woman who was 71 inches tall within this range?
Unlock Deck
Unlock for access to all 60 flashcards in this deck.
Unlock Deck
k this deck
45
State the explanatory variable and the response variable.
Unlock Deck
Unlock for access to all 60 flashcards in this deck.
Unlock Deck
k this deck
46
If the correlation between whole milk content per serving and calories per serving for several brands of ice cream is 0.71, report the coefficient of determination (rounded to the nearest tenth of a percent)and explain what it means using a complete sentence. Assume that whole milk content is the predictor and calories per serving is the response, and assume that the association between whole milk content and calories is linear.
Unlock Deck
Unlock for access to all 60 flashcards in this deck.
Unlock Deck
k this deck
47
Use the data provided in the table below to answer the question. The table shows city size and annual grocery expenditures for eight families. City size is in thousands and expenditures is in hundreds of dollars.
Using the data from the table, sketch a scatterplot (by hand or with the aid of technology)of the data. Describe any association that you see. Would it be appropriate to fit a linear model to this data?
Using the data from the table, sketch a scatterplot (by hand or with the aid of technology)of the data. Describe any association that you see. Would it be appropriate to fit a linear model to this data?
Unlock Deck
Unlock for access to all 60 flashcards in this deck.
Unlock Deck
k this deck
48
The scatterplot below shows the ice cream sales and daily high temperatures for a three week period of time during the summer. Does there appear to be an association between these two variables? If so, describe the pattern. Be sure to comment on trend, shape, and the strength of the association.
Unlock Deck
Unlock for access to all 60 flashcards in this deck.
Unlock Deck
k this deck
49
The following regression equation was found to model commute distance (in miles)and number of minor accidents per year for a group of adults.
Minor accidents per year = 1.204 + 0.024(commute distance)Identify the independent variable and the dependent variable.
Minor accidents per year = 1.204 + 0.024(commute distance)Identify the independent variable and the dependent variable.
Unlock Deck
Unlock for access to all 60 flashcards in this deck.
Unlock Deck
k this deck
50
Use the regression equation to predict how many children a married couple will have if they live in city with a population of 40,000 people.
Unlock Deck
Unlock for access to all 60 flashcards in this deck.
Unlock Deck
k this deck
51
A horticulturist conducted an experiment on 120 thirty- six inch flower boxes to see if the amount of plant food given to the flower boxes was associated with the number of blooms on the plants. The average amount of plant food given was 31.6 milliliters with a standard deviation of 2.2 milliliters. The average number of blooms was 10.5 with a standard deviation of 1.5. The correlation coefficient was 0.8891. Use the information to calculate the slope of the linear model that predicts the number of blooms from the amount of plant food given. Show your work and round to the nearest hundredth. Write a sentence explaining the meaning of the slope in this context.
Unlock Deck
Unlock for access to all 60 flashcards in this deck.
Unlock Deck
k this deck
52
Use the following information to answer the question. A scatterplot of data from a large sample of adult women shows that height in inches and weight in pounds have a linear association. Shown below are the outputs from two different statistical technologies (TI- 83/84 Calculator and Excel).
Report the equation for predicting weight in pounds from height in inches using words such as weight, not x and y.
Report the equation for predicting weight in pounds from height in inches using words such as weight, not x and y.
Unlock Deck
Unlock for access to all 60 flashcards in this deck.
Unlock Deck
k this deck
53
State the slope and intercept of the regression line and explain each in context. Be sure to explain whether the intercept has a practical meaning in this context.
Unlock Deck
Unlock for access to all 60 flashcards in this deck.
Unlock Deck
k this deck
54
Suppose that environmentalists monitor algae levels in a river and determine that there is a linear association between local rainfall and algae levels. The determine that the best fitting linear model to predict algae cell counts per milliliter from rainfall in inches is:
Algae cell count = 229.32 + 79.81(Rainfall in inches)with r2 = 0.604 How will a rainfall that is 3 inches above average affect the algae cell count?
Algae cell count = 229.32 + 79.81(Rainfall in inches)with r2 = 0.604 How will a rainfall that is 3 inches above average affect the algae cell count?
Unlock Deck
Unlock for access to all 60 flashcards in this deck.
Unlock Deck
k this deck
55
The figures below show the relationship between salary and personal lunch expenses on week days for a group of business men. Comment on the difference in graphs and in the coefficient of determination between the graph that includes a data point of someone who reported earnings of $21,000 per year and weekly personal lunch expenses of $100 per week (second graph)and the graph that did not include this data point (first graph).
Unlock Deck
Unlock for access to all 60 flashcards in this deck.
Unlock Deck
k this deck
56
Use the data provided in the table below to answer the question. The table shows city size and annual grocery expenditures for eight families. City size is in thousands and expenditures is in hundreds of dollars.
Based on the scatterplots below, what is the better predictor for head circumference-- height or shoulder width? Explain how you made your decision.
Based on the scatterplots below, what is the better predictor for head circumference-- height or shoulder width? Explain how you made your decision.
Unlock Deck
Unlock for access to all 60 flashcards in this deck.
Unlock Deck
k this deck
57
The scatterplot below shows the number of alcoholic drinks consumed and memory test results for some college students. Is there an association? If so, describe the pattern. Be sure to comment on trend, shape, and the strength of the association.
Unlock Deck
Unlock for access to all 60 flashcards in this deck.
Unlock Deck
k this deck
58
Suppose that runner height (in inches)and finish time in a 5k (in seconds)have a linear association as evidenced by a scatterplot showing a roughly linear pattern, explain the purpose of finding the equation for the regression line that will relate runner height and finish time. What are the limitations of the regression line? Explain the meaning of the slope and intercept of such a model?
Unlock Deck
Unlock for access to all 60 flashcards in this deck.
Unlock Deck
k this deck
59
Suppose that in the Midwest, it is shown that there is trend between home insurance claims in dollars and the number of cattle owned by the home owner. The trend shows that higher claims were paid out to homeowners that owned more cattle. Does this trend prove that owning more cattle causes higher insurance claims? Be sure to explain your reasoning, don't just answer yes or no. What is a potential hidden variable in this context?
Unlock Deck
Unlock for access to all 60 flashcards in this deck.
Unlock Deck
k this deck
60
Use the data provided in the table below to answer the question. The table shows city size and annual grocery expenditures for eight families. City size is in thousands and expenditures is in hundreds of dollars.
Based on the scatterplot, estimate the correlation coefficient between city size and expenditures for these eight families. Explain your reasons for choosing your estimate.
Based on the scatterplot, estimate the correlation coefficient between city size and expenditures for these eight families. Explain your reasons for choosing your estimate.
Unlock Deck
Unlock for access to all 60 flashcards in this deck.
Unlock Deck
k this deck
Unlock Deck
Unlock for access to all 60 flashcards in this deck.


