Deck 16: Simple Linear Regression and Correlation
Full screen (f)
Question
Question
Question
Question
Question
Question
Question
Question
Question
Question
Question
Question
Question
Question
Question
Question
Question
Question
Question
Question
Question
Question
Question
Question
NARRBEGIN: Marc Anthony Concert
Marc Anthony Concert
At a recent Marc Anthony concert, a survey was conducted that asked a random sample of 20 people their age and how many concerts they have attended since the first of the year. The following data were collected:
 An Excel output follows:
 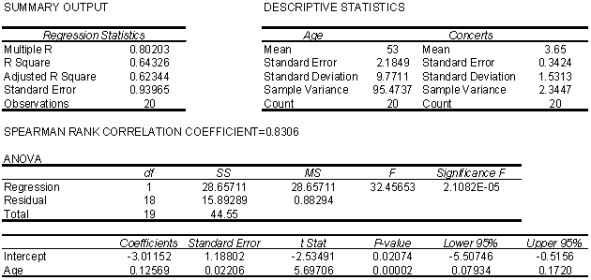 NARREND
{Marc Anthony Concert Narrative} Use the regression equation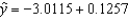 to determine the predicted values of y.
Marc Anthony Concert
At a recent Marc Anthony concert, a survey was conducted that asked a random sample of 20 people their age and how many concerts they have attended since the first of the year. The following data were collected:
An Excel output follows: NARREND{Marc Anthony Concert Narrative} Use the regression equation
to determine the predicted values of y. Question
NARRBEGIN: Game Winnings & Ed.Game Winnings & Education
An ardent fan of television game shows has observed that, in general, the more educated the contestant, the less money he or she wins. To test her belief she gathers data about the last eight winners of her favorite game show. She records their winnings in dollars and the number of years of education. The results are as follows. NARREND
{Game Winnings & Education Narrative} Use the regression equation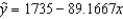 to determine the predicted values of y.
An ardent fan of television game shows has observed that, in general, the more educated the contestant, the less money he or she wins. To test her belief she gathers data about the last eight winners of her favorite game show. She records their winnings in dollars and the number of years of education. The results are as follows.
NARREND{Game Winnings & Education Narrative} Use the regression equation
to determine the predicted values of y. Question
NARRBEGIN: Comedy Shows Revenues
Comedy Shows Revenues
A financier whose specialty is investing in comedy shows has observed that, in general, shows with "big-name" stars seem to generate more revenue than those shows whose stars are less well known. To examine his belief he records the gross revenue and the payment (in $ millions) given to the two highest-paid comedians in the show for ten recently staged shows. NARREND
{Comedy Shows Revenues Narrative} Plot the residuals against the predicted values of y. What does the graph tell you?
Comedy Shows Revenues
A financier whose specialty is investing in comedy shows has observed that, in general, shows with "big-name" stars seem to generate more revenue than those shows whose stars are less well known. To examine his belief he records the gross revenue and the payment (in $ millions) given to the two highest-paid comedians in the show for ten recently staged shows.
NARREND{Comedy Shows Revenues Narrative} Plot the residuals against the predicted values of y. What does the graph tell you?
Question
NARRBEGIN: Telemarketing Sales and E
Telemarketing Sales and Experience
The general manager of a telemarketing company believes that experience is the most important factor in determining the level of success of a telemarketer. To examine this belief she records last month's sales (in $1,000s) and the years of experience of 10 randomly selected telemarketers. These data are listed below. NARREND
{Telemarketer Sales and Experience Narrative} Plot the residuals against the predicted values of y. What does the graph tell you?
Telemarketing Sales and Experience
The general manager of a telemarketing company believes that experience is the most important factor in determining the level of success of a telemarketer. To examine this belief she records last month's sales (in $1,000s) and the years of experience of 10 randomly selected telemarketers. These data are listed below.
NARREND{Telemarketer Sales and Experience Narrative} Plot the residuals against the predicted values of y. What does the graph tell you?
Question
Question
NARRBEGIN: Telemarketing Sales and E
Telemarketing Sales and Experience
The general manager of a telemarketing company believes that experience is the most important factor in determining the level of success of a telemarketer. To examine this belief she records last month's sales (in $1,000s) and the years of experience of 10 randomly selected telemarketers. These data are listed below. NARREND
{Telemarketer Sales and Experience Narrative} Identify possible outliers.
Telemarketing Sales and Experience
The general manager of a telemarketing company believes that experience is the most important factor in determining the level of success of a telemarketer. To examine this belief she records last month's sales (in $1,000s) and the years of experience of 10 randomly selected telemarketers. These data are listed below.
NARREND{Telemarketer Sales and Experience Narrative} Identify possible outliers.
Question
NARRBEGIN: Game Winnings & Ed.Game Winnings & Education
An ardent fan of television game shows has observed that, in general, the more educated the contestant, the less money he or she wins. To test her belief she gathers data about the last eight winners of her favorite game show. She records their winnings in dollars and the number of years of education. The results are as follows. NARREND
{Game Winnings & Education Narrative} Identify possible outliers.
An ardent fan of television game shows has observed that, in general, the more educated the contestant, the less money he or she wins. To test her belief she gathers data about the last eight winners of her favorite game show. She records their winnings in dollars and the number of years of education. The results are as follows.
NARREND{Game Winnings & Education Narrative} Identify possible outliers.
Question
NARRBEGIN: Marc Anthony Concert
Marc Anthony Concert
At a recent Marc Anthony concert, a survey was conducted that asked a random sample of 20 people their age and how many concerts they have attended since the first of the year. The following data were collected:
An Excel output follows: NARREND
{Marc Anthony Concert Narrative} Does it appear that heteroscedasticity is a problem? Explain.
Marc Anthony Concert
At a recent Marc Anthony concert, a survey was conducted that asked a random sample of 20 people their age and how many concerts they have attended since the first of the year. The following data were collected:
An Excel output follows: NARREND{Marc Anthony Concert Narrative} Does it appear that heteroscedasticity is a problem? Explain.
Question
NARRBEGIN: Comedy Shows Revenues
Comedy Shows Revenues
A financier whose specialty is investing in comedy shows has observed that, in general, shows with "big-name" stars seem to generate more revenue than those shows whose stars are less well known. To examine his belief he records the gross revenue and the payment (in $ millions) given to the two highest-paid comedians in the show for ten recently staged shows. NARREND
{Comedy Shows Revenues Narrative} Use the regression equation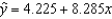 to determine the predicted values of y.
Comedy Shows Revenues
A financier whose specialty is investing in comedy shows has observed that, in general, shows with "big-name" stars seem to generate more revenue than those shows whose stars are less well known. To examine his belief he records the gross revenue and the payment (in $ millions) given to the two highest-paid comedians in the show for ten recently staged shows.
NARREND{Comedy Shows Revenues Narrative} Use the regression equation
to determine the predicted values of y. Question
NARRBEGIN: Game Winnings & Ed.Game Winnings & Education
An ardent fan of television game shows has observed that, in general, the more educated the contestant, the less money he or she wins. To test her belief she gathers data about the last eight winners of her favorite game show. She records their winnings in dollars and the number of years of education. The results are as follows. NARREND
{Game Winnings & Education Narrative} Plot the residuals against the predicted values . What does the graph tell you?
An ardent fan of television game shows has observed that, in general, the more educated the contestant, the less money he or she wins. To test her belief she gathers data about the last eight winners of her favorite game show. She records their winnings in dollars and the number of years of education. The results are as follows.
NARREND{Game Winnings & Education Narrative} Plot the residuals against the predicted values
. What does the graph tell you? Question
NARRBEGIN: Telemarketing Sales and E
Telemarketing Sales and Experience
The general manager of a telemarketing company believes that experience is the most important factor in determining the level of success of a telemarketer. To examine this belief she records last month's sales (in $1,000s) and the years of experience of 10 randomly selected telemarketers. These data are listed below. NARREND
{Telemarketer Sales and Experience Narrative} Use the regression equation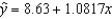 to determine the predicted values of y.
Telemarketing Sales and Experience
The general manager of a telemarketing company believes that experience is the most important factor in determining the level of success of a telemarketer. To examine this belief she records last month's sales (in $1,000s) and the years of experience of 10 randomly selected telemarketers. These data are listed below.
NARREND{Telemarketer Sales and Experience Narrative} Use the regression equation
to determine the predicted values of y. Question
NARRBEGIN: Marc Anthony Concert
Marc Anthony Concert
At a recent Marc Anthony concert, a survey was conducted that asked a random sample of 20 people their age and how many concerts they have attended since the first of the year. The following data were collected:
An Excel output follows: NARREND
{Marc Anthony Concert Narrative} Plot the residuals against the predicted values .
.
Marc Anthony Concert
At a recent Marc Anthony concert, a survey was conducted that asked a random sample of 20 people their age and how many concerts they have attended since the first of the year. The following data were collected:
An Excel output follows: NARREND{Marc Anthony Concert Narrative} Plot the residuals against the predicted values
. Question
Question
Question
NARRBEGIN: Marc Anthony Concert
Marc Anthony Concert
At a recent Marc Anthony concert, a survey was conducted that asked a random sample of 20 people their age and how many concerts they have attended since the first of the year. The following data were collected:
An Excel output follows: NARREND
{Marc Anthony Concert Narrative} Use the predicted values and the actual values of y to calculate the residuals.
Marc Anthony Concert
At a recent Marc Anthony concert, a survey was conducted that asked a random sample of 20 people their age and how many concerts they have attended since the first of the year. The following data were collected:
An Excel output follows: NARREND{Marc Anthony Concert Narrative} Use the predicted values and the actual values of y to calculate the residuals.
Question
Question
Question
Question
Question
Question
NARRBEGIN: Marc Anthony Concert
Marc Anthony Concert
At a recent Marc Anthony concert, a survey was conducted that asked a random sample of 20 people their age and how many concerts they have attended since the first of the year. The following data were collected:
An Excel output follows: NARREND
{Marc Anthony Concert Narrative} Identify possible outliers.
Marc Anthony Concert
At a recent Marc Anthony concert, a survey was conducted that asked a random sample of 20 people their age and how many concerts they have attended since the first of the year. The following data were collected:
An Excel output follows: NARREND{Marc Anthony Concert Narrative} Identify possible outliers.
Question
Question
Question
NARRBEGIN: Oil Quality and Price
Oil Quality and Price
Quality of oil is measured in API gravity degrees--the higher the degrees API, the higher the quality. The table shown below is produced by an expert in the field who believes that there is a relationship between quality and price per barrel. A partial Minitab output follows:


 NARREND
{Oil Quality and Price Narrative} Does it appear that the errors are normally distributed? Explain.
Oil Quality and Price
Quality of oil is measured in API gravity degrees--the higher the degrees API, the higher the quality. The table shown below is produced by an expert in the field who believes that there is a relationship between quality and price per barrel.
A partial Minitab output follows: NARREND{Oil Quality and Price Narrative} Does it appear that the errors are normally distributed? Explain.
Question
Question
NARRBEGIN: Marc Anthony Concert
Marc Anthony Concert
At a recent Marc Anthony concert, a survey was conducted that asked a random sample of 20 people their age and how many concerts they have attended since the first of the year. The following data were collected:
An Excel output follows: NARREND
{Marc Anthony Concert Narrative} Draw a histogram of the residuals.
Marc Anthony Concert
At a recent Marc Anthony concert, a survey was conducted that asked a random sample of 20 people their age and how many concerts they have attended since the first of the year. The following data were collected:
An Excel output follows: NARREND{Marc Anthony Concert Narrative} Draw a histogram of the residuals.
Question
Question
NARRBEGIN: Oil Quality and Price
Oil Quality and Price
Quality of oil is measured in API gravity degrees--the higher the degrees API, the higher the quality. The table shown below is produced by an expert in the field who believes that there is a relationship between quality and price per barrel. A partial Minitab output follows:
NARREND
{Oil Quality and Price Narrative} Does it appear that heteroscedasticity is a problem? Explain.
Oil Quality and Price
Quality of oil is measured in API gravity degrees--the higher the degrees API, the higher the quality. The table shown below is produced by an expert in the field who believes that there is a relationship between quality and price per barrel.
A partial Minitab output follows: NARREND{Oil Quality and Price Narrative} Does it appear that heteroscedasticity is a problem? Explain.
Question
NARRBEGIN: Oil Quality and Price
Oil Quality and Price
Quality of oil is measured in API gravity degrees--the higher the degrees API, the higher the quality. The table shown below is produced by an expert in the field who believes that there is a relationship between quality and price per barrel. A partial Minitab output follows:
NARREND
{Oil Quality and Price Narrative} Identify possible outliers.
Oil Quality and Price
Quality of oil is measured in API gravity degrees--the higher the degrees API, the higher the quality. The table shown below is produced by an expert in the field who believes that there is a relationship between quality and price per barrel.
A partial Minitab output follows: NARREND{Oil Quality and Price Narrative} Identify possible outliers.
Question
NARRBEGIN: Oil Quality and Price
Oil Quality and Price
Quality of oil is measured in API gravity degrees--the higher the degrees API, the higher the quality. The table shown below is produced by an expert in the field who believes that there is a relationship between quality and price per barrel. A partial Minitab output follows:
NARREND
{Oil Quality and Price Narrative} Plot the residuals against the predicted values .
.
Oil Quality and Price
Quality of oil is measured in API gravity degrees--the higher the degrees API, the higher the quality. The table shown below is produced by an expert in the field who believes that there is a relationship between quality and price per barrel.
A partial Minitab output follows: NARREND{Oil Quality and Price Narrative} Plot the residuals against the predicted values
. Question
NARRBEGIN: Marc Anthony Concert
Marc Anthony Concert
At a recent Marc Anthony concert, a survey was conducted that asked a random sample of 20 people their age and how many concerts they have attended since the first of the year. The following data were collected:
An Excel output follows: NARREND
{Marc Anthony Concert Narrative} Does it appear that the errors are normally distributed? Explain.
Marc Anthony Concert
At a recent Marc Anthony concert, a survey was conducted that asked a random sample of 20 people their age and how many concerts they have attended since the first of the year. The following data were collected:
An Excel output follows: NARREND{Marc Anthony Concert Narrative} Does it appear that the errors are normally distributed? Explain.
Question
Question
NARRBEGIN: Oil Quality and Price
Oil Quality and Price
Quality of oil is measured in API gravity degrees--the higher the degrees API, the higher the quality. The table shown below is produced by an expert in the field who believes that there is a relationship between quality and price per barrel. A partial Minitab output follows:
NARREND
{Oil Quality and Price Narrative} Use the regression equation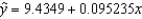 to determine the predicted values of y.
Oil Quality and Price
Quality of oil is measured in API gravity degrees--the higher the degrees API, the higher the quality. The table shown below is produced by an expert in the field who believes that there is a relationship between quality and price per barrel.
A partial Minitab output follows: NARREND{Oil Quality and Price Narrative} Use the regression equation
to determine the predicted values of y. Question
Question
Question
NARRBEGIN: Oil Quality and Price
Oil Quality and Price
Quality of oil is measured in API gravity degrees--the higher the degrees API, the higher the quality. The table shown below is produced by an expert in the field who believes that there is a relationship between quality and price per barrel. A partial Minitab output follows:
NARREND
{Oil Quality and Price Narrative} Draw a histogram of the residuals.
Oil Quality and Price
Quality of oil is measured in API gravity degrees--the higher the degrees API, the higher the quality. The table shown below is produced by an expert in the field who believes that there is a relationship between quality and price per barrel.
A partial Minitab output follows: NARREND{Oil Quality and Price Narrative} Draw a histogram of the residuals.
Question
Question
Question
Question
Question
Question
NARRBEGIN: Sales and Experience
Sales and Experience
The general manager of a chain of Designer stores believes that experience is the most important factor in determining the level of success of a salesperson. To examine this belief she records last month's sales (in $1,000s) and the years of experience of 10 randomly selected salespeople. These data are listed below. NARREND
{Sales and Experience Narrative} Which interval in the previous two questions is narrower: the confidence interval estimate of the expected value of y or the prediction interval for the same given value of x (10 years) and same confidence level? Why?
Sales and Experience
The general manager of a chain of Designer stores believes that experience is the most important factor in determining the level of success of a salesperson. To examine this belief she records last month's sales (in $1,000s) and the years of experience of 10 randomly selected salespeople. These data are listed below.
NARREND{Sales and Experience Narrative} Which interval in the previous two questions is narrower: the confidence interval estimate of the expected value of y or the prediction interval for the same given value of x (10 years) and same confidence level? Why?
Question
Question
Question
Question
Question
Question
Question
Question
Question
Question
Question
Question
Question
Question
Question

Unlock Deck
Sign up to unlock the cards in this deck!
Unlock Deck
Unlock Deck
1/301
Play
Full screen (f)
Deck 16: Simple Linear Regression and Correlation
1
The least squares method requires that the variance of the error variable is a constant no matter what the value of x is. When this requirement is violated, the condition is called:
A)heteroscedasticity.
B)homoscedasticity.
C)influential observation.
D)non-independence of .
A)heteroscedasticity.
B)homoscedasticity.
C)influential observation.
D)non-independence of .
heteroscedasticity.
2
When the variance of the error variable is a constant no matter what the value of x is, this condition is called:
A)heterocausality.
B)homoscedasticity.
C)homocausality.
D)heteroscedasticity.
A)heterocausality.
B)homoscedasticity.
C)homocausality.
D)heteroscedasticity.
homoscedasticity.
3
Error terms that are correlated over time are said to be ____________________.
autocorrelated
serially correlated
serially correlated
4
Error terms that are autocorrelated ____________________ (are/are not) independent.
Unlock Deck
Unlock for access to all 301 flashcards in this deck.
Unlock Deck
k this deck
5
We check for normality by drawing a pie chart of the residuals.
Unlock Deck
Unlock for access to all 301 flashcards in this deck.
Unlock Deck
k this deck
6
If you take the residuals, subtract their mean and divide by their standard deviation, the result is called the ____________________ residuals.
Unlock Deck
Unlock for access to all 301 flashcards in this deck.
Unlock Deck
k this deck
7
We check for normality by drawing a(n) ____________________ of the residuals.
Unlock Deck
Unlock for access to all 301 flashcards in this deck.
Unlock Deck
k this deck
8
If the plot of the residuals vs. the predicted values resembles a straight line with non-zero slope, then the regression line fits well.
Unlock Deck
Unlock for access to all 301 flashcards in this deck.
Unlock Deck
k this deck
9
We standardize residuals by subtracting their mean and dividing by their variance.
Unlock Deck
Unlock for access to all 301 flashcards in this deck.
Unlock Deck
k this deck
10
If the plot of the residuals is fan shaped, which assumption of regression analysis (if any) is violated?
A)No assumptions are violated.
B)Independence of errors
C)Homoscedasticity
D)Normality
A)No assumptions are violated.
B)Independence of errors
C)Homoscedasticity
D)Normality
Unlock Deck
Unlock for access to all 301 flashcards in this deck.
Unlock Deck
k this deck
11
The plot of residuals vs. predicted values should show no patterns if the conditions of a regression analysis are met.
Unlock Deck
Unlock for access to all 301 flashcards in this deck.
Unlock Deck
k this deck
12
The variance of the error variable is required to be constant. When this requirement is satisfied, the condition is called homoscedasticity.
Unlock Deck
Unlock for access to all 301 flashcards in this deck.
Unlock Deck
k this deck
13
Data that exhibit an autocorrelation effect violate the regression assumption of independence.
Unlock Deck
Unlock for access to all 301 flashcards in this deck.
Unlock Deck
k this deck
14
The standardized residual is defined as:
A)residual multiplied by the square root of the standard error of estimate.
B)residual multiplied by the standard error of estimate.
C)residual divided by the square of the standard error of estimate.
D)residual divided by the standard error of estimate.
A)residual multiplied by the square root of the standard error of estimate.
B)residual multiplied by the standard error of estimate.
C)residual divided by the square of the standard error of estimate.
D)residual divided by the standard error of estimate.
Unlock Deck
Unlock for access to all 301 flashcards in this deck.
Unlock Deck
k this deck
15
An outlier is an observation that is unusually small or unusually large.
Unlock Deck
Unlock for access to all 301 flashcards in this deck.
Unlock Deck
k this deck
16
When the error variable does not have constant variance, this condition is called ____________________.
Unlock Deck
Unlock for access to all 301 flashcards in this deck.
Unlock Deck
k this deck
17
One method of diagnosing heteroscedasticity is to plot the residuals against the predicted values of y, then look for a change in the spread of the plotted values.
Unlock Deck
Unlock for access to all 301 flashcards in this deck.
Unlock Deck
k this deck
18
The variance of the error variable is required to be constant. When this requirement is violated, the condition is called heteroscedasticity.
Unlock Deck
Unlock for access to all 301 flashcards in this deck.
Unlock Deck
k this deck
19
The spread in the residuals should increase as the predicted value of y increases.
Unlock Deck
Unlock for access to all 301 flashcards in this deck.
Unlock Deck
k this deck
20
If the variance of the errors is constant for each predicted y value, the condition is called ____________________.
Unlock Deck
Unlock for access to all 301 flashcards in this deck.
Unlock Deck
k this deck
21
NARRBEGIN: Telemarketing Sales and E
Telemarketing Sales and Experience
The general manager of a telemarketing company believes that experience is the most important factor in determining the level of success of a telemarketer. To examine this belief she records last month's sales (in $1,000s) and the years of experience of 10 randomly selected telemarketers. These data are listed below. NARREND
-{Telemarketer Sales and Experience Narrative} Compute the standardized residuals.
Unlock Deck
Unlock for access to all 301 flashcards in this deck.
Unlock Deck
k this deck
22
NARRBEGIN: Telemarketing Sales and E
Telemarketing Sales and Experience
The general manager of a telemarketing company believes that experience is the most important factor in determining the level of success of a telemarketer. To examine this belief she records last month's sales (in $1,000s) and the years of experience of 10 randomly selected telemarketers. These data are listed below. NARREND
-{Telemarketer Sales and Experience Narrative} Use the predicted and actual values of y to calculate the residuals.
Unlock Deck
Unlock for access to all 301 flashcards in this deck.
Unlock Deck
k this deck
23
We can often detect autocorrelation by graphing the residuals against ____________________.
Unlock Deck
Unlock for access to all 301 flashcards in this deck.
Unlock Deck
k this deck
24
NARRBEGIN: Marc Anthony Concert
Marc Anthony Concert
At a recent Marc Anthony concert, a survey was conducted that asked a random sample of 20 people their age and how many concerts they have attended since the first of the year. The following data were collected:
An Excel output follows: NARREND
{Marc Anthony Concert Narrative} Use the regression equation to determine the predicted values of y.
Marc Anthony Concert
At a recent Marc Anthony concert, a survey was conducted that asked a random sample of 20 people their age and how many concerts they have attended since the first of the year. The following data were collected:
An Excel output follows: NARREND{Marc Anthony Concert Narrative} Use the regression equation
to determine the predicted values of y. Unlock Deck
Unlock for access to all 301 flashcards in this deck.
Unlock Deck
k this deck
25
NARRBEGIN: Game Winnings & Ed.Game Winnings & Education
An ardent fan of television game shows has observed that, in general, the more educated the contestant, the less money he or she wins. To test her belief she gathers data about the last eight winners of her favorite game show. She records their winnings in dollars and the number of years of education. The results are as follows. NARREND
{Game Winnings & Education Narrative} Use the regression equation to determine the predicted values of y.
An ardent fan of television game shows has observed that, in general, the more educated the contestant, the less money he or she wins. To test her belief she gathers data about the last eight winners of her favorite game show. She records their winnings in dollars and the number of years of education. The results are as follows.
NARREND{Game Winnings & Education Narrative} Use the regression equation
to determine the predicted values of y. Unlock Deck
Unlock for access to all 301 flashcards in this deck.
Unlock Deck
k this deck
26
NARRBEGIN: Comedy Shows Revenues
Comedy Shows Revenues
A financier whose specialty is investing in comedy shows has observed that, in general, shows with "big-name" stars seem to generate more revenue than those shows whose stars are less well known. To examine his belief he records the gross revenue and the payment (in $ millions) given to the two highest-paid comedians in the show for ten recently staged shows. NARREND
{Comedy Shows Revenues Narrative} Plot the residuals against the predicted values of y. What does the graph tell you?
Comedy Shows Revenues
A financier whose specialty is investing in comedy shows has observed that, in general, shows with "big-name" stars seem to generate more revenue than those shows whose stars are less well known. To examine his belief he records the gross revenue and the payment (in $ millions) given to the two highest-paid comedians in the show for ten recently staged shows.
NARREND{Comedy Shows Revenues Narrative} Plot the residuals against the predicted values of y. What does the graph tell you?
Unlock Deck
Unlock for access to all 301 flashcards in this deck.
Unlock Deck
k this deck
27
NARRBEGIN: Telemarketing Sales and E
Telemarketing Sales and Experience
The general manager of a telemarketing company believes that experience is the most important factor in determining the level of success of a telemarketer. To examine this belief she records last month's sales (in $1,000s) and the years of experience of 10 randomly selected telemarketers. These data are listed below. NARREND
{Telemarketer Sales and Experience Narrative} Plot the residuals against the predicted values of y. What does the graph tell you?
Telemarketing Sales and Experience
The general manager of a telemarketing company believes that experience is the most important factor in determining the level of success of a telemarketer. To examine this belief she records last month's sales (in $1,000s) and the years of experience of 10 randomly selected telemarketers. These data are listed below.
NARREND{Telemarketer Sales and Experience Narrative} Plot the residuals against the predicted values of y. What does the graph tell you?
Unlock Deck
Unlock for access to all 301 flashcards in this deck.
Unlock Deck
k this deck
28
NARRBEGIN: Game Winnings & Ed.Game Winnings & Education
An ardent fan of television game shows has observed that, in general, the more educated the contestant, the less money he or she wins. To test her belief she gathers data about the last eight winners of her favorite game show. She records their winnings in dollars and the number of years of education. The results are as follows. NARREND
-{Game Winnings & Education Narrative} Compute the standardized residuals.
Unlock Deck
Unlock for access to all 301 flashcards in this deck.
Unlock Deck
k this deck
29
NARRBEGIN: Telemarketing Sales and E
Telemarketing Sales and Experience
The general manager of a telemarketing company believes that experience is the most important factor in determining the level of success of a telemarketer. To examine this belief she records last month's sales (in $1,000s) and the years of experience of 10 randomly selected telemarketers. These data are listed below. NARREND
{Telemarketer Sales and Experience Narrative} Identify possible outliers.
Telemarketing Sales and Experience
The general manager of a telemarketing company believes that experience is the most important factor in determining the level of success of a telemarketer. To examine this belief she records last month's sales (in $1,000s) and the years of experience of 10 randomly selected telemarketers. These data are listed below.
NARREND{Telemarketer Sales and Experience Narrative} Identify possible outliers.
Unlock Deck
Unlock for access to all 301 flashcards in this deck.
Unlock Deck
k this deck
30
NARRBEGIN: Game Winnings & Ed.Game Winnings & Education
An ardent fan of television game shows has observed that, in general, the more educated the contestant, the less money he or she wins. To test her belief she gathers data about the last eight winners of her favorite game show. She records their winnings in dollars and the number of years of education. The results are as follows. NARREND
{Game Winnings & Education Narrative} Identify possible outliers.
An ardent fan of television game shows has observed that, in general, the more educated the contestant, the less money he or she wins. To test her belief she gathers data about the last eight winners of her favorite game show. She records their winnings in dollars and the number of years of education. The results are as follows.
NARREND{Game Winnings & Education Narrative} Identify possible outliers.
Unlock Deck
Unlock for access to all 301 flashcards in this deck.
Unlock Deck
k this deck
31
NARRBEGIN: Marc Anthony Concert
Marc Anthony Concert
At a recent Marc Anthony concert, a survey was conducted that asked a random sample of 20 people their age and how many concerts they have attended since the first of the year. The following data were collected:
An Excel output follows: NARREND
{Marc Anthony Concert Narrative} Does it appear that heteroscedasticity is a problem? Explain.
Marc Anthony Concert
At a recent Marc Anthony concert, a survey was conducted that asked a random sample of 20 people their age and how many concerts they have attended since the first of the year. The following data were collected:
An Excel output follows: NARREND{Marc Anthony Concert Narrative} Does it appear that heteroscedasticity is a problem? Explain.
Unlock Deck
Unlock for access to all 301 flashcards in this deck.
Unlock Deck
k this deck
32
NARRBEGIN: Comedy Shows Revenues
Comedy Shows Revenues
A financier whose specialty is investing in comedy shows has observed that, in general, shows with "big-name" stars seem to generate more revenue than those shows whose stars are less well known. To examine his belief he records the gross revenue and the payment (in $ millions) given to the two highest-paid comedians in the show for ten recently staged shows. NARREND
{Comedy Shows Revenues Narrative} Use the regression equation to determine the predicted values of y.
Comedy Shows Revenues
A financier whose specialty is investing in comedy shows has observed that, in general, shows with "big-name" stars seem to generate more revenue than those shows whose stars are less well known. To examine his belief he records the gross revenue and the payment (in $ millions) given to the two highest-paid comedians in the show for ten recently staged shows.
NARREND{Comedy Shows Revenues Narrative} Use the regression equation
to determine the predicted values of y. Unlock Deck
Unlock for access to all 301 flashcards in this deck.
Unlock Deck
k this deck
33
NARRBEGIN: Game Winnings & Ed.Game Winnings & Education
An ardent fan of television game shows has observed that, in general, the more educated the contestant, the less money he or she wins. To test her belief she gathers data about the last eight winners of her favorite game show. She records their winnings in dollars and the number of years of education. The results are as follows. NARREND
{Game Winnings & Education Narrative} Plot the residuals against the predicted values . What does the graph tell you?
An ardent fan of television game shows has observed that, in general, the more educated the contestant, the less money he or she wins. To test her belief she gathers data about the last eight winners of her favorite game show. She records their winnings in dollars and the number of years of education. The results are as follows.
NARREND{Game Winnings & Education Narrative} Plot the residuals against the predicted values
. What does the graph tell you? Unlock Deck
Unlock for access to all 301 flashcards in this deck.
Unlock Deck
k this deck
34
NARRBEGIN: Telemarketing Sales and E
Telemarketing Sales and Experience
The general manager of a telemarketing company believes that experience is the most important factor in determining the level of success of a telemarketer. To examine this belief she records last month's sales (in $1,000s) and the years of experience of 10 randomly selected telemarketers. These data are listed below. NARREND
{Telemarketer Sales and Experience Narrative} Use the regression equation to determine the predicted values of y.
Telemarketing Sales and Experience
The general manager of a telemarketing company believes that experience is the most important factor in determining the level of success of a telemarketer. To examine this belief she records last month's sales (in $1,000s) and the years of experience of 10 randomly selected telemarketers. These data are listed below.
NARREND{Telemarketer Sales and Experience Narrative} Use the regression equation
to determine the predicted values of y. Unlock Deck
Unlock for access to all 301 flashcards in this deck.
Unlock Deck
k this deck
35
NARRBEGIN: Marc Anthony Concert
Marc Anthony Concert
At a recent Marc Anthony concert, a survey was conducted that asked a random sample of 20 people their age and how many concerts they have attended since the first of the year. The following data were collected:
An Excel output follows: NARREND
{Marc Anthony Concert Narrative} Plot the residuals against the predicted values .
Marc Anthony Concert
At a recent Marc Anthony concert, a survey was conducted that asked a random sample of 20 people their age and how many concerts they have attended since the first of the year. The following data were collected:
An Excel output follows: NARREND{Marc Anthony Concert Narrative} Plot the residuals against the predicted values
. Unlock Deck
Unlock for access to all 301 flashcards in this deck.
Unlock Deck
k this deck
36
NARRBEGIN: Game Winnings & Ed.Game Winnings & Education
An ardent fan of television game shows has observed that, in general, the more educated the contestant, the less money he or she wins. To test her belief she gathers data about the last eight winners of her favorite game show. She records their winnings in dollars and the number of years of education. The results are as follows. NARREND
-{Game Winnings & Education Narrative} Use the predicted and actual values of y to calculate the residuals.
Unlock Deck
Unlock for access to all 301 flashcards in this deck.
Unlock Deck
k this deck
37
A(n) ____________________ is an observation that is unusually small or large.
Unlock Deck
Unlock for access to all 301 flashcards in this deck.
Unlock Deck
k this deck
38
NARRBEGIN: Marc Anthony Concert
Marc Anthony Concert
At a recent Marc Anthony concert, a survey was conducted that asked a random sample of 20 people their age and how many concerts they have attended since the first of the year. The following data were collected:
An Excel output follows: NARREND
{Marc Anthony Concert Narrative} Use the predicted values and the actual values of y to calculate the residuals.
Marc Anthony Concert
At a recent Marc Anthony concert, a survey was conducted that asked a random sample of 20 people their age and how many concerts they have attended since the first of the year. The following data were collected:
An Excel output follows: NARREND{Marc Anthony Concert Narrative} Use the predicted values and the actual values of y to calculate the residuals.
Unlock Deck
Unlock for access to all 301 flashcards in this deck.
Unlock Deck
k this deck
39
NARRBEGIN: Comedy Shows Revenues
Comedy Shows Revenues
A financier whose specialty is investing in comedy shows has observed that, in general, shows with "big-name" stars seem to generate more revenue than those shows whose stars are less well known. To examine his belief he records the gross revenue and the payment (in $ millions) given to the two highest-paid comedians in the show for ten recently staged shows. NARREND
-{Comedy Shows Revenues Narrative} Use the predicted and actual values of y to calculate the residuals.
Unlock Deck
Unlock for access to all 301 flashcards in this deck.
Unlock Deck
k this deck
40
If a single point has a large impact on the equation of the regression line, it is called a(n) ____________________ point.
Unlock Deck
Unlock for access to all 301 flashcards in this deck.
Unlock Deck
k this deck
41
The confidence interval estimate of the expected value of y will be narrower than the prediction interval for the same given value of x and confidence level. This is because there is less error in estimating a mean value as opposed to predicting an individual value.
Unlock Deck
Unlock for access to all 301 flashcards in this deck.
Unlock Deck
k this deck
42
A prediction interval is used when we want to predict a one-time occurrence for a particular value of y when the independent variable is a given x value.
Unlock Deck
Unlock for access to all 301 flashcards in this deck.
Unlock Deck
k this deck
43
A confidence interval estimate for the expected value of y will always be wider than the prediction interval for the same given value of x and the same confidence level.
Unlock Deck
Unlock for access to all 301 flashcards in this deck.
Unlock Deck
k this deck
44
NARRBEGIN: Marc Anthony Concert
Marc Anthony Concert
At a recent Marc Anthony concert, a survey was conducted that asked a random sample of 20 people their age and how many concerts they have attended since the first of the year. The following data were collected:
An Excel output follows: NARREND
{Marc Anthony Concert Narrative} Identify possible outliers.
Marc Anthony Concert
At a recent Marc Anthony concert, a survey was conducted that asked a random sample of 20 people their age and how many concerts they have attended since the first of the year. The following data were collected:
An Excel output follows: NARREND{Marc Anthony Concert Narrative} Identify possible outliers.
Unlock Deck
Unlock for access to all 301 flashcards in this deck.
Unlock Deck
k this deck
45
A confidence interval (as opposed to a prediction interval) is used to estimate the long-run average value of y.
Unlock Deck
Unlock for access to all 301 flashcards in this deck.
Unlock Deck
k this deck
46
NARRBEGIN: Oil Quality and Price
Oil Quality and Price
Quality of oil is measured in API gravity degrees--the higher the degrees API, the higher the quality. The table shown below is produced by an expert in the field who believes that there is a relationship between quality and price per barrel. A partial Minitab output follows:
NARREND
-{Oil Quality and Price Narrative} Use the predicted values and the actual values of y to calculate the residuals.
Unlock Deck
Unlock for access to all 301 flashcards in this deck.
Unlock Deck
k this deck
47
NARRBEGIN: Oil Quality and Price
Oil Quality and Price
Quality of oil is measured in API gravity degrees--the higher the degrees API, the higher the quality. The table shown below is produced by an expert in the field who believes that there is a relationship between quality and price per barrel. A partial Minitab output follows:
NARREND
{Oil Quality and Price Narrative} Does it appear that the errors are normally distributed? Explain.
Oil Quality and Price
Quality of oil is measured in API gravity degrees--the higher the degrees API, the higher the quality. The table shown below is produced by an expert in the field who believes that there is a relationship between quality and price per barrel.
A partial Minitab output follows: NARREND{Oil Quality and Price Narrative} Does it appear that the errors are normally distributed? Explain.
Unlock Deck
Unlock for access to all 301 flashcards in this deck.
Unlock Deck
k this deck
48
The confidence interval estimate of the expected value of y will be wider than the prediction interval for the same given value of x and confidence level. This is because there is more error in estimating a mean value as opposed to predicting an individual value.
Unlock Deck
Unlock for access to all 301 flashcards in this deck.
Unlock Deck
k this deck
49
NARRBEGIN: Marc Anthony Concert
Marc Anthony Concert
At a recent Marc Anthony concert, a survey was conducted that asked a random sample of 20 people their age and how many concerts they have attended since the first of the year. The following data were collected:
An Excel output follows: NARREND
{Marc Anthony Concert Narrative} Draw a histogram of the residuals.
Marc Anthony Concert
At a recent Marc Anthony concert, a survey was conducted that asked a random sample of 20 people their age and how many concerts they have attended since the first of the year. The following data were collected:
An Excel output follows: NARREND{Marc Anthony Concert Narrative} Draw a histogram of the residuals.
Unlock Deck
Unlock for access to all 301 flashcards in this deck.
Unlock Deck
k this deck
50
NARRBEGIN: Marc Anthony Concert
Marc Anthony Concert
At a recent Marc Anthony concert, a survey was conducted that asked a random sample of 20 people their age and how many concerts they have attended since the first of the year. The following data were collected:
An Excel output follows:
NARREND
-{Marc Anthony Concert Narrative} Use the residuals to compute the standardized residuals.
Unlock Deck
Unlock for access to all 301 flashcards in this deck.
Unlock Deck
k this deck
51
NARRBEGIN: Oil Quality and Price
Oil Quality and Price
Quality of oil is measured in API gravity degrees--the higher the degrees API, the higher the quality. The table shown below is produced by an expert in the field who believes that there is a relationship between quality and price per barrel. A partial Minitab output follows:
NARREND
{Oil Quality and Price Narrative} Does it appear that heteroscedasticity is a problem? Explain.
Oil Quality and Price
Quality of oil is measured in API gravity degrees--the higher the degrees API, the higher the quality. The table shown below is produced by an expert in the field who believes that there is a relationship between quality and price per barrel.
A partial Minitab output follows: NARREND{Oil Quality and Price Narrative} Does it appear that heteroscedasticity is a problem? Explain.
Unlock Deck
Unlock for access to all 301 flashcards in this deck.
Unlock Deck
k this deck
52
NARRBEGIN: Oil Quality and Price
Oil Quality and Price
Quality of oil is measured in API gravity degrees--the higher the degrees API, the higher the quality. The table shown below is produced by an expert in the field who believes that there is a relationship between quality and price per barrel. A partial Minitab output follows:
NARREND
{Oil Quality and Price Narrative} Identify possible outliers.
Oil Quality and Price
Quality of oil is measured in API gravity degrees--the higher the degrees API, the higher the quality. The table shown below is produced by an expert in the field who believes that there is a relationship between quality and price per barrel.
A partial Minitab output follows: NARREND{Oil Quality and Price Narrative} Identify possible outliers.
Unlock Deck
Unlock for access to all 301 flashcards in this deck.
Unlock Deck
k this deck
53
NARRBEGIN: Oil Quality and Price
Oil Quality and Price
Quality of oil is measured in API gravity degrees--the higher the degrees API, the higher the quality. The table shown below is produced by an expert in the field who believes that there is a relationship between quality and price per barrel. A partial Minitab output follows:
NARREND
{Oil Quality and Price Narrative} Plot the residuals against the predicted values .
Oil Quality and Price
Quality of oil is measured in API gravity degrees--the higher the degrees API, the higher the quality. The table shown below is produced by an expert in the field who believes that there is a relationship between quality and price per barrel.
A partial Minitab output follows: NARREND{Oil Quality and Price Narrative} Plot the residuals against the predicted values
. Unlock Deck
Unlock for access to all 301 flashcards in this deck.
Unlock Deck
k this deck
54
NARRBEGIN: Marc Anthony Concert
Marc Anthony Concert
At a recent Marc Anthony concert, a survey was conducted that asked a random sample of 20 people their age and how many concerts they have attended since the first of the year. The following data were collected:
An Excel output follows: NARREND
{Marc Anthony Concert Narrative} Does it appear that the errors are normally distributed? Explain.
Marc Anthony Concert
At a recent Marc Anthony concert, a survey was conducted that asked a random sample of 20 people their age and how many concerts they have attended since the first of the year. The following data were collected:
An Excel output follows: NARREND{Marc Anthony Concert Narrative} Does it appear that the errors are normally distributed? Explain.
Unlock Deck
Unlock for access to all 301 flashcards in this deck.
Unlock Deck
k this deck
55
NARRBEGIN: Oil Quality and Price
Oil Quality and Price
Quality of oil is measured in API gravity degrees--the higher the degrees API, the higher the quality. The table shown below is produced by an expert in the field who believes that there is a relationship between quality and price per barrel. A partial Minitab output follows:
NARREND
-{Oil Quality and Price Narrative} Use the residuals to compute the standardized residuals.
Unlock Deck
Unlock for access to all 301 flashcards in this deck.
Unlock Deck
k this deck
56
NARRBEGIN: Oil Quality and Price
Oil Quality and Price
Quality of oil is measured in API gravity degrees--the higher the degrees API, the higher the quality. The table shown below is produced by an expert in the field who believes that there is a relationship between quality and price per barrel. A partial Minitab output follows:
NARREND
{Oil Quality and Price Narrative} Use the regression equation to determine the predicted values of y.
Oil Quality and Price
Quality of oil is measured in API gravity degrees--the higher the degrees API, the higher the quality. The table shown below is produced by an expert in the field who believes that there is a relationship between quality and price per barrel.
A partial Minitab output follows: NARREND{Oil Quality and Price Narrative} Use the regression equation
to determine the predicted values of y. Unlock Deck
Unlock for access to all 301 flashcards in this deck.
Unlock Deck
k this deck
57
The graph of a confidence interval for the expected value of y is represented by two parallel lines, one on either side of the regression line.
Unlock Deck
Unlock for access to all 301 flashcards in this deck.
Unlock Deck
k this deck
58
There is more error in estimating a mean value of y as opposed to predicting an individual value of y.
Unlock Deck
Unlock for access to all 301 flashcards in this deck.
Unlock Deck
k this deck
59
NARRBEGIN: Oil Quality and Price
Oil Quality and Price
Quality of oil is measured in API gravity degrees--the higher the degrees API, the higher the quality. The table shown below is produced by an expert in the field who believes that there is a relationship between quality and price per barrel. A partial Minitab output follows:
NARREND
{Oil Quality and Price Narrative} Draw a histogram of the residuals.
Oil Quality and Price
Quality of oil is measured in API gravity degrees--the higher the degrees API, the higher the quality. The table shown below is produced by an expert in the field who believes that there is a relationship between quality and price per barrel.
A partial Minitab output follows: NARREND{Oil Quality and Price Narrative} Draw a histogram of the residuals.
Unlock Deck
Unlock for access to all 301 flashcards in this deck.
Unlock Deck
k this deck
60
The prediction interval for a particular value of y is always wider than the confidence interval for mean value of y, given the same data set, x value, and confidence level.
Unlock Deck
Unlock for access to all 301 flashcards in this deck.
Unlock Deck
k this deck
61
The point where confidence intervals and prediction intervals do best is .
Unlock Deck
Unlock for access to all 301 flashcards in this deck.
Unlock Deck
k this deck
62
Graphically, a prediction interval is represented as two ____________________ lines.
Unlock Deck
Unlock for access to all 301 flashcards in this deck.
Unlock Deck
k this deck
63
If you take a particular x value and plug it into a regression line equation, the result is a(n) ____________________ estimate for y.
Unlock Deck
Unlock for access to all 301 flashcards in this deck.
Unlock Deck
k this deck
64
In order to estimate with 95% confidence the expected value of y for a given value of x in a simple linear regression problem, a random sample of 10 observations is taken. Which of the following t-table values listed below would be used?
A)2.228
B)2.306
C)1.860
D)1.812
A)2.228
B)2.306
C)1.860
D)1.812
Unlock Deck
Unlock for access to all 301 flashcards in this deck.
Unlock Deck
k this deck
65
NARRBEGIN: Sales and Experience
Sales and Experience
The general manager of a chain of Designer stores believes that experience is the most important factor in determining the level of success of a salesperson. To examine this belief she records last month's sales (in $1,000s) and the years of experience of 10 randomly selected salespeople. These data are listed below. NARREND
{Sales and Experience Narrative} Which interval in the previous two questions is narrower: the confidence interval estimate of the expected value of y or the prediction interval for the same given value of x (10 years) and same confidence level? Why?
Sales and Experience
The general manager of a chain of Designer stores believes that experience is the most important factor in determining the level of success of a salesperson. To examine this belief she records last month's sales (in $1,000s) and the years of experience of 10 randomly selected salespeople. These data are listed below.
NARREND{Sales and Experience Narrative} Which interval in the previous two questions is narrower: the confidence interval estimate of the expected value of y or the prediction interval for the same given value of x (10 years) and same confidence level? Why?
Unlock Deck
Unlock for access to all 301 flashcards in this deck.
Unlock Deck
k this deck
66
The graph of a confidence interval for the expected value of y is represented by two curved lines, one on either side of the regression line.
Unlock Deck
Unlock for access to all 301 flashcards in this deck.
Unlock Deck
k this deck
67
There is ____________________ error in estimating a mean than in predicting an individual value.
Unlock Deck
Unlock for access to all 301 flashcards in this deck.
Unlock Deck
k this deck
68
In order to predict with 90% confidence the expected value of y for a given value of x in a simple linear regression problem, a random sample of 10 observations is taken. Which of the following t-table values listed below would be used?
A)1.812
B)1.860
C)2.228
D)2.306
A)1.812
B)1.860
C)2.228
D)2.306
Unlock Deck
Unlock for access to all 301 flashcards in this deck.
Unlock Deck
k this deck
69
NARRBEGIN: Sales and Experience
Sales and Experience
The general manager of a chain of Designer stores believes that experience is the most important factor in determining the level of success of a salesperson. To examine this belief she records last month's sales (in $1,000s) and the years of experience of 10 randomly selected salespeople. These data are listed below. NARREND
-{Sales and Experience Narrative} Predict with 95% confidence the monthly sales of a salesperson with 10 years of experience.
Unlock Deck
Unlock for access to all 301 flashcards in this deck.
Unlock Deck
k this deck
70
A prediction interval for a particular y is always ____________________ than a confidence interval for the mean of y.
Unlock Deck
Unlock for access to all 301 flashcards in this deck.
Unlock Deck
k this deck
71
NARRBEGIN: Sales and Experience
Sales and Experience
The general manager of a chain of Designer stores believes that experience is the most important factor in determining the level of success of a salesperson. To examine this belief she records last month's sales (in $1,000s) and the years of experience of 10 randomly selected salespeople. These data are listed below. NARREND
-{Sales and Experience Narrative} Estimate with 95% confidence the average monthly sales of all salespersons with 10 years of experience.
Unlock Deck
Unlock for access to all 301 flashcards in this deck.
Unlock Deck
k this deck
72
A medical statistician wanted to examine the relationship between the amount of sunshine (x) and incidence of skin discolorations (y). As an experiment he found the number of skin discolorations detected per 100,000 of population and the average daily sunshine in eight counties around the country. These data are shown below. Predict with 95% confidence the skin discolorations per 100,000 in a county with a daily average of 6.5 hours of sunshine.
Unlock Deck
Unlock for access to all 301 flashcards in this deck.
Unlock Deck
k this deck
73
The farther a given value of x is from the mean of x, the ____________________ the estimated error becomes.
Unlock Deck
Unlock for access to all 301 flashcards in this deck.
Unlock Deck
k this deck
74
The confidence interval estimate of the expected value of y for a given value x, compared to the prediction interval of y for the same given value of x and confidence level, will be:
A)wider.
B)the same.
C)narrower.
D)impossible to know.
A)wider.
B)the same.
C)narrower.
D)impossible to know.
Unlock Deck
Unlock for access to all 301 flashcards in this deck.
Unlock Deck
k this deck
75
In order to predict with 80% confidence the expected value of y for a given value of x in a simple linear regression problem, a random sample of 15 observations is taken. Which of the following t-table values listed below would be used?
A)1.350
B)1.771
C)2.160
D)2.650
A)1.350
B)1.771
C)2.160
D)2.650
Unlock Deck
Unlock for access to all 301 flashcards in this deck.
Unlock Deck
k this deck
76
You use a(n) ____________________ interval whenever you want to estimate the mean of y when x is a given value.
Unlock Deck
Unlock for access to all 301 flashcards in this deck.
Unlock Deck
k this deck
77
Graphically, a confidence interval for the mean of y is represented as two ____________________ lines.
Unlock Deck
Unlock for access to all 301 flashcards in this deck.
Unlock Deck
k this deck
78
You use a(n) ____________________ interval whenever you want to estimate a one-time occurrence for a particular value of y when x is a given value.
Unlock Deck
Unlock for access to all 301 flashcards in this deck.
Unlock Deck
k this deck
79
The width of the confidence interval estimate for the predicted value of y depends on
A)the standard error of the estimate
B)the value of x for which the prediction is being made
C)the sample size
D)All of these choices are true.
A)the standard error of the estimate
B)the value of x for which the prediction is being made
C)the sample size
D)All of these choices are true.
Unlock Deck
Unlock for access to all 301 flashcards in this deck.
Unlock Deck
k this deck
80
In order to predict with 98% confidence the expected value of y for a given value of x in a simple linear regression problem, a random sample of 15 observations is taken. Which of the following t-table values listed below would be used?
A)1.350
B)1.771
C)2.160
D)2.650
A)1.350
B)1.771
C)2.160
D)2.650
Unlock Deck
Unlock for access to all 301 flashcards in this deck.
Unlock Deck
k this deck
Unlock Deck
Unlock for access to all 301 flashcards in this deck.


