Deck 3: Graphical Descriptive Techniques II
Full screen (f)
Question
NARRBEGIN: Home Care
Home Care
Data are collected on the number of house calls (x) made in a given week by each of 60 nurses in a certain hospital. The same data set is displayed in each of the three histograms below.

 NARREND
A professor examines the relationship between minutes studying and exam score (out of 200 points) for a random sample of his students. The scatter diagram is shown below. It appears that study time has somewhat of a positive linear relationship with exam score.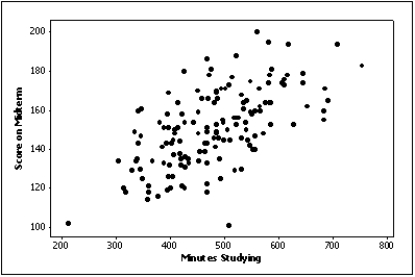
Home Care
Data are collected on the number of house calls (x) made in a given week by each of 60 nurses in a certain hospital. The same data set is displayed in each of the three histograms below.
NARRENDA professor examines the relationship between minutes studying and exam score (out of 200 points) for a random sample of his students. The scatter diagram is shown below. It appears that study time has somewhat of a positive linear relationship with exam score.
Question
NARRBEGIN: Home Care
Home Care
Data are collected on the number of house calls (x) made in a given week by each of 60 nurses in a certain hospital. The same data set is displayed in each of the three histograms below. NARREND
Which of the following is the method statisticians use to draw the best fitting straight line through the data on a scatter diagram?
A)The fit best method.
B)The least squares method.
C)The point-intercept method.
D)None of these choices.
Home Care
Data are collected on the number of house calls (x) made in a given week by each of 60 nurses in a certain hospital. The same data set is displayed in each of the three histograms below.
NARRENDWhich of the following is the method statisticians use to draw the best fitting straight line through the data on a scatter diagram?
A)The fit best method.
B)The least squares method.
C)The point-intercept method.
D)None of these choices.
Question
NARRBEGIN: Home Care
Home Care
Data are collected on the number of house calls (x) made in a given week by each of 60 nurses in a certain hospital. The same data set is displayed in each of the three histograms below. NARREND
If we draw a straight line through the points in a scatter diagram and most of the points fall close to the line, there must be a positive relationship between the two variables.
Home Care
Data are collected on the number of house calls (x) made in a given week by each of 60 nurses in a certain hospital. The same data set is displayed in each of the three histograms below.
NARRENDIf we draw a straight line through the points in a scatter diagram and most of the points fall close to the line, there must be a positive relationship between the two variables.
Question
NARRBEGIN: Home Care
Home Care
Data are collected on the number of house calls (x) made in a given week by each of 60 nurses in a certain hospital. The same data set is displayed in each of the three histograms below. NARREND
If the data in a scatter diagram is scattered completely at random, what do you conclude?
A)There is no linear relationship between X and Y.
B)There is a strong linear relationship between X and Y.
C)There is a strong linear relationship between X and Y that is described by a horizontal (flat) line.
D)None of these choices.
Home Care
Data are collected on the number of house calls (x) made in a given week by each of 60 nurses in a certain hospital. The same data set is displayed in each of the three histograms below.
NARRENDIf the data in a scatter diagram is scattered completely at random, what do you conclude?
A)There is no linear relationship between X and Y.
B)There is a strong linear relationship between X and Y.
C)There is a strong linear relationship between X and Y that is described by a horizontal (flat) line.
D)None of these choices.
Question
NARRBEGIN: Home Care
Home Care
Data are collected on the number of house calls (x) made in a given week by each of 60 nurses in a certain hospital. The same data set is displayed in each of the three histograms below. NARREND
Data for calories and salt content (milligrams of sodium) in 17 brands of meat hot dogs are shown in the scatter diagram below. According to this diagram, it appears that hot dogs that are high in sodium are generally low in calories, and hot dogs with low sodium are generally high in calories.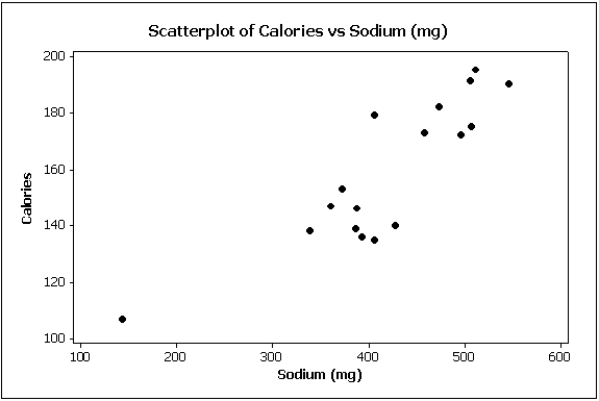
Home Care
Data are collected on the number of house calls (x) made in a given week by each of 60 nurses in a certain hospital. The same data set is displayed in each of the three histograms below.
NARRENDData for calories and salt content (milligrams of sodium) in 17 brands of meat hot dogs are shown in the scatter diagram below. According to this diagram, it appears that hot dogs that are high in sodium are generally low in calories, and hot dogs with low sodium are generally high in calories.
Question
NARRBEGIN: Home Care
Home Care
Data are collected on the number of house calls (x) made in a given week by each of 60 nurses in a certain hospital. The same data set is displayed in each of the three histograms below. NARREND
When two variables are linearly related, and tend to move in opposite directions, we describe the nature of their association as a negative linear relationship.
Home Care
Data are collected on the number of house calls (x) made in a given week by each of 60 nurses in a certain hospital. The same data set is displayed in each of the three histograms below.
NARRENDWhen two variables are linearly related, and tend to move in opposite directions, we describe the nature of their association as a negative linear relationship.
Question
NARRBEGIN: Home Care
Home Care
Data are collected on the number of house calls (x) made in a given week by each of 60 nurses in a certain hospital. The same data set is displayed in each of the three histograms below. NARREND
Which of the following statements is false?
A)You can examine the relationship between two nominal variables using a cross-classification table.
B)You can only apply statistical techniques to one variable at a time.
C)You can examine the relationship between two interval variables using a scatter diagram.
D)None of these choices.
Home Care
Data are collected on the number of house calls (x) made in a given week by each of 60 nurses in a certain hospital. The same data set is displayed in each of the three histograms below.
NARRENDWhich of the following statements is false?
A)You can examine the relationship between two nominal variables using a cross-classification table.
B)You can only apply statistical techniques to one variable at a time.
C)You can examine the relationship between two interval variables using a scatter diagram.
D)None of these choices.
Question
NARRBEGIN: Home Care
Home Care
Data are collected on the number of house calls (x) made in a given week by each of 60 nurses in a certain hospital. The same data set is displayed in each of the three histograms below. NARREND
In order to draw a scatter diagram, we need interval data for
A)one variable
B)two variables
C)three variables
D)four variables
Home Care
Data are collected on the number of house calls (x) made in a given week by each of 60 nurses in a certain hospital. The same data set is displayed in each of the three histograms below.
NARRENDIn order to draw a scatter diagram, we need interval data for
A)one variable
B)two variables
C)three variables
D)four variables
Question
NARRBEGIN: Home Care
Home Care
Data are collected on the number of house calls (x) made in a given week by each of 60 nurses in a certain hospital. The same data set is displayed in each of the three histograms below. NARREND
The two most important characteristics to examine in a scatter diagram are the number of possible categories for X and Y and the number of observations in each category.
Home Care
Data are collected on the number of house calls (x) made in a given week by each of 60 nurses in a certain hospital. The same data set is displayed in each of the three histograms below.
NARRENDThe two most important characteristics to examine in a scatter diagram are the number of possible categories for X and Y and the number of observations in each category.
Question
NARRBEGIN: Home Care
Home Care
Data are collected on the number of house calls (x) made in a given week by each of 60 nurses in a certain hospital. The same data set is displayed in each of the three histograms below. NARREND
How do you determine whether two interval variables have a positive linear relationship?
A)Most of the points fall close to a straight line with positive slope.
B)As the X variable increases, the Y variable increases in a linear way.
C)The scatter diagram shows a linear pattern that is going uphill.
D)All of these choices are true.
Home Care
Data are collected on the number of house calls (x) made in a given week by each of 60 nurses in a certain hospital. The same data set is displayed in each of the three histograms below.
NARRENDHow do you determine whether two interval variables have a positive linear relationship?
A)Most of the points fall close to a straight line with positive slope.
B)As the X variable increases, the Y variable increases in a linear way.
C)The scatter diagram shows a linear pattern that is going uphill.
D)All of these choices are true.
Question
NARRBEGIN: Home Care
Home Care
Data are collected on the number of house calls (x) made in a given week by each of 60 nurses in a certain hospital. The same data set is displayed in each of the three histograms below. NARREND
When two variables tend to move in opposite directions, yet still form a linear pattern, how do you describe their relationship?
A)A positive linear relationship.
B)A negative linear relationship.
C)A proportional inverse relationship.
D)None of these choices.
Home Care
Data are collected on the number of house calls (x) made in a given week by each of 60 nurses in a certain hospital. The same data set is displayed in each of the three histograms below.
NARRENDWhen two variables tend to move in opposite directions, yet still form a linear pattern, how do you describe their relationship?
A)A positive linear relationship.
B)A negative linear relationship.
C)A proportional inverse relationship.
D)None of these choices.
Question
NARRBEGIN: Home Care
Home Care
Data are collected on the number of house calls (x) made in a given week by each of 60 nurses in a certain hospital. The same data set is displayed in each of the three histograms below. NARREND
The relationship between two interval variables is graphically displayed by a
A)scatter diagram
B)histogram
C)bar chart
D)pie chart
Home Care
Data are collected on the number of house calls (x) made in a given week by each of 60 nurses in a certain hospital. The same data set is displayed in each of the three histograms below.
NARRENDThe relationship between two interval variables is graphically displayed by a
A)scatter diagram
B)histogram
C)bar chart
D)pie chart
Question
NARRBEGIN: Home Care
Home Care
Data are collected on the number of house calls (x) made in a given week by each of 60 nurses in a certain hospital. The same data set is displayed in each of the three histograms below. NARREND
The graphical technique used to describe the relationship between two interval variables is the scatter diagram.
Home Care
Data are collected on the number of house calls (x) made in a given week by each of 60 nurses in a certain hospital. The same data set is displayed in each of the three histograms below.
NARRENDThe graphical technique used to describe the relationship between two interval variables is the scatter diagram.
Question
NARRBEGIN: Home Care
Home Care
Data are collected on the number of house calls (x) made in a given week by each of 60 nurses in a certain hospital. The same data set is displayed in each of the three histograms below. NARREND
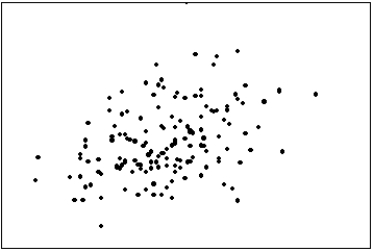
The first scatter diagram below shows a stronger linear relationship than the second scatter diagram. (Assume the scales on both scatter diagrams are the same.)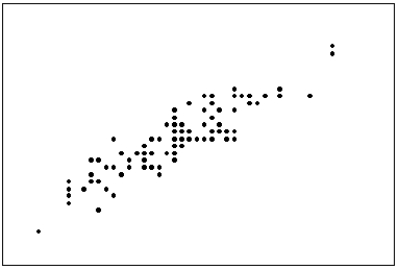
Home Care
Data are collected on the number of house calls (x) made in a given week by each of 60 nurses in a certain hospital. The same data set is displayed in each of the three histograms below.
NARRENDThe first scatter diagram below shows a stronger linear relationship than the second scatter diagram. (Assume the scales on both scatter diagrams are the same.)
Question
NARRBEGIN: Home Care
Home Care
Data are collected on the number of house calls (x) made in a given week by each of 60 nurses in a certain hospital. The same data set is displayed in each of the three histograms below. NARREND
Which of the following describes a positive linear relationship between X and Y?
A)As the X values increase, the Y values increase in a linear manner.
B)As the X values decrease, the Y values decrease in a linear manner.
C)The X and Y values move uphill together in a linear manner.
D)All of these choices are true.
Home Care
Data are collected on the number of house calls (x) made in a given week by each of 60 nurses in a certain hospital. The same data set is displayed in each of the three histograms below.
NARRENDWhich of the following describes a positive linear relationship between X and Y?
A)As the X values increase, the Y values increase in a linear manner.
B)As the X values decrease, the Y values decrease in a linear manner.
C)The X and Y values move uphill together in a linear manner.
D)All of these choices are true.
Question
NARRBEGIN: Home Care
Home Care
Data are collected on the number of house calls (x) made in a given week by each of 60 nurses in a certain hospital. The same data set is displayed in each of the three histograms below. NARREND
If two variables have a strong linear relationship, that means one variable is causing the other variable to go up or down.
Home Care
Data are collected on the number of house calls (x) made in a given week by each of 60 nurses in a certain hospital. The same data set is displayed in each of the three histograms below.
NARRENDIf two variables have a strong linear relationship, that means one variable is causing the other variable to go up or down.
Question
NARRBEGIN: Home Care
Home Care
Data are collected on the number of house calls (x) made in a given week by each of 60 nurses in a certain hospital. The same data set is displayed in each of the three histograms below. NARREND
Correlation implies causation.
Home Care
Data are collected on the number of house calls (x) made in a given week by each of 60 nurses in a certain hospital. The same data set is displayed in each of the three histograms below.
NARRENDCorrelation implies causation.
Question
NARRBEGIN: Home Care
Home Care
Data are collected on the number of house calls (x) made in a given week by each of 60 nurses in a certain hospital. The same data set is displayed in each of the three histograms below. NARREND
The two most important characteristics revealed by the scatter diagram are the strength and direction of the linear relationship.
Home Care
Data are collected on the number of house calls (x) made in a given week by each of 60 nurses in a certain hospital. The same data set is displayed in each of the three histograms below.
NARRENDThe two most important characteristics revealed by the scatter diagram are the strength and direction of the linear relationship.
Question
NARRBEGIN: Home Care
Home Care
Data are collected on the number of house calls (x) made in a given week by each of 60 nurses in a certain hospital. The same data set is displayed in each of the three histograms below. NARREND
In applications involving two variables, X and Y, where one variable depends to some degree on the other, we call Y the ____________________ variable.
Home Care
Data are collected on the number of house calls (x) made in a given week by each of 60 nurses in a certain hospital. The same data set is displayed in each of the three histograms below.
NARRENDIn applications involving two variables, X and Y, where one variable depends to some degree on the other, we call Y the ____________________ variable.
Question
NARRBEGIN: Home Care
Home Care
Data are collected on the number of house calls (x) made in a given week by each of 60 nurses in a certain hospital. The same data set is displayed in each of the three histograms below. NARREND
The scatter diagram below depicts data with a negative linear relationship.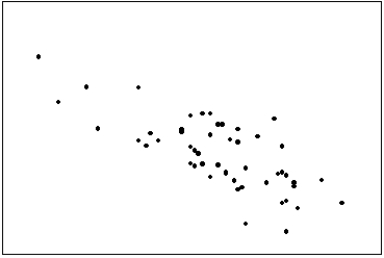
Home Care
Data are collected on the number of house calls (x) made in a given week by each of 60 nurses in a certain hospital. The same data set is displayed in each of the three histograms below.
NARRENDThe scatter diagram below depicts data with a negative linear relationship.
Question
NARRBEGIN: Home Care
Home Care
Data are collected on the number of house calls (x) made in a given week by each of 60 nurses in a certain hospital. The same data set is displayed in each of the three histograms below. NARREND
It is speculated that the number of police officers has a negative linear relationship with number of crimes. Explain why this might be so.
Home Care
Data are collected on the number of house calls (x) made in a given week by each of 60 nurses in a certain hospital. The same data set is displayed in each of the three histograms below.
NARRENDIt is speculated that the number of police officers has a negative linear relationship with number of crimes. Explain why this might be so.
Question
NARRBEGIN: Home Care
Home Care
Data are collected on the number of house calls (x) made in a given week by each of 60 nurses in a certain hospital. The same data set is displayed in each of the three histograms below. NARREND
The line chart below shows cucumber prices fluctuated from $2.00 per pound to over $4.50 per pound during the year.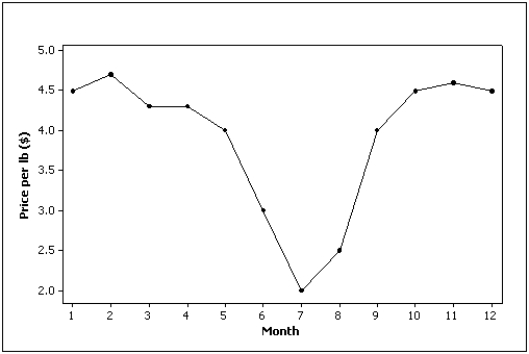
Home Care
Data are collected on the number of house calls (x) made in a given week by each of 60 nurses in a certain hospital. The same data set is displayed in each of the three histograms below.
NARRENDThe line chart below shows cucumber prices fluctuated from $2.00 per pound to over $4.50 per pound during the year.
Question
NARRBEGIN: Home Care
Home Care
Data are collected on the number of house calls (x) made in a given week by each of 60 nurses in a certain hospital. The same data set is displayed in each of the three histograms below. NARREND
A line chart is created by plotting the values of the variable on the vertical axis and the time periods on the horizontal axis.
Home Care
Data are collected on the number of house calls (x) made in a given week by each of 60 nurses in a certain hospital. The same data set is displayed in each of the three histograms below.
NARRENDA line chart is created by plotting the values of the variable on the vertical axis and the time periods on the horizontal axis.
Question
NARRBEGIN: Home Care
Home Care
Data are collected on the number of house calls (x) made in a given week by each of 60 nurses in a certain hospital. The same data set is displayed in each of the three histograms below. NARREND
A department store's monthly sales (in thousands of dollars) for the last year were as follows. A histogram should be used to present these data.
Home Care
Data are collected on the number of house calls (x) made in a given week by each of 60 nurses in a certain hospital. The same data set is displayed in each of the three histograms below.
NARRENDA department store's monthly sales (in thousands of dollars) for the last year were as follows. A histogram should be used to present these data.
Question
NARRBEGIN: Home Care
Home Care
Data are collected on the number of house calls (x) made in a given week by each of 60 nurses in a certain hospital. The same data set is displayed in each of the three histograms below. NARREND
A(n) ____________________ is a graphical display consisting of a set of points, each point representing one variable measured along the horizontal axis, and another variable measured along the vertical axis.
Home Care
Data are collected on the number of house calls (x) made in a given week by each of 60 nurses in a certain hospital. The same data set is displayed in each of the three histograms below.
NARRENDA(n) ____________________ is a graphical display consisting of a set of points, each point representing one variable measured along the horizontal axis, and another variable measured along the vertical axis.
Question
NARRBEGIN: Home Care
Home Care
Data are collected on the number of house calls (x) made in a given week by each of 60 nurses in a certain hospital. The same data set is displayed in each of the three histograms below. NARREND
If when one variable increases the other one also increases, we say that there is a(n) ____________________ relationship between these two variables.
Home Care
Data are collected on the number of house calls (x) made in a given week by each of 60 nurses in a certain hospital. The same data set is displayed in each of the three histograms below.
NARRENDIf when one variable increases the other one also increases, we say that there is a(n) ____________________ relationship between these two variables.
Question
NARRBEGIN: Home Care
Home Care
Data are collected on the number of house calls (x) made in a given week by each of 60 nurses in a certain hospital. The same data set is displayed in each of the three histograms below. NARREND
In applications involving two variables, X and Y, where one variable depends to some degree on the other, we call X the ____________________ variable.
Home Care
Data are collected on the number of house calls (x) made in a given week by each of 60 nurses in a certain hospital. The same data set is displayed in each of the three histograms below.
NARRENDIn applications involving two variables, X and Y, where one variable depends to some degree on the other, we call X the ____________________ variable.
Question
NARRBEGIN: Home Care
Home Care
Data are collected on the number of house calls (x) made in a given week by each of 60 nurses in a certain hospital. The same data set is displayed in each of the three histograms below. NARREND
The line chart below shows tomato prices each month from January (month 1) to December last year ($ per pound). By looking at this chart you can see the lowest tomato prices occurred in July.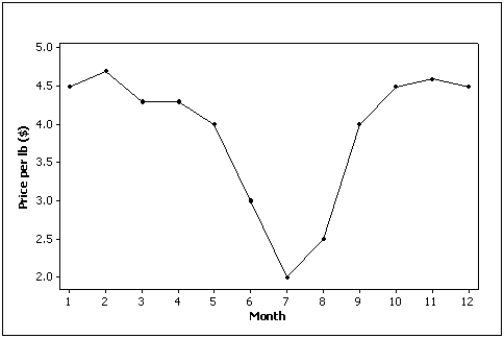
Home Care
Data are collected on the number of house calls (x) made in a given week by each of 60 nurses in a certain hospital. The same data set is displayed in each of the three histograms below.
NARRENDThe line chart below shows tomato prices each month from January (month 1) to December last year ($ per pound). By looking at this chart you can see the lowest tomato prices occurred in July.
Question
NARRBEGIN: Home Care
Home Care
Data are collected on the number of house calls (x) made in a given week by each of 60 nurses in a certain hospital. The same data set is displayed in each of the three histograms below. NARREND
The number of houses sold in Miami Springs and the average monthly mortgage rates for 18 months randomly selected between January 2011 and April 2013 are shown in the following table.
a.Draw a scatter diagram with the number of houses sold on the vertical axis.
b.Describe the relationship between mortgage rate and number of houses sold.
Home Care
Data are collected on the number of house calls (x) made in a given week by each of 60 nurses in a certain hospital. The same data set is displayed in each of the three histograms below.
NARRENDThe number of houses sold in Miami Springs and the average monthly mortgage rates for 18 months randomly selected between January 2011 and April 2013 are shown in the following table.
a.Draw a scatter diagram with the number of houses sold on the vertical axis.
b.Describe the relationship between mortgage rate and number of houses sold.
Question
NARRBEGIN: Home Care
Home Care
Data are collected on the number of house calls (x) made in a given week by each of 60 nurses in a certain hospital. The same data set is displayed in each of the three histograms below. NARREND
A line chart that is flat shows no fluctuation in the variable being presented.
Home Care
Data are collected on the number of house calls (x) made in a given week by each of 60 nurses in a certain hospital. The same data set is displayed in each of the three histograms below.
NARRENDA line chart that is flat shows no fluctuation in the variable being presented.
Question
NARRBEGIN: Home Care
Home Care
Data are collected on the number of house calls (x) made in a given week by each of 60 nurses in a certain hospital. The same data set is displayed in each of the three histograms below. NARREND
One of the variables used to help predict unemployment rates is the rate of inflation. Accordingly, we identify rate of inflation as the ____________________ variable, and unemployment rate as the ____________________ variable.
Home Care
Data are collected on the number of house calls (x) made in a given week by each of 60 nurses in a certain hospital. The same data set is displayed in each of the three histograms below.
NARRENDOne of the variables used to help predict unemployment rates is the rate of inflation. Accordingly, we identify rate of inflation as the ____________________ variable, and unemployment rate as the ____________________ variable.
Question
NARRBEGIN: Home Care
Home Care
Data are collected on the number of house calls (x) made in a given week by each of 60 nurses in a certain hospital. The same data set is displayed in each of the three histograms below. NARREND
An individual's income depends somewhat on their number of years of education. Accordingly, we identify income as the ____________________ variable, and years of education as the ____________________ variable.
Home Care
Data are collected on the number of house calls (x) made in a given week by each of 60 nurses in a certain hospital. The same data set is displayed in each of the three histograms below.
NARRENDAn individual's income depends somewhat on their number of years of education. Accordingly, we identify income as the ____________________ variable, and years of education as the ____________________ variable.
Question
NARRBEGIN: Home Care
Home Care
Data are collected on the number of house calls (x) made in a given week by each of 60 nurses in a certain hospital. The same data set is displayed in each of the three histograms below. NARREND
What are the two most important characteristics to look for in a scatter diagram?
Home Care
Data are collected on the number of house calls (x) made in a given week by each of 60 nurses in a certain hospital. The same data set is displayed in each of the three histograms below.
NARRENDWhat are the two most important characteristics to look for in a scatter diagram?
Question
NARRBEGIN: Home Care
Home Care
Data are collected on the number of house calls (x) made in a given week by each of 60 nurses in a certain hospital. The same data set is displayed in each of the three histograms below. NARREND
An economics professor wants to study the relationship between income and education. A sample of 10 individuals is selected at random, and their income (in thousands of dollars) and education (in years) are shown below:

a.Draw a scatter diagram for these data with the income on the vertical axis.
b.Describe the relationship between income and education.
Home Care
Data are collected on the number of house calls (x) made in a given week by each of 60 nurses in a certain hospital. The same data set is displayed in each of the three histograms below.
NARRENDAn economics professor wants to study the relationship between income and education. A sample of 10 individuals is selected at random, and their income (in thousands of dollars) and education (in years) are shown below:
a.Draw a scatter diagram for these data with the income on the vertical axis.
b.Describe the relationship between income and education.
Question
NARRBEGIN: Home Care
Home Care
Data are collected on the number of house calls (x) made in a given week by each of 60 nurses in a certain hospital. The same data set is displayed in each of the three histograms below. NARREND
The two most important characteristics to look for in a scatter diagram are the ____________________ and ____________________ of the linear relationship.
Home Care
Data are collected on the number of house calls (x) made in a given week by each of 60 nurses in a certain hospital. The same data set is displayed in each of the three histograms below.
NARRENDThe two most important characteristics to look for in a scatter diagram are the ____________________ and ____________________ of the linear relationship.
Question
NARRBEGIN: Home Care
Home Care
Data are collected on the number of house calls (x) made in a given week by each of 60 nurses in a certain hospital. The same data set is displayed in each of the three histograms below. NARREND
Time series data are often graphically depicted on a line chart, which is a plot of the variable of interest over time.
Home Care
Data are collected on the number of house calls (x) made in a given week by each of 60 nurses in a certain hospital. The same data set is displayed in each of the three histograms below.
NARRENDTime series data are often graphically depicted on a line chart, which is a plot of the variable of interest over time.
Question
NARRBEGIN: Home Care
Home Care
Data are collected on the number of house calls (x) made in a given week by each of 60 nurses in a certain hospital. The same data set is displayed in each of the three histograms below. NARREND
Can a scatter diagram be used to explore the relationship between two nominal variables? Explain why or why not.
Home Care
Data are collected on the number of house calls (x) made in a given week by each of 60 nurses in a certain hospital. The same data set is displayed in each of the three histograms below.
NARRENDCan a scatter diagram be used to explore the relationship between two nominal variables? Explain why or why not.
Question
NARRBEGIN: Home Care
Home Care
Data are collected on the number of house calls (x) made in a given week by each of 60 nurses in a certain hospital. The same data set is displayed in each of the three histograms below. NARREND
Briefly explain the difference between correlation and causation in terms of a relationship between X and Y.
Home Care
Data are collected on the number of house calls (x) made in a given week by each of 60 nurses in a certain hospital. The same data set is displayed in each of the three histograms below.
NARRENDBriefly explain the difference between correlation and causation in terms of a relationship between X and Y.
Question
NARRBEGIN: Home Care
Home Care
Data are collected on the number of house calls (x) made in a given week by each of 60 nurses in a certain hospital. The same data set is displayed in each of the three histograms below. NARREND
When one variable increases and the other decreases, we say that there is a(n) ____________________ relationship between these two variables.
Home Care
Data are collected on the number of house calls (x) made in a given week by each of 60 nurses in a certain hospital. The same data set is displayed in each of the three histograms below.
NARRENDWhen one variable increases and the other decreases, we say that there is a(n) ____________________ relationship between these two variables.
Question
NARRBEGIN: Home Care
Home Care
Data are collected on the number of house calls (x) made in a given week by each of 60 nurses in a certain hospital. The same data set is displayed in each of the three histograms below. NARREND
The graph below represents a line graph.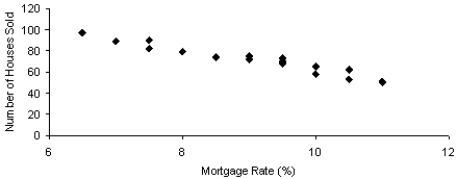
Home Care
Data are collected on the number of house calls (x) made in a given week by each of 60 nurses in a certain hospital. The same data set is displayed in each of the three histograms below.
NARRENDThe graph below represents a line graph.
Question
NARRBEGIN: Home Care
Home Care
Data are collected on the number of house calls (x) made in a given week by each of 60 nurses in a certain hospital. The same data set is displayed in each of the three histograms below. NARREND
Observations that are measured at the same time are called ____________________ data.
Home Care
Data are collected on the number of house calls (x) made in a given week by each of 60 nurses in a certain hospital. The same data set is displayed in each of the three histograms below.
NARRENDObservations that are measured at the same time are called ____________________ data.
Question
NARRBEGIN: Home Care
Home Care
Data are collected on the number of house calls (x) made in a given week by each of 60 nurses in a certain hospital. The same data set is displayed in each of the three histograms below. NARREND
The intervals (classes) in a histogram do not overlap.
Home Care
Data are collected on the number of house calls (x) made in a given week by each of 60 nurses in a certain hospital. The same data set is displayed in each of the three histograms below.
NARRENDThe intervals (classes) in a histogram do not overlap.
Question
NARRBEGIN: Home Care
Home Care
Data are collected on the number of house calls (x) made in a given week by each of 60 nurses in a certain hospital. The same data set is displayed in each of the three histograms below. NARREND
Which of the following represents time-series data?
A)The length of time each of the top 100 stocks have been available on the NYSE.
B)The most popular time of year that people purchase the top 100 stocks on the NYSE.
C)The value of the #1 stock on the NYSE each month over a one-year period.
D)All of these choices are true.
Home Care
Data are collected on the number of house calls (x) made in a given week by each of 60 nurses in a certain hospital. The same data set is displayed in each of the three histograms below.
NARRENDWhich of the following represents time-series data?
A)The length of time each of the top 100 stocks have been available on the NYSE.
B)The most popular time of year that people purchase the top 100 stocks on the NYSE.
C)The value of the #1 stock on the NYSE each month over a one-year period.
D)All of these choices are true.
Question
NARRBEGIN: Home Care
Home Care
Data are collected on the number of house calls (x) made in a given week by each of 60 nurses in a certain hospital. The same data set is displayed in each of the three histograms below. NARREND
Observations that are measured at the same time represent what type of data?
A)Time-series data
B)Cross-sectional data
C)Synchronous data
D)None of these choices.
Home Care
Data are collected on the number of house calls (x) made in a given week by each of 60 nurses in a certain hospital. The same data set is displayed in each of the three histograms below.
NARRENDObservations that are measured at the same time represent what type of data?
A)Time-series data
B)Cross-sectional data
C)Synchronous data
D)None of these choices.
Question
NARRBEGIN: Home Care
Home Care
Data are collected on the number of house calls (x) made in a given week by each of 60 nurses in a certain hospital. The same data set is displayed in each of the three histograms below. NARREND
Time series data are often graphically depicted on a(n) ____________________, which is a plot of the variable of interest over time.
Home Care
Data are collected on the number of house calls (x) made in a given week by each of 60 nurses in a certain hospital. The same data set is displayed in each of the three histograms below.
NARRENDTime series data are often graphically depicted on a(n) ____________________, which is a plot of the variable of interest over time.
Question
NARRBEGIN: Home Care
Home Care
Data are collected on the number of house calls (x) made in a given week by each of 60 nurses in a certain hospital. The same data set is displayed in each of the three histograms below. NARREND
The intervals (classes) in a histogram are equally wide.
Home Care
Data are collected on the number of house calls (x) made in a given week by each of 60 nurses in a certain hospital. The same data set is displayed in each of the three histograms below.
NARRENDThe intervals (classes) in a histogram are equally wide.
Question
NARRBEGIN: Home Care
Home Care
Data are collected on the number of house calls (x) made in a given week by each of 60 nurses in a certain hospital. The same data set is displayed in each of the three histograms below. NARREND
Explain the difference between a histogram and a line chart.
Home Care
Data are collected on the number of house calls (x) made in a given week by each of 60 nurses in a certain hospital. The same data set is displayed in each of the three histograms below.
NARRENDExplain the difference between a histogram and a line chart.
Question
NARRBEGIN: Home Care
Home Care
Data are collected on the number of house calls (x) made in a given week by each of 60 nurses in a certain hospital. The same data set is displayed in each of the three histograms below. NARREND
Which of the following statements describes a line chart?
A)A line chart is a graph of time-series data.
B)A line chart is a plot of a variable over time.
C)The horizontal axis of a line chart contains time periods.
D)All of these choices are true.
Home Care
Data are collected on the number of house calls (x) made in a given week by each of 60 nurses in a certain hospital. The same data set is displayed in each of the three histograms below.
NARRENDWhich of the following statements describes a line chart?
A)A line chart is a graph of time-series data.
B)A line chart is a plot of a variable over time.
C)The horizontal axis of a line chart contains time periods.
D)All of these choices are true.
Question
NARRBEGIN: Home Care
Home Care
Data are collected on the number of house calls (x) made in a given week by each of 60 nurses in a certain hospital. The same data set is displayed in each of the three histograms below. NARREND
Briefly discuss the difference between cross-sectional data and time-series data.
Home Care
Data are collected on the number of house calls (x) made in a given week by each of 60 nurses in a certain hospital. The same data set is displayed in each of the three histograms below.
NARRENDBriefly discuss the difference between cross-sectional data and time-series data.
Question
NARRBEGIN: Home Care
Home Care
Data are collected on the number of house calls (x) made in a given week by each of 60 nurses in a certain hospital. The same data set is displayed in each of the three histograms below. NARREND
Observations that are measured at successive points in time is what type of data?
A)Time-series data
B)Cross-sectional data
C)Successive data
D)None of these choices.
Home Care
Data are collected on the number of house calls (x) made in a given week by each of 60 nurses in a certain hospital. The same data set is displayed in each of the three histograms below.
NARRENDObservations that are measured at successive points in time is what type of data?
A)Time-series data
B)Cross-sectional data
C)Successive data
D)None of these choices.
Question
NARRBEGIN: Home Care
Home Care
Data are collected on the number of house calls (x) made in a given week by each of 60 nurses in a certain hospital. The same data set is displayed in each of the three histograms below. NARREND
A line chart is created by plotting the value of the variable on the ____________________ axis and the time periods on the ____________________ axis.
Home Care
Data are collected on the number of house calls (x) made in a given week by each of 60 nurses in a certain hospital. The same data set is displayed in each of the three histograms below.
NARRENDA line chart is created by plotting the value of the variable on the ____________________ axis and the time periods on the ____________________ axis.
Question
NARRBEGIN: Home Care
Home Care
Data are collected on the number of house calls (x) made in a given week by each of 60 nurses in a certain hospital. The same data set is displayed in each of the three histograms below. NARREND
Observations that are taken during successive points in time are called ____________________ data.
Home Care
Data are collected on the number of house calls (x) made in a given week by each of 60 nurses in a certain hospital. The same data set is displayed in each of the three histograms below.
NARRENDObservations that are taken during successive points in time are called ____________________ data.
Question
NARRBEGIN: Home Care
Home Care
Data are collected on the number of house calls (x) made in a given week by each of 60 nurses in a certain hospital. The same data set is displayed in each of the three histograms below. NARREND
What kind(s) of data can be depicted by a line chart?
A)Frequencies of an interval over time.
B)Frequencies of a nominal variable over time.
C)Relative frequencies of a nominal variable over time.
D)All of these choices are true.
Home Care
Data are collected on the number of house calls (x) made in a given week by each of 60 nurses in a certain hospital. The same data set is displayed in each of the three histograms below.
NARRENDWhat kind(s) of data can be depicted by a line chart?
A)Frequencies of an interval over time.
B)Frequencies of a nominal variable over time.
C)Relative frequencies of a nominal variable over time.
D)All of these choices are true.
Question
NARRBEGIN: Home Care
Home Care
Data are collected on the number of house calls (x) made in a given week by each of 60 nurses in a certain hospital. The same data set is displayed in each of the three histograms below. NARREND
Beef prices throughout the year (month 1 = January) are shown in the line chart below (per pound). Describe beef prices for this given year using this line chart.
Home Care
Data are collected on the number of house calls (x) made in a given week by each of 60 nurses in a certain hospital. The same data set is displayed in each of the three histograms below.
NARRENDBeef prices throughout the year (month 1 = January) are shown in the line chart below (per pound). Describe beef prices for this given year using this line chart.
Question
NARRBEGIN: Home Care
Home Care
Data are collected on the number of house calls (x) made in a given week by each of 60 nurses in a certain hospital. The same data set is displayed in each of the three histograms below. NARREND
Time-series data are often graphically depicted how?
A)Bar chart
B)Histogram
C)Line chart
D)All of these choices are true.
Home Care
Data are collected on the number of house calls (x) made in a given week by each of 60 nurses in a certain hospital. The same data set is displayed in each of the three histograms below.
NARRENDTime-series data are often graphically depicted how?
A)Bar chart
B)Histogram
C)Line chart
D)All of these choices are true.
Question
NARRBEGIN: Home Care
Home Care
Data are collected on the number of house calls (x) made in a given week by each of 60 nurses in a certain hospital. The same data set is displayed in each of the three histograms below. NARREND
A(n) ____________________ is created by plotting the value of the variable on the vertical axis and the time periods on the horizontal axis.
Home Care
Data are collected on the number of house calls (x) made in a given week by each of 60 nurses in a certain hospital. The same data set is displayed in each of the three histograms below.
NARRENDA(n) ____________________ is created by plotting the value of the variable on the vertical axis and the time periods on the horizontal axis.
Question
NARRBEGIN: Home Care
Home Care
Data are collected on the number of house calls (x) made in a given week by each of 60 nurses in a certain hospital. The same data set is displayed in each of the three histograms below. NARREND
The line chart below shows potato prices per pound for each month from January (month 1) to December last year. By looking at this chart you can see the lowest potato prices occurred in ____________________.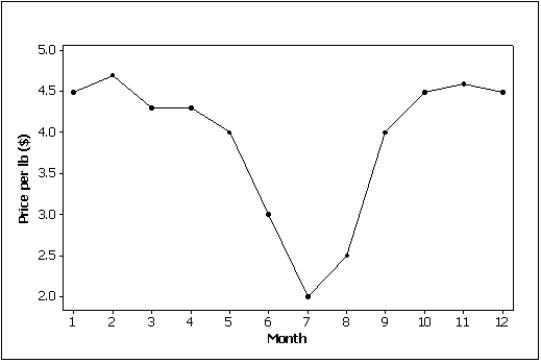
Home Care
Data are collected on the number of house calls (x) made in a given week by each of 60 nurses in a certain hospital. The same data set is displayed in each of the three histograms below.
NARRENDThe line chart below shows potato prices per pound for each month from January (month 1) to December last year. By looking at this chart you can see the lowest potato prices occurred in ____________________.
Question
NARRBEGIN: Home Care
Home Care
Data are collected on the number of house calls (x) made in a given week by each of 60 nurses in a certain hospital. The same data set is displayed in each of the three histograms below. NARREND
What type of graph depicts the data below?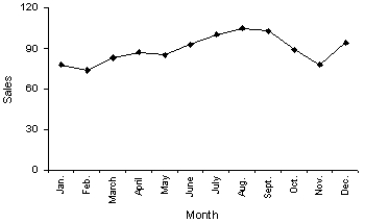
A)A line chart
B)A histogram
C)A dot plot
D)A bar chart
Home Care
Data are collected on the number of house calls (x) made in a given week by each of 60 nurses in a certain hospital. The same data set is displayed in each of the three histograms below.
NARRENDWhat type of graph depicts the data below?
A)A line chart
B)A histogram
C)A dot plot
D)A bar chart
Question
NARRBEGIN: Home Care
Home Care
Data are collected on the number of house calls (x) made in a given week by each of 60 nurses in a certain hospital. The same data set is displayed in each of the three histograms below. NARREND
Which of the following statements describe(s) the line chart below?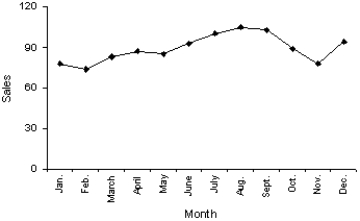
A)November experienced the lowest sales throughout the year.
B)August experienced the highest sales throughout the year.
C)Sales did not fluctuate more than 30 units on either side of 90.
D)All of these choices are true.
Home Care
Data are collected on the number of house calls (x) made in a given week by each of 60 nurses in a certain hospital. The same data set is displayed in each of the three histograms below.
NARRENDWhich of the following statements describe(s) the line chart below?
A)November experienced the lowest sales throughout the year.
B)August experienced the highest sales throughout the year.
C)Sales did not fluctuate more than 30 units on either side of 90.
D)All of these choices are true.
Question
NARRBEGIN: Home Care
Home Care
Data are collected on the number of house calls (x) made in a given week by each of 60 nurses in a certain hospital. The same data set is displayed in each of the three histograms below. NARREND
In a histogram, each observation is assigned to one or more classes.
Home Care
Data are collected on the number of house calls (x) made in a given week by each of 60 nurses in a certain hospital. The same data set is displayed in each of the three histograms below.
NARRENDIn a histogram, each observation is assigned to one or more classes.
Question
NARRBEGIN: Home Care
Home Care
Data are collected on the number of house calls (x) made in a given week by each of 60 nurses in a certain hospital. The same data set is displayed in each of the three histograms below. NARREND
The number of observations within each class may be found in a frequency distribution.
Home Care
Data are collected on the number of house calls (x) made in a given week by each of 60 nurses in a certain hospital. The same data set is displayed in each of the three histograms below.
NARRENDThe number of observations within each class may be found in a frequency distribution.
Question
NARRBEGIN: Home Care
Home Care
Data are collected on the number of house calls (x) made in a given week by each of 60 nurses in a certain hospital. The same data set is displayed in each of the three histograms below. NARREND
-According to the stem-and-leaf plot below, the median quiz score for this data set is 8.
Home Care
Data are collected on the number of house calls (x) made in a given week by each of 60 nurses in a certain hospital. The same data set is displayed in each of the three histograms below.
NARREND-According to the stem-and-leaf plot below, the median quiz score for this data set is 8.
Question
NARRBEGIN: Home Care
Home Care
Data are collected on the number of house calls (x) made in a given week by each of 60 nurses in a certain hospital. The same data set is displayed in each of the three histograms below. NARREND
A stem-and-leaf display represents nominal data.
Home Care
Data are collected on the number of house calls (x) made in a given week by each of 60 nurses in a certain hospital. The same data set is displayed in each of the three histograms below.
NARRENDA stem-and-leaf display represents nominal data.
Question
NARRBEGIN: Home Care
Home Care
Data are collected on the number of house calls (x) made in a given week by each of 60 nurses in a certain hospital. The same data set is displayed in each of the three histograms below. NARREND
A histogram is said to be symmetric if, when we draw a vertical line down the center of the histogram the two sides are nearly identical.
Home Care
Data are collected on the number of house calls (x) made in a given week by each of 60 nurses in a certain hospital. The same data set is displayed in each of the three histograms below.
NARRENDA histogram is said to be symmetric if, when we draw a vertical line down the center of the histogram the two sides are nearly identical.
Question
NARRBEGIN: Home Care
Home Care
Data are collected on the number of house calls (x) made in a given week by each of 60 nurses in a certain hospital. The same data set is displayed in each of the three histograms below. NARREND
-According to the stem-and-leaf plot below, this data set has a negative median.
Home Care
Data are collected on the number of house calls (x) made in a given week by each of 60 nurses in a certain hospital. The same data set is displayed in each of the three histograms below.
NARREND-According to the stem-and-leaf plot below, this data set has a negative median.
Question
NARRBEGIN: Home Care
Home Care
Data are collected on the number of house calls (x) made in a given week by each of 60 nurses in a certain hospital. The same data set is displayed in each of the three histograms below. NARREND
A modal class is the class with the largest number of observations.
Home Care
Data are collected on the number of house calls (x) made in a given week by each of 60 nurses in a certain hospital. The same data set is displayed in each of the three histograms below.
NARRENDA modal class is the class with the largest number of observations.
Question
NARRBEGIN: Home Care
Home Care
Data are collected on the number of house calls (x) made in a given week by each of 60 nurses in a certain hospital. The same data set is displayed in each of the three histograms below. NARREND
A relative frequency distribution describes the proportion of data values that fall within each category.
Home Care
Data are collected on the number of house calls (x) made in a given week by each of 60 nurses in a certain hospital. The same data set is displayed in each of the three histograms below.
NARRENDA relative frequency distribution describes the proportion of data values that fall within each category.
Question
NARRBEGIN: Home Care
Home Care
Data are collected on the number of house calls (x) made in a given week by each of 60 nurses in a certain hospital. The same data set is displayed in each of the three histograms below. NARREND
The advantage of a stem-and-leaf display over a histogram is that we can see the actual observations.
Home Care
Data are collected on the number of house calls (x) made in a given week by each of 60 nurses in a certain hospital. The same data set is displayed in each of the three histograms below.
NARRENDThe advantage of a stem-and-leaf display over a histogram is that we can see the actual observations.
Question
NARRBEGIN: Home Care
Home Care
Data are collected on the number of house calls (x) made in a given week by each of 60 nurses in a certain hospital. The same data set is displayed in each of the three histograms below. NARREND
When a distribution has more values to the right and tails to the left, we say it is skewed negatively.
Home Care
Data are collected on the number of house calls (x) made in a given week by each of 60 nurses in a certain hospital. The same data set is displayed in each of the three histograms below.
NARRENDWhen a distribution has more values to the right and tails to the left, we say it is skewed negatively.
Question
NARRBEGIN: Home Care
Home Care
Data are collected on the number of house calls (x) made in a given week by each of 60 nurses in a certain hospital. The same data set is displayed in each of the three histograms below. NARREND
The original observations cannot be determined once they are grouped into a frequency distribution.
Home Care
Data are collected on the number of house calls (x) made in a given week by each of 60 nurses in a certain hospital. The same data set is displayed in each of the three histograms below.
NARRENDThe original observations cannot be determined once they are grouped into a frequency distribution.
Question
NARRBEGIN: Home Care
Home Care
Data are collected on the number of house calls (x) made in a given week by each of 60 nurses in a certain hospital. The same data set is displayed in each of the three histograms below. NARREND
The sum of cumulative relative frequencies always equals 1.
Home Care
Data are collected on the number of house calls (x) made in a given week by each of 60 nurses in a certain hospital. The same data set is displayed in each of the three histograms below.
NARRENDThe sum of cumulative relative frequencies always equals 1.
Question
NARRBEGIN: Home Care
Home Care
Data are collected on the number of house calls (x) made in a given week by each of 60 nurses in a certain hospital. The same data set is displayed in each of the three histograms below. NARREND
-According to the stem-and-leaf plot below, this data set is symmetric.
Home Care
Data are collected on the number of house calls (x) made in a given week by each of 60 nurses in a certain hospital. The same data set is displayed in each of the three histograms below.
NARREND-According to the stem-and-leaf plot below, this data set is symmetric.
Question
NARRBEGIN: Home Care
Home Care
Data are collected on the number of house calls (x) made in a given week by each of 60 nurses in a certain hospital. The same data set is displayed in each of the three histograms below. NARREND
The sum of relative frequencies in a distribution always equals 1.
Home Care
Data are collected on the number of house calls (x) made in a given week by each of 60 nurses in a certain hospital. The same data set is displayed in each of the three histograms below.
NARRENDThe sum of relative frequencies in a distribution always equals 1.
Question
NARRBEGIN: Home Care
Home Care
Data are collected on the number of house calls (x) made in a given week by each of 60 nurses in a certain hospital. The same data set is displayed in each of the three histograms below. NARREND
The number of class intervals in a histogram depends on the number of observations in the data set.
Home Care
Data are collected on the number of house calls (x) made in a given week by each of 60 nurses in a certain hospital. The same data set is displayed in each of the three histograms below.
NARRENDThe number of class intervals in a histogram depends on the number of observations in the data set.
Question
NARRBEGIN: Home Care
Home Care
Data are collected on the number of house calls (x) made in a given week by each of 60 nurses in a certain hospital. The same data set is displayed in each of the three histograms below. NARREND
A stem-and-leaf display reveals more information about the original data than does a histogram.
Home Care
Data are collected on the number of house calls (x) made in a given week by each of 60 nurses in a certain hospital. The same data set is displayed in each of the three histograms below.
NARRENDA stem-and-leaf display reveals more information about the original data than does a histogram.
Question
NARRBEGIN: Home Care
Home Care
Data are collected on the number of house calls (x) made in a given week by each of 60 nurses in a certain hospital. The same data set is displayed in each of the three histograms below. NARREND
Experience shows that few students hand in their statistics exams early; most prefer to hand them in near the end of the test period. This means the time taken by students to write exams is positively skewed.
Home Care
Data are collected on the number of house calls (x) made in a given week by each of 60 nurses in a certain hospital. The same data set is displayed in each of the three histograms below.
NARRENDExperience shows that few students hand in their statistics exams early; most prefer to hand them in near the end of the test period. This means the time taken by students to write exams is positively skewed.
Question
NARRBEGIN: Home Care
Home Care
Data are collected on the number of house calls (x) made in a given week by each of 60 nurses in a certain hospital. The same data set is displayed in each of the three histograms below. NARREND
When a distribution has more values to the left and tails off to the right, it is skewed negatively.
Home Care
Data are collected on the number of house calls (x) made in a given week by each of 60 nurses in a certain hospital. The same data set is displayed in each of the three histograms below.
NARRENDWhen a distribution has more values to the left and tails off to the right, it is skewed negatively.
Question
NARRBEGIN: Home Care
Home Care
Data are collected on the number of house calls (x) made in a given week by each of 60 nurses in a certain hospital. The same data set is displayed in each of the three histograms below. NARREND
A histogram represents interval data.
Home Care
Data are collected on the number of house calls (x) made in a given week by each of 60 nurses in a certain hospital. The same data set is displayed in each of the three histograms below.
NARRENDA histogram represents interval data.
Question
NARRBEGIN: Home Care
Home Care
Data are collected on the number of house calls (x) made in a given week by each of 60 nurses in a certain hospital. The same data set is displayed in each of the three histograms below. NARREND
A skewed histogram is one with a long tail extending either to the right or left.
Home Care
Data are collected on the number of house calls (x) made in a given week by each of 60 nurses in a certain hospital. The same data set is displayed in each of the three histograms below.
NARRENDA skewed histogram is one with a long tail extending either to the right or left.
Question
NARRBEGIN: Home Care
Home Care
Data are collected on the number of house calls (x) made in a given week by each of 60 nurses in a certain hospital. The same data set is displayed in each of the three histograms below. NARREND
A cumulative relative frequency distribution lists the number of observations that lie below each of the class limits.
Home Care
Data are collected on the number of house calls (x) made in a given week by each of 60 nurses in a certain hospital. The same data set is displayed in each of the three histograms below.
NARRENDA cumulative relative frequency distribution lists the number of observations that lie below each of the class limits.

Unlock Deck
Sign up to unlock the cards in this deck!
Unlock Deck
Unlock Deck
1/140
Play
Full screen (f)
Deck 3: Graphical Descriptive Techniques II
1
NARRBEGIN: Home Care
Home Care
Data are collected on the number of house calls (x) made in a given week by each of 60 nurses in a certain hospital. The same data set is displayed in each of the three histograms below. NARREND
A professor examines the relationship between minutes studying and exam score (out of 200 points) for a random sample of his students. The scatter diagram is shown below. It appears that study time has somewhat of a positive linear relationship with exam score.
Home Care
Data are collected on the number of house calls (x) made in a given week by each of 60 nurses in a certain hospital. The same data set is displayed in each of the three histograms below.
NARRENDA professor examines the relationship between minutes studying and exam score (out of 200 points) for a random sample of his students. The scatter diagram is shown below. It appears that study time has somewhat of a positive linear relationship with exam score.
True
2
NARRBEGIN: Home Care
Home Care
Data are collected on the number of house calls (x) made in a given week by each of 60 nurses in a certain hospital. The same data set is displayed in each of the three histograms below. NARREND
Which of the following is the method statisticians use to draw the best fitting straight line through the data on a scatter diagram?
A)The fit best method.
B)The least squares method.
C)The point-intercept method.
D)None of these choices.
Home Care
Data are collected on the number of house calls (x) made in a given week by each of 60 nurses in a certain hospital. The same data set is displayed in each of the three histograms below.
NARRENDWhich of the following is the method statisticians use to draw the best fitting straight line through the data on a scatter diagram?
A)The fit best method.
B)The least squares method.
C)The point-intercept method.
D)None of these choices.
The least squares method.
3
NARRBEGIN: Home Care
Home Care
Data are collected on the number of house calls (x) made in a given week by each of 60 nurses in a certain hospital. The same data set is displayed in each of the three histograms below. NARREND
If we draw a straight line through the points in a scatter diagram and most of the points fall close to the line, there must be a positive relationship between the two variables.
Home Care
Data are collected on the number of house calls (x) made in a given week by each of 60 nurses in a certain hospital. The same data set is displayed in each of the three histograms below.
NARRENDIf we draw a straight line through the points in a scatter diagram and most of the points fall close to the line, there must be a positive relationship between the two variables.
False
4
NARRBEGIN: Home Care
Home Care
Data are collected on the number of house calls (x) made in a given week by each of 60 nurses in a certain hospital. The same data set is displayed in each of the three histograms below. NARREND
If the data in a scatter diagram is scattered completely at random, what do you conclude?
A)There is no linear relationship between X and Y.
B)There is a strong linear relationship between X and Y.
C)There is a strong linear relationship between X and Y that is described by a horizontal (flat) line.
D)None of these choices.
Home Care
Data are collected on the number of house calls (x) made in a given week by each of 60 nurses in a certain hospital. The same data set is displayed in each of the three histograms below.
NARRENDIf the data in a scatter diagram is scattered completely at random, what do you conclude?
A)There is no linear relationship between X and Y.
B)There is a strong linear relationship between X and Y.
C)There is a strong linear relationship between X and Y that is described by a horizontal (flat) line.
D)None of these choices.
Unlock Deck
Unlock for access to all 140 flashcards in this deck.
Unlock Deck
k this deck
5
NARRBEGIN: Home Care
Home Care
Data are collected on the number of house calls (x) made in a given week by each of 60 nurses in a certain hospital. The same data set is displayed in each of the three histograms below. NARREND
Data for calories and salt content (milligrams of sodium) in 17 brands of meat hot dogs are shown in the scatter diagram below. According to this diagram, it appears that hot dogs that are high in sodium are generally low in calories, and hot dogs with low sodium are generally high in calories.
Home Care
Data are collected on the number of house calls (x) made in a given week by each of 60 nurses in a certain hospital. The same data set is displayed in each of the three histograms below.
NARRENDData for calories and salt content (milligrams of sodium) in 17 brands of meat hot dogs are shown in the scatter diagram below. According to this diagram, it appears that hot dogs that are high in sodium are generally low in calories, and hot dogs with low sodium are generally high in calories.
Unlock Deck
Unlock for access to all 140 flashcards in this deck.
Unlock Deck
k this deck
6
NARRBEGIN: Home Care
Home Care
Data are collected on the number of house calls (x) made in a given week by each of 60 nurses in a certain hospital. The same data set is displayed in each of the three histograms below. NARREND
When two variables are linearly related, and tend to move in opposite directions, we describe the nature of their association as a negative linear relationship.
Home Care
Data are collected on the number of house calls (x) made in a given week by each of 60 nurses in a certain hospital. The same data set is displayed in each of the three histograms below.
NARRENDWhen two variables are linearly related, and tend to move in opposite directions, we describe the nature of their association as a negative linear relationship.
Unlock Deck
Unlock for access to all 140 flashcards in this deck.
Unlock Deck
k this deck
7
NARRBEGIN: Home Care
Home Care
Data are collected on the number of house calls (x) made in a given week by each of 60 nurses in a certain hospital. The same data set is displayed in each of the three histograms below. NARREND
Which of the following statements is false?
A)You can examine the relationship between two nominal variables using a cross-classification table.
B)You can only apply statistical techniques to one variable at a time.
C)You can examine the relationship between two interval variables using a scatter diagram.
D)None of these choices.
Home Care
Data are collected on the number of house calls (x) made in a given week by each of 60 nurses in a certain hospital. The same data set is displayed in each of the three histograms below.
NARRENDWhich of the following statements is false?
A)You can examine the relationship between two nominal variables using a cross-classification table.
B)You can only apply statistical techniques to one variable at a time.
C)You can examine the relationship between two interval variables using a scatter diagram.
D)None of these choices.
Unlock Deck
Unlock for access to all 140 flashcards in this deck.
Unlock Deck
k this deck
8
NARRBEGIN: Home Care
Home Care
Data are collected on the number of house calls (x) made in a given week by each of 60 nurses in a certain hospital. The same data set is displayed in each of the three histograms below. NARREND
In order to draw a scatter diagram, we need interval data for
A)one variable
B)two variables
C)three variables
D)four variables
Home Care
Data are collected on the number of house calls (x) made in a given week by each of 60 nurses in a certain hospital. The same data set is displayed in each of the three histograms below.
NARRENDIn order to draw a scatter diagram, we need interval data for
A)one variable
B)two variables
C)three variables
D)four variables
Unlock Deck
Unlock for access to all 140 flashcards in this deck.
Unlock Deck
k this deck
9
NARRBEGIN: Home Care
Home Care
Data are collected on the number of house calls (x) made in a given week by each of 60 nurses in a certain hospital. The same data set is displayed in each of the three histograms below. NARREND
The two most important characteristics to examine in a scatter diagram are the number of possible categories for X and Y and the number of observations in each category.
Home Care
Data are collected on the number of house calls (x) made in a given week by each of 60 nurses in a certain hospital. The same data set is displayed in each of the three histograms below.
NARRENDThe two most important characteristics to examine in a scatter diagram are the number of possible categories for X and Y and the number of observations in each category.
Unlock Deck
Unlock for access to all 140 flashcards in this deck.
Unlock Deck
k this deck
10
NARRBEGIN: Home Care
Home Care
Data are collected on the number of house calls (x) made in a given week by each of 60 nurses in a certain hospital. The same data set is displayed in each of the three histograms below. NARREND
How do you determine whether two interval variables have a positive linear relationship?
A)Most of the points fall close to a straight line with positive slope.
B)As the X variable increases, the Y variable increases in a linear way.
C)The scatter diagram shows a linear pattern that is going uphill.
D)All of these choices are true.
Home Care
Data are collected on the number of house calls (x) made in a given week by each of 60 nurses in a certain hospital. The same data set is displayed in each of the three histograms below.
NARRENDHow do you determine whether two interval variables have a positive linear relationship?
A)Most of the points fall close to a straight line with positive slope.
B)As the X variable increases, the Y variable increases in a linear way.
C)The scatter diagram shows a linear pattern that is going uphill.
D)All of these choices are true.
Unlock Deck
Unlock for access to all 140 flashcards in this deck.
Unlock Deck
k this deck
11
NARRBEGIN: Home Care
Home Care
Data are collected on the number of house calls (x) made in a given week by each of 60 nurses in a certain hospital. The same data set is displayed in each of the three histograms below. NARREND
When two variables tend to move in opposite directions, yet still form a linear pattern, how do you describe their relationship?
A)A positive linear relationship.
B)A negative linear relationship.
C)A proportional inverse relationship.
D)None of these choices.
Home Care
Data are collected on the number of house calls (x) made in a given week by each of 60 nurses in a certain hospital. The same data set is displayed in each of the three histograms below.
NARRENDWhen two variables tend to move in opposite directions, yet still form a linear pattern, how do you describe their relationship?
A)A positive linear relationship.
B)A negative linear relationship.
C)A proportional inverse relationship.
D)None of these choices.
Unlock Deck
Unlock for access to all 140 flashcards in this deck.
Unlock Deck
k this deck
12
NARRBEGIN: Home Care
Home Care
Data are collected on the number of house calls (x) made in a given week by each of 60 nurses in a certain hospital. The same data set is displayed in each of the three histograms below. NARREND
The relationship between two interval variables is graphically displayed by a
A)scatter diagram
B)histogram
C)bar chart
D)pie chart
Home Care
Data are collected on the number of house calls (x) made in a given week by each of 60 nurses in a certain hospital. The same data set is displayed in each of the three histograms below.
NARRENDThe relationship between two interval variables is graphically displayed by a
A)scatter diagram
B)histogram
C)bar chart
D)pie chart
Unlock Deck
Unlock for access to all 140 flashcards in this deck.
Unlock Deck
k this deck
13
NARRBEGIN: Home Care
Home Care
Data are collected on the number of house calls (x) made in a given week by each of 60 nurses in a certain hospital. The same data set is displayed in each of the three histograms below. NARREND
The graphical technique used to describe the relationship between two interval variables is the scatter diagram.
Home Care
Data are collected on the number of house calls (x) made in a given week by each of 60 nurses in a certain hospital. The same data set is displayed in each of the three histograms below.
NARRENDThe graphical technique used to describe the relationship between two interval variables is the scatter diagram.
Unlock Deck
Unlock for access to all 140 flashcards in this deck.
Unlock Deck
k this deck
14
NARRBEGIN: Home Care
Home Care
Data are collected on the number of house calls (x) made in a given week by each of 60 nurses in a certain hospital. The same data set is displayed in each of the three histograms below. NARREND
The first scatter diagram below shows a stronger linear relationship than the second scatter diagram. (Assume the scales on both scatter diagrams are the same.)
Home Care
Data are collected on the number of house calls (x) made in a given week by each of 60 nurses in a certain hospital. The same data set is displayed in each of the three histograms below.
NARRENDThe first scatter diagram below shows a stronger linear relationship than the second scatter diagram. (Assume the scales on both scatter diagrams are the same.)
Unlock Deck
Unlock for access to all 140 flashcards in this deck.
Unlock Deck
k this deck
15
NARRBEGIN: Home Care
Home Care
Data are collected on the number of house calls (x) made in a given week by each of 60 nurses in a certain hospital. The same data set is displayed in each of the three histograms below. NARREND
Which of the following describes a positive linear relationship between X and Y?
A)As the X values increase, the Y values increase in a linear manner.
B)As the X values decrease, the Y values decrease in a linear manner.
C)The X and Y values move uphill together in a linear manner.
D)All of these choices are true.
Home Care
Data are collected on the number of house calls (x) made in a given week by each of 60 nurses in a certain hospital. The same data set is displayed in each of the three histograms below.
NARRENDWhich of the following describes a positive linear relationship between X and Y?
A)As the X values increase, the Y values increase in a linear manner.
B)As the X values decrease, the Y values decrease in a linear manner.
C)The X and Y values move uphill together in a linear manner.
D)All of these choices are true.
Unlock Deck
Unlock for access to all 140 flashcards in this deck.
Unlock Deck
k this deck
16
NARRBEGIN: Home Care
Home Care
Data are collected on the number of house calls (x) made in a given week by each of 60 nurses in a certain hospital. The same data set is displayed in each of the three histograms below. NARREND
If two variables have a strong linear relationship, that means one variable is causing the other variable to go up or down.
Home Care
Data are collected on the number of house calls (x) made in a given week by each of 60 nurses in a certain hospital. The same data set is displayed in each of the three histograms below.
NARRENDIf two variables have a strong linear relationship, that means one variable is causing the other variable to go up or down.
Unlock Deck
Unlock for access to all 140 flashcards in this deck.
Unlock Deck
k this deck
17
NARRBEGIN: Home Care
Home Care
Data are collected on the number of house calls (x) made in a given week by each of 60 nurses in a certain hospital. The same data set is displayed in each of the three histograms below. NARREND
Correlation implies causation.
Home Care
Data are collected on the number of house calls (x) made in a given week by each of 60 nurses in a certain hospital. The same data set is displayed in each of the three histograms below.
NARRENDCorrelation implies causation.
Unlock Deck
Unlock for access to all 140 flashcards in this deck.
Unlock Deck
k this deck
18
NARRBEGIN: Home Care
Home Care
Data are collected on the number of house calls (x) made in a given week by each of 60 nurses in a certain hospital. The same data set is displayed in each of the three histograms below. NARREND
The two most important characteristics revealed by the scatter diagram are the strength and direction of the linear relationship.
Home Care
Data are collected on the number of house calls (x) made in a given week by each of 60 nurses in a certain hospital. The same data set is displayed in each of the three histograms below.
NARRENDThe two most important characteristics revealed by the scatter diagram are the strength and direction of the linear relationship.
Unlock Deck
Unlock for access to all 140 flashcards in this deck.
Unlock Deck
k this deck
19
NARRBEGIN: Home Care
Home Care
Data are collected on the number of house calls (x) made in a given week by each of 60 nurses in a certain hospital. The same data set is displayed in each of the three histograms below. NARREND
In applications involving two variables, X and Y, where one variable depends to some degree on the other, we call Y the ____________________ variable.
Home Care
Data are collected on the number of house calls (x) made in a given week by each of 60 nurses in a certain hospital. The same data set is displayed in each of the three histograms below.
NARRENDIn applications involving two variables, X and Y, where one variable depends to some degree on the other, we call Y the ____________________ variable.
Unlock Deck
Unlock for access to all 140 flashcards in this deck.
Unlock Deck
k this deck
20
NARRBEGIN: Home Care
Home Care
Data are collected on the number of house calls (x) made in a given week by each of 60 nurses in a certain hospital. The same data set is displayed in each of the three histograms below. NARREND
The scatter diagram below depicts data with a negative linear relationship.
Home Care
Data are collected on the number of house calls (x) made in a given week by each of 60 nurses in a certain hospital. The same data set is displayed in each of the three histograms below.
NARRENDThe scatter diagram below depicts data with a negative linear relationship.
Unlock Deck
Unlock for access to all 140 flashcards in this deck.
Unlock Deck
k this deck
21
NARRBEGIN: Home Care
Home Care
Data are collected on the number of house calls (x) made in a given week by each of 60 nurses in a certain hospital. The same data set is displayed in each of the three histograms below. NARREND
It is speculated that the number of police officers has a negative linear relationship with number of crimes. Explain why this might be so.
Home Care
Data are collected on the number of house calls (x) made in a given week by each of 60 nurses in a certain hospital. The same data set is displayed in each of the three histograms below.
NARRENDIt is speculated that the number of police officers has a negative linear relationship with number of crimes. Explain why this might be so.
Unlock Deck
Unlock for access to all 140 flashcards in this deck.
Unlock Deck
k this deck
22
NARRBEGIN: Home Care
Home Care
Data are collected on the number of house calls (x) made in a given week by each of 60 nurses in a certain hospital. The same data set is displayed in each of the three histograms below. NARREND
The line chart below shows cucumber prices fluctuated from $2.00 per pound to over $4.50 per pound during the year.
Home Care
Data are collected on the number of house calls (x) made in a given week by each of 60 nurses in a certain hospital. The same data set is displayed in each of the three histograms below.
NARRENDThe line chart below shows cucumber prices fluctuated from $2.00 per pound to over $4.50 per pound during the year.
Unlock Deck
Unlock for access to all 140 flashcards in this deck.
Unlock Deck
k this deck
23
NARRBEGIN: Home Care
Home Care
Data are collected on the number of house calls (x) made in a given week by each of 60 nurses in a certain hospital. The same data set is displayed in each of the three histograms below. NARREND
A line chart is created by plotting the values of the variable on the vertical axis and the time periods on the horizontal axis.
Home Care
Data are collected on the number of house calls (x) made in a given week by each of 60 nurses in a certain hospital. The same data set is displayed in each of the three histograms below.
NARRENDA line chart is created by plotting the values of the variable on the vertical axis and the time periods on the horizontal axis.
Unlock Deck
Unlock for access to all 140 flashcards in this deck.
Unlock Deck
k this deck
24
NARRBEGIN: Home Care
Home Care
Data are collected on the number of house calls (x) made in a given week by each of 60 nurses in a certain hospital. The same data set is displayed in each of the three histograms below. NARREND
A department store's monthly sales (in thousands of dollars) for the last year were as follows. A histogram should be used to present these data.
Home Care
Data are collected on the number of house calls (x) made in a given week by each of 60 nurses in a certain hospital. The same data set is displayed in each of the three histograms below.
NARRENDA department store's monthly sales (in thousands of dollars) for the last year were as follows. A histogram should be used to present these data.
Unlock Deck
Unlock for access to all 140 flashcards in this deck.
Unlock Deck
k this deck
25
NARRBEGIN: Home Care
Home Care
Data are collected on the number of house calls (x) made in a given week by each of 60 nurses in a certain hospital. The same data set is displayed in each of the three histograms below. NARREND
A(n) ____________________ is a graphical display consisting of a set of points, each point representing one variable measured along the horizontal axis, and another variable measured along the vertical axis.
Home Care
Data are collected on the number of house calls (x) made in a given week by each of 60 nurses in a certain hospital. The same data set is displayed in each of the three histograms below.
NARRENDA(n) ____________________ is a graphical display consisting of a set of points, each point representing one variable measured along the horizontal axis, and another variable measured along the vertical axis.
Unlock Deck
Unlock for access to all 140 flashcards in this deck.
Unlock Deck
k this deck
26
NARRBEGIN: Home Care
Home Care
Data are collected on the number of house calls (x) made in a given week by each of 60 nurses in a certain hospital. The same data set is displayed in each of the three histograms below. NARREND
If when one variable increases the other one also increases, we say that there is a(n) ____________________ relationship between these two variables.
Home Care
Data are collected on the number of house calls (x) made in a given week by each of 60 nurses in a certain hospital. The same data set is displayed in each of the three histograms below.
NARRENDIf when one variable increases the other one also increases, we say that there is a(n) ____________________ relationship between these two variables.
Unlock Deck
Unlock for access to all 140 flashcards in this deck.
Unlock Deck
k this deck
27
NARRBEGIN: Home Care
Home Care
Data are collected on the number of house calls (x) made in a given week by each of 60 nurses in a certain hospital. The same data set is displayed in each of the three histograms below. NARREND
In applications involving two variables, X and Y, where one variable depends to some degree on the other, we call X the ____________________ variable.
Home Care
Data are collected on the number of house calls (x) made in a given week by each of 60 nurses in a certain hospital. The same data set is displayed in each of the three histograms below.
NARRENDIn applications involving two variables, X and Y, where one variable depends to some degree on the other, we call X the ____________________ variable.
Unlock Deck
Unlock for access to all 140 flashcards in this deck.
Unlock Deck
k this deck
28
NARRBEGIN: Home Care
Home Care
Data are collected on the number of house calls (x) made in a given week by each of 60 nurses in a certain hospital. The same data set is displayed in each of the three histograms below. NARREND
The line chart below shows tomato prices each month from January (month 1) to December last year ($ per pound). By looking at this chart you can see the lowest tomato prices occurred in July.
Home Care
Data are collected on the number of house calls (x) made in a given week by each of 60 nurses in a certain hospital. The same data set is displayed in each of the three histograms below.
NARRENDThe line chart below shows tomato prices each month from January (month 1) to December last year ($ per pound). By looking at this chart you can see the lowest tomato prices occurred in July.
Unlock Deck
Unlock for access to all 140 flashcards in this deck.
Unlock Deck
k this deck
29
NARRBEGIN: Home Care
Home Care
Data are collected on the number of house calls (x) made in a given week by each of 60 nurses in a certain hospital. The same data set is displayed in each of the three histograms below. NARREND
The number of houses sold in Miami Springs and the average monthly mortgage rates for 18 months randomly selected between January 2011 and April 2013 are shown in the following table.
a.Draw a scatter diagram with the number of houses sold on the vertical axis.
b.Describe the relationship between mortgage rate and number of houses sold.
Home Care
Data are collected on the number of house calls (x) made in a given week by each of 60 nurses in a certain hospital. The same data set is displayed in each of the three histograms below.
NARRENDThe number of houses sold in Miami Springs and the average monthly mortgage rates for 18 months randomly selected between January 2011 and April 2013 are shown in the following table.
a.Draw a scatter diagram with the number of houses sold on the vertical axis.
b.Describe the relationship between mortgage rate and number of houses sold.
Unlock Deck
Unlock for access to all 140 flashcards in this deck.
Unlock Deck
k this deck
30
NARRBEGIN: Home Care
Home Care
Data are collected on the number of house calls (x) made in a given week by each of 60 nurses in a certain hospital. The same data set is displayed in each of the three histograms below. NARREND
A line chart that is flat shows no fluctuation in the variable being presented.
Home Care
Data are collected on the number of house calls (x) made in a given week by each of 60 nurses in a certain hospital. The same data set is displayed in each of the three histograms below.
NARRENDA line chart that is flat shows no fluctuation in the variable being presented.
Unlock Deck
Unlock for access to all 140 flashcards in this deck.
Unlock Deck
k this deck
31
NARRBEGIN: Home Care
Home Care
Data are collected on the number of house calls (x) made in a given week by each of 60 nurses in a certain hospital. The same data set is displayed in each of the three histograms below. NARREND
One of the variables used to help predict unemployment rates is the rate of inflation. Accordingly, we identify rate of inflation as the ____________________ variable, and unemployment rate as the ____________________ variable.
Home Care
Data are collected on the number of house calls (x) made in a given week by each of 60 nurses in a certain hospital. The same data set is displayed in each of the three histograms below.
NARRENDOne of the variables used to help predict unemployment rates is the rate of inflation. Accordingly, we identify rate of inflation as the ____________________ variable, and unemployment rate as the ____________________ variable.
Unlock Deck
Unlock for access to all 140 flashcards in this deck.
Unlock Deck
k this deck
32
NARRBEGIN: Home Care
Home Care
Data are collected on the number of house calls (x) made in a given week by each of 60 nurses in a certain hospital. The same data set is displayed in each of the three histograms below. NARREND
An individual's income depends somewhat on their number of years of education. Accordingly, we identify income as the ____________________ variable, and years of education as the ____________________ variable.
Home Care
Data are collected on the number of house calls (x) made in a given week by each of 60 nurses in a certain hospital. The same data set is displayed in each of the three histograms below.
NARRENDAn individual's income depends somewhat on their number of years of education. Accordingly, we identify income as the ____________________ variable, and years of education as the ____________________ variable.
Unlock Deck
Unlock for access to all 140 flashcards in this deck.
Unlock Deck
k this deck
33
NARRBEGIN: Home Care
Home Care
Data are collected on the number of house calls (x) made in a given week by each of 60 nurses in a certain hospital. The same data set is displayed in each of the three histograms below. NARREND
What are the two most important characteristics to look for in a scatter diagram?
Home Care
Data are collected on the number of house calls (x) made in a given week by each of 60 nurses in a certain hospital. The same data set is displayed in each of the three histograms below.
NARRENDWhat are the two most important characteristics to look for in a scatter diagram?
Unlock Deck
Unlock for access to all 140 flashcards in this deck.
Unlock Deck
k this deck
34
NARRBEGIN: Home Care
Home Care
Data are collected on the number of house calls (x) made in a given week by each of 60 nurses in a certain hospital. The same data set is displayed in each of the three histograms below. NARREND
An economics professor wants to study the relationship between income and education. A sample of 10 individuals is selected at random, and their income (in thousands of dollars) and education (in years) are shown below:
a.Draw a scatter diagram for these data with the income on the vertical axis.
b.Describe the relationship between income and education.
Home Care
Data are collected on the number of house calls (x) made in a given week by each of 60 nurses in a certain hospital. The same data set is displayed in each of the three histograms below.
NARRENDAn economics professor wants to study the relationship between income and education. A sample of 10 individuals is selected at random, and their income (in thousands of dollars) and education (in years) are shown below:
a.Draw a scatter diagram for these data with the income on the vertical axis.
b.Describe the relationship between income and education.
Unlock Deck
Unlock for access to all 140 flashcards in this deck.
Unlock Deck
k this deck
35
NARRBEGIN: Home Care
Home Care
Data are collected on the number of house calls (x) made in a given week by each of 60 nurses in a certain hospital. The same data set is displayed in each of the three histograms below. NARREND
The two most important characteristics to look for in a scatter diagram are the ____________________ and ____________________ of the linear relationship.
Home Care
Data are collected on the number of house calls (x) made in a given week by each of 60 nurses in a certain hospital. The same data set is displayed in each of the three histograms below.
NARRENDThe two most important characteristics to look for in a scatter diagram are the ____________________ and ____________________ of the linear relationship.
Unlock Deck
Unlock for access to all 140 flashcards in this deck.
Unlock Deck
k this deck
36
NARRBEGIN: Home Care
Home Care
Data are collected on the number of house calls (x) made in a given week by each of 60 nurses in a certain hospital. The same data set is displayed in each of the three histograms below. NARREND
Time series data are often graphically depicted on a line chart, which is a plot of the variable of interest over time.
Home Care
Data are collected on the number of house calls (x) made in a given week by each of 60 nurses in a certain hospital. The same data set is displayed in each of the three histograms below.
NARRENDTime series data are often graphically depicted on a line chart, which is a plot of the variable of interest over time.
Unlock Deck
Unlock for access to all 140 flashcards in this deck.
Unlock Deck
k this deck
37
NARRBEGIN: Home Care
Home Care
Data are collected on the number of house calls (x) made in a given week by each of 60 nurses in a certain hospital. The same data set is displayed in each of the three histograms below. NARREND
Can a scatter diagram be used to explore the relationship between two nominal variables? Explain why or why not.
Home Care
Data are collected on the number of house calls (x) made in a given week by each of 60 nurses in a certain hospital. The same data set is displayed in each of the three histograms below.
NARRENDCan a scatter diagram be used to explore the relationship between two nominal variables? Explain why or why not.
Unlock Deck
Unlock for access to all 140 flashcards in this deck.
Unlock Deck
k this deck
38
NARRBEGIN: Home Care
Home Care
Data are collected on the number of house calls (x) made in a given week by each of 60 nurses in a certain hospital. The same data set is displayed in each of the three histograms below. NARREND
Briefly explain the difference between correlation and causation in terms of a relationship between X and Y.
Home Care
Data are collected on the number of house calls (x) made in a given week by each of 60 nurses in a certain hospital. The same data set is displayed in each of the three histograms below.
NARRENDBriefly explain the difference between correlation and causation in terms of a relationship between X and Y.
Unlock Deck
Unlock for access to all 140 flashcards in this deck.
Unlock Deck
k this deck
39
NARRBEGIN: Home Care
Home Care
Data are collected on the number of house calls (x) made in a given week by each of 60 nurses in a certain hospital. The same data set is displayed in each of the three histograms below. NARREND
When one variable increases and the other decreases, we say that there is a(n) ____________________ relationship between these two variables.
Home Care
Data are collected on the number of house calls (x) made in a given week by each of 60 nurses in a certain hospital. The same data set is displayed in each of the three histograms below.
NARRENDWhen one variable increases and the other decreases, we say that there is a(n) ____________________ relationship between these two variables.
Unlock Deck
Unlock for access to all 140 flashcards in this deck.
Unlock Deck
k this deck
40
NARRBEGIN: Home Care
Home Care
Data are collected on the number of house calls (x) made in a given week by each of 60 nurses in a certain hospital. The same data set is displayed in each of the three histograms below. NARREND
The graph below represents a line graph.
Home Care
Data are collected on the number of house calls (x) made in a given week by each of 60 nurses in a certain hospital. The same data set is displayed in each of the three histograms below.
NARRENDThe graph below represents a line graph.
Unlock Deck
Unlock for access to all 140 flashcards in this deck.
Unlock Deck
k this deck
41
NARRBEGIN: Home Care
Home Care
Data are collected on the number of house calls (x) made in a given week by each of 60 nurses in a certain hospital. The same data set is displayed in each of the three histograms below. NARREND
Observations that are measured at the same time are called ____________________ data.
Home Care
Data are collected on the number of house calls (x) made in a given week by each of 60 nurses in a certain hospital. The same data set is displayed in each of the three histograms below.
NARRENDObservations that are measured at the same time are called ____________________ data.
Unlock Deck
Unlock for access to all 140 flashcards in this deck.
Unlock Deck
k this deck
42
NARRBEGIN: Home Care
Home Care
Data are collected on the number of house calls (x) made in a given week by each of 60 nurses in a certain hospital. The same data set is displayed in each of the three histograms below. NARREND
The intervals (classes) in a histogram do not overlap.
Home Care
Data are collected on the number of house calls (x) made in a given week by each of 60 nurses in a certain hospital. The same data set is displayed in each of the three histograms below.
NARRENDThe intervals (classes) in a histogram do not overlap.
Unlock Deck
Unlock for access to all 140 flashcards in this deck.
Unlock Deck
k this deck
43
NARRBEGIN: Home Care
Home Care
Data are collected on the number of house calls (x) made in a given week by each of 60 nurses in a certain hospital. The same data set is displayed in each of the three histograms below. NARREND
Which of the following represents time-series data?
A)The length of time each of the top 100 stocks have been available on the NYSE.
B)The most popular time of year that people purchase the top 100 stocks on the NYSE.
C)The value of the #1 stock on the NYSE each month over a one-year period.
D)All of these choices are true.
Home Care
Data are collected on the number of house calls (x) made in a given week by each of 60 nurses in a certain hospital. The same data set is displayed in each of the three histograms below.
NARRENDWhich of the following represents time-series data?
A)The length of time each of the top 100 stocks have been available on the NYSE.
B)The most popular time of year that people purchase the top 100 stocks on the NYSE.
C)The value of the #1 stock on the NYSE each month over a one-year period.
D)All of these choices are true.
Unlock Deck
Unlock for access to all 140 flashcards in this deck.
Unlock Deck
k this deck
44
NARRBEGIN: Home Care
Home Care
Data are collected on the number of house calls (x) made in a given week by each of 60 nurses in a certain hospital. The same data set is displayed in each of the three histograms below. NARREND
Observations that are measured at the same time represent what type of data?
A)Time-series data
B)Cross-sectional data
C)Synchronous data
D)None of these choices.
Home Care
Data are collected on the number of house calls (x) made in a given week by each of 60 nurses in a certain hospital. The same data set is displayed in each of the three histograms below.
NARRENDObservations that are measured at the same time represent what type of data?
A)Time-series data
B)Cross-sectional data
C)Synchronous data
D)None of these choices.
Unlock Deck
Unlock for access to all 140 flashcards in this deck.
Unlock Deck
k this deck
45
NARRBEGIN: Home Care
Home Care
Data are collected on the number of house calls (x) made in a given week by each of 60 nurses in a certain hospital. The same data set is displayed in each of the three histograms below. NARREND
Time series data are often graphically depicted on a(n) ____________________, which is a plot of the variable of interest over time.
Home Care
Data are collected on the number of house calls (x) made in a given week by each of 60 nurses in a certain hospital. The same data set is displayed in each of the three histograms below.
NARRENDTime series data are often graphically depicted on a(n) ____________________, which is a plot of the variable of interest over time.
Unlock Deck
Unlock for access to all 140 flashcards in this deck.
Unlock Deck
k this deck
46
NARRBEGIN: Home Care
Home Care
Data are collected on the number of house calls (x) made in a given week by each of 60 nurses in a certain hospital. The same data set is displayed in each of the three histograms below. NARREND
The intervals (classes) in a histogram are equally wide.
Home Care
Data are collected on the number of house calls (x) made in a given week by each of 60 nurses in a certain hospital. The same data set is displayed in each of the three histograms below.
NARRENDThe intervals (classes) in a histogram are equally wide.
Unlock Deck
Unlock for access to all 140 flashcards in this deck.
Unlock Deck
k this deck
47
NARRBEGIN: Home Care
Home Care
Data are collected on the number of house calls (x) made in a given week by each of 60 nurses in a certain hospital. The same data set is displayed in each of the three histograms below. NARREND
Explain the difference between a histogram and a line chart.
Home Care
Data are collected on the number of house calls (x) made in a given week by each of 60 nurses in a certain hospital. The same data set is displayed in each of the three histograms below.
NARRENDExplain the difference between a histogram and a line chart.
Unlock Deck
Unlock for access to all 140 flashcards in this deck.
Unlock Deck
k this deck
48
NARRBEGIN: Home Care
Home Care
Data are collected on the number of house calls (x) made in a given week by each of 60 nurses in a certain hospital. The same data set is displayed in each of the three histograms below. NARREND
Which of the following statements describes a line chart?
A)A line chart is a graph of time-series data.
B)A line chart is a plot of a variable over time.
C)The horizontal axis of a line chart contains time periods.
D)All of these choices are true.
Home Care
Data are collected on the number of house calls (x) made in a given week by each of 60 nurses in a certain hospital. The same data set is displayed in each of the three histograms below.
NARRENDWhich of the following statements describes a line chart?
A)A line chart is a graph of time-series data.
B)A line chart is a plot of a variable over time.
C)The horizontal axis of a line chart contains time periods.
D)All of these choices are true.
Unlock Deck
Unlock for access to all 140 flashcards in this deck.
Unlock Deck
k this deck
49
NARRBEGIN: Home Care
Home Care
Data are collected on the number of house calls (x) made in a given week by each of 60 nurses in a certain hospital. The same data set is displayed in each of the three histograms below. NARREND
Briefly discuss the difference between cross-sectional data and time-series data.
Home Care
Data are collected on the number of house calls (x) made in a given week by each of 60 nurses in a certain hospital. The same data set is displayed in each of the three histograms below.
NARRENDBriefly discuss the difference between cross-sectional data and time-series data.
Unlock Deck
Unlock for access to all 140 flashcards in this deck.
Unlock Deck
k this deck
50
NARRBEGIN: Home Care
Home Care
Data are collected on the number of house calls (x) made in a given week by each of 60 nurses in a certain hospital. The same data set is displayed in each of the three histograms below. NARREND
Observations that are measured at successive points in time is what type of data?
A)Time-series data
B)Cross-sectional data
C)Successive data
D)None of these choices.
Home Care
Data are collected on the number of house calls (x) made in a given week by each of 60 nurses in a certain hospital. The same data set is displayed in each of the three histograms below.
NARRENDObservations that are measured at successive points in time is what type of data?
A)Time-series data
B)Cross-sectional data
C)Successive data
D)None of these choices.
Unlock Deck
Unlock for access to all 140 flashcards in this deck.
Unlock Deck
k this deck
51
NARRBEGIN: Home Care
Home Care
Data are collected on the number of house calls (x) made in a given week by each of 60 nurses in a certain hospital. The same data set is displayed in each of the three histograms below. NARREND
A line chart is created by plotting the value of the variable on the ____________________ axis and the time periods on the ____________________ axis.
Home Care
Data are collected on the number of house calls (x) made in a given week by each of 60 nurses in a certain hospital. The same data set is displayed in each of the three histograms below.
NARRENDA line chart is created by plotting the value of the variable on the ____________________ axis and the time periods on the ____________________ axis.
Unlock Deck
Unlock for access to all 140 flashcards in this deck.
Unlock Deck
k this deck
52
NARRBEGIN: Home Care
Home Care
Data are collected on the number of house calls (x) made in a given week by each of 60 nurses in a certain hospital. The same data set is displayed in each of the three histograms below. NARREND
Observations that are taken during successive points in time are called ____________________ data.
Home Care
Data are collected on the number of house calls (x) made in a given week by each of 60 nurses in a certain hospital. The same data set is displayed in each of the three histograms below.
NARRENDObservations that are taken during successive points in time are called ____________________ data.
Unlock Deck
Unlock for access to all 140 flashcards in this deck.
Unlock Deck
k this deck
53
NARRBEGIN: Home Care
Home Care
Data are collected on the number of house calls (x) made in a given week by each of 60 nurses in a certain hospital. The same data set is displayed in each of the three histograms below. NARREND
What kind(s) of data can be depicted by a line chart?
A)Frequencies of an interval over time.
B)Frequencies of a nominal variable over time.
C)Relative frequencies of a nominal variable over time.
D)All of these choices are true.
Home Care
Data are collected on the number of house calls (x) made in a given week by each of 60 nurses in a certain hospital. The same data set is displayed in each of the three histograms below.
NARRENDWhat kind(s) of data can be depicted by a line chart?
A)Frequencies of an interval over time.
B)Frequencies of a nominal variable over time.
C)Relative frequencies of a nominal variable over time.
D)All of these choices are true.
Unlock Deck
Unlock for access to all 140 flashcards in this deck.
Unlock Deck
k this deck
54
NARRBEGIN: Home Care
Home Care
Data are collected on the number of house calls (x) made in a given week by each of 60 nurses in a certain hospital. The same data set is displayed in each of the three histograms below. NARREND
Beef prices throughout the year (month 1 = January) are shown in the line chart below (per pound). Describe beef prices for this given year using this line chart.
Home Care
Data are collected on the number of house calls (x) made in a given week by each of 60 nurses in a certain hospital. The same data set is displayed in each of the three histograms below.
NARRENDBeef prices throughout the year (month 1 = January) are shown in the line chart below (per pound). Describe beef prices for this given year using this line chart.
Unlock Deck
Unlock for access to all 140 flashcards in this deck.
Unlock Deck
k this deck
55
NARRBEGIN: Home Care
Home Care
Data are collected on the number of house calls (x) made in a given week by each of 60 nurses in a certain hospital. The same data set is displayed in each of the three histograms below. NARREND
Time-series data are often graphically depicted how?
A)Bar chart
B)Histogram
C)Line chart
D)All of these choices are true.
Home Care
Data are collected on the number of house calls (x) made in a given week by each of 60 nurses in a certain hospital. The same data set is displayed in each of the three histograms below.
NARRENDTime-series data are often graphically depicted how?
A)Bar chart
B)Histogram
C)Line chart
D)All of these choices are true.
Unlock Deck
Unlock for access to all 140 flashcards in this deck.
Unlock Deck
k this deck
56
NARRBEGIN: Home Care
Home Care
Data are collected on the number of house calls (x) made in a given week by each of 60 nurses in a certain hospital. The same data set is displayed in each of the three histograms below. NARREND
A(n) ____________________ is created by plotting the value of the variable on the vertical axis and the time periods on the horizontal axis.
Home Care
Data are collected on the number of house calls (x) made in a given week by each of 60 nurses in a certain hospital. The same data set is displayed in each of the three histograms below.
NARRENDA(n) ____________________ is created by plotting the value of the variable on the vertical axis and the time periods on the horizontal axis.
Unlock Deck
Unlock for access to all 140 flashcards in this deck.
Unlock Deck
k this deck
57
NARRBEGIN: Home Care
Home Care
Data are collected on the number of house calls (x) made in a given week by each of 60 nurses in a certain hospital. The same data set is displayed in each of the three histograms below. NARREND
The line chart below shows potato prices per pound for each month from January (month 1) to December last year. By looking at this chart you can see the lowest potato prices occurred in ____________________.
Home Care
Data are collected on the number of house calls (x) made in a given week by each of 60 nurses in a certain hospital. The same data set is displayed in each of the three histograms below.
NARRENDThe line chart below shows potato prices per pound for each month from January (month 1) to December last year. By looking at this chart you can see the lowest potato prices occurred in ____________________.
Unlock Deck
Unlock for access to all 140 flashcards in this deck.
Unlock Deck
k this deck
58
NARRBEGIN: Home Care
Home Care
Data are collected on the number of house calls (x) made in a given week by each of 60 nurses in a certain hospital. The same data set is displayed in each of the three histograms below. NARREND
What type of graph depicts the data below?
A)A line chart
B)A histogram
C)A dot plot
D)A bar chart
Home Care
Data are collected on the number of house calls (x) made in a given week by each of 60 nurses in a certain hospital. The same data set is displayed in each of the three histograms below.
NARRENDWhat type of graph depicts the data below?
A)A line chart
B)A histogram
C)A dot plot
D)A bar chart
Unlock Deck
Unlock for access to all 140 flashcards in this deck.
Unlock Deck
k this deck
59
NARRBEGIN: Home Care
Home Care
Data are collected on the number of house calls (x) made in a given week by each of 60 nurses in a certain hospital. The same data set is displayed in each of the three histograms below. NARREND
Which of the following statements describe(s) the line chart below?
A)November experienced the lowest sales throughout the year.
B)August experienced the highest sales throughout the year.
C)Sales did not fluctuate more than 30 units on either side of 90.
D)All of these choices are true.
Home Care
Data are collected on the number of house calls (x) made in a given week by each of 60 nurses in a certain hospital. The same data set is displayed in each of the three histograms below.
NARRENDWhich of the following statements describe(s) the line chart below?
A)November experienced the lowest sales throughout the year.
B)August experienced the highest sales throughout the year.
C)Sales did not fluctuate more than 30 units on either side of 90.
D)All of these choices are true.
Unlock Deck
Unlock for access to all 140 flashcards in this deck.
Unlock Deck
k this deck
60
NARRBEGIN: Home Care
Home Care
Data are collected on the number of house calls (x) made in a given week by each of 60 nurses in a certain hospital. The same data set is displayed in each of the three histograms below. NARREND
In a histogram, each observation is assigned to one or more classes.
Home Care
Data are collected on the number of house calls (x) made in a given week by each of 60 nurses in a certain hospital. The same data set is displayed in each of the three histograms below.
NARRENDIn a histogram, each observation is assigned to one or more classes.
Unlock Deck
Unlock for access to all 140 flashcards in this deck.
Unlock Deck
k this deck
61
NARRBEGIN: Home Care
Home Care
Data are collected on the number of house calls (x) made in a given week by each of 60 nurses in a certain hospital. The same data set is displayed in each of the three histograms below. NARREND
The number of observations within each class may be found in a frequency distribution.
Home Care
Data are collected on the number of house calls (x) made in a given week by each of 60 nurses in a certain hospital. The same data set is displayed in each of the three histograms below.
NARRENDThe number of observations within each class may be found in a frequency distribution.
Unlock Deck
Unlock for access to all 140 flashcards in this deck.
Unlock Deck
k this deck
62
NARRBEGIN: Home Care
Home Care
Data are collected on the number of house calls (x) made in a given week by each of 60 nurses in a certain hospital. The same data set is displayed in each of the three histograms below. NARREND
-According to the stem-and-leaf plot below, the median quiz score for this data set is 8.
Home Care
Data are collected on the number of house calls (x) made in a given week by each of 60 nurses in a certain hospital. The same data set is displayed in each of the three histograms below.
NARREND-According to the stem-and-leaf plot below, the median quiz score for this data set is 8.
Unlock Deck
Unlock for access to all 140 flashcards in this deck.
Unlock Deck
k this deck
63
NARRBEGIN: Home Care
Home Care
Data are collected on the number of house calls (x) made in a given week by each of 60 nurses in a certain hospital. The same data set is displayed in each of the three histograms below. NARREND
A stem-and-leaf display represents nominal data.
Home Care
Data are collected on the number of house calls (x) made in a given week by each of 60 nurses in a certain hospital. The same data set is displayed in each of the three histograms below.
NARRENDA stem-and-leaf display represents nominal data.
Unlock Deck
Unlock for access to all 140 flashcards in this deck.
Unlock Deck
k this deck
64
NARRBEGIN: Home Care
Home Care
Data are collected on the number of house calls (x) made in a given week by each of 60 nurses in a certain hospital. The same data set is displayed in each of the three histograms below. NARREND
A histogram is said to be symmetric if, when we draw a vertical line down the center of the histogram the two sides are nearly identical.
Home Care
Data are collected on the number of house calls (x) made in a given week by each of 60 nurses in a certain hospital. The same data set is displayed in each of the three histograms below.
NARRENDA histogram is said to be symmetric if, when we draw a vertical line down the center of the histogram the two sides are nearly identical.
Unlock Deck
Unlock for access to all 140 flashcards in this deck.
Unlock Deck
k this deck
65
NARRBEGIN: Home Care
Home Care
Data are collected on the number of house calls (x) made in a given week by each of 60 nurses in a certain hospital. The same data set is displayed in each of the three histograms below. NARREND
-According to the stem-and-leaf plot below, this data set has a negative median.
Home Care
Data are collected on the number of house calls (x) made in a given week by each of 60 nurses in a certain hospital. The same data set is displayed in each of the three histograms below.
NARREND-According to the stem-and-leaf plot below, this data set has a negative median.
Unlock Deck
Unlock for access to all 140 flashcards in this deck.
Unlock Deck
k this deck
66
NARRBEGIN: Home Care
Home Care
Data are collected on the number of house calls (x) made in a given week by each of 60 nurses in a certain hospital. The same data set is displayed in each of the three histograms below. NARREND
A modal class is the class with the largest number of observations.
Home Care
Data are collected on the number of house calls (x) made in a given week by each of 60 nurses in a certain hospital. The same data set is displayed in each of the three histograms below.
NARRENDA modal class is the class with the largest number of observations.
Unlock Deck
Unlock for access to all 140 flashcards in this deck.
Unlock Deck
k this deck
67
NARRBEGIN: Home Care
Home Care
Data are collected on the number of house calls (x) made in a given week by each of 60 nurses in a certain hospital. The same data set is displayed in each of the three histograms below. NARREND
A relative frequency distribution describes the proportion of data values that fall within each category.
Home Care
Data are collected on the number of house calls (x) made in a given week by each of 60 nurses in a certain hospital. The same data set is displayed in each of the three histograms below.
NARRENDA relative frequency distribution describes the proportion of data values that fall within each category.
Unlock Deck
Unlock for access to all 140 flashcards in this deck.
Unlock Deck
k this deck
68
NARRBEGIN: Home Care
Home Care
Data are collected on the number of house calls (x) made in a given week by each of 60 nurses in a certain hospital. The same data set is displayed in each of the three histograms below. NARREND
The advantage of a stem-and-leaf display over a histogram is that we can see the actual observations.
Home Care
Data are collected on the number of house calls (x) made in a given week by each of 60 nurses in a certain hospital. The same data set is displayed in each of the three histograms below.
NARRENDThe advantage of a stem-and-leaf display over a histogram is that we can see the actual observations.
Unlock Deck
Unlock for access to all 140 flashcards in this deck.
Unlock Deck
k this deck
69
NARRBEGIN: Home Care
Home Care
Data are collected on the number of house calls (x) made in a given week by each of 60 nurses in a certain hospital. The same data set is displayed in each of the three histograms below. NARREND
When a distribution has more values to the right and tails to the left, we say it is skewed negatively.
Home Care
Data are collected on the number of house calls (x) made in a given week by each of 60 nurses in a certain hospital. The same data set is displayed in each of the three histograms below.
NARRENDWhen a distribution has more values to the right and tails to the left, we say it is skewed negatively.
Unlock Deck
Unlock for access to all 140 flashcards in this deck.
Unlock Deck
k this deck
70
NARRBEGIN: Home Care
Home Care
Data are collected on the number of house calls (x) made in a given week by each of 60 nurses in a certain hospital. The same data set is displayed in each of the three histograms below. NARREND
The original observations cannot be determined once they are grouped into a frequency distribution.
Home Care
Data are collected on the number of house calls (x) made in a given week by each of 60 nurses in a certain hospital. The same data set is displayed in each of the three histograms below.
NARRENDThe original observations cannot be determined once they are grouped into a frequency distribution.
Unlock Deck
Unlock for access to all 140 flashcards in this deck.
Unlock Deck
k this deck
71
NARRBEGIN: Home Care
Home Care
Data are collected on the number of house calls (x) made in a given week by each of 60 nurses in a certain hospital. The same data set is displayed in each of the three histograms below. NARREND
The sum of cumulative relative frequencies always equals 1.
Home Care
Data are collected on the number of house calls (x) made in a given week by each of 60 nurses in a certain hospital. The same data set is displayed in each of the three histograms below.
NARRENDThe sum of cumulative relative frequencies always equals 1.
Unlock Deck
Unlock for access to all 140 flashcards in this deck.
Unlock Deck
k this deck
72
NARRBEGIN: Home Care
Home Care
Data are collected on the number of house calls (x) made in a given week by each of 60 nurses in a certain hospital. The same data set is displayed in each of the three histograms below. NARREND
-According to the stem-and-leaf plot below, this data set is symmetric.
Home Care
Data are collected on the number of house calls (x) made in a given week by each of 60 nurses in a certain hospital. The same data set is displayed in each of the three histograms below.
NARREND-According to the stem-and-leaf plot below, this data set is symmetric.
Unlock Deck
Unlock for access to all 140 flashcards in this deck.
Unlock Deck
k this deck
73
NARRBEGIN: Home Care
Home Care
Data are collected on the number of house calls (x) made in a given week by each of 60 nurses in a certain hospital. The same data set is displayed in each of the three histograms below. NARREND
The sum of relative frequencies in a distribution always equals 1.
Home Care
Data are collected on the number of house calls (x) made in a given week by each of 60 nurses in a certain hospital. The same data set is displayed in each of the three histograms below.
NARRENDThe sum of relative frequencies in a distribution always equals 1.
Unlock Deck
Unlock for access to all 140 flashcards in this deck.
Unlock Deck
k this deck
74
NARRBEGIN: Home Care
Home Care
Data are collected on the number of house calls (x) made in a given week by each of 60 nurses in a certain hospital. The same data set is displayed in each of the three histograms below. NARREND
The number of class intervals in a histogram depends on the number of observations in the data set.
Home Care
Data are collected on the number of house calls (x) made in a given week by each of 60 nurses in a certain hospital. The same data set is displayed in each of the three histograms below.
NARRENDThe number of class intervals in a histogram depends on the number of observations in the data set.
Unlock Deck
Unlock for access to all 140 flashcards in this deck.
Unlock Deck
k this deck
75
NARRBEGIN: Home Care
Home Care
Data are collected on the number of house calls (x) made in a given week by each of 60 nurses in a certain hospital. The same data set is displayed in each of the three histograms below. NARREND
A stem-and-leaf display reveals more information about the original data than does a histogram.
Home Care
Data are collected on the number of house calls (x) made in a given week by each of 60 nurses in a certain hospital. The same data set is displayed in each of the three histograms below.
NARRENDA stem-and-leaf display reveals more information about the original data than does a histogram.
Unlock Deck
Unlock for access to all 140 flashcards in this deck.
Unlock Deck
k this deck
76
NARRBEGIN: Home Care
Home Care
Data are collected on the number of house calls (x) made in a given week by each of 60 nurses in a certain hospital. The same data set is displayed in each of the three histograms below. NARREND
Experience shows that few students hand in their statistics exams early; most prefer to hand them in near the end of the test period. This means the time taken by students to write exams is positively skewed.
Home Care
Data are collected on the number of house calls (x) made in a given week by each of 60 nurses in a certain hospital. The same data set is displayed in each of the three histograms below.
NARRENDExperience shows that few students hand in their statistics exams early; most prefer to hand them in near the end of the test period. This means the time taken by students to write exams is positively skewed.
Unlock Deck
Unlock for access to all 140 flashcards in this deck.
Unlock Deck
k this deck
77
NARRBEGIN: Home Care
Home Care
Data are collected on the number of house calls (x) made in a given week by each of 60 nurses in a certain hospital. The same data set is displayed in each of the three histograms below. NARREND
When a distribution has more values to the left and tails off to the right, it is skewed negatively.
Home Care
Data are collected on the number of house calls (x) made in a given week by each of 60 nurses in a certain hospital. The same data set is displayed in each of the three histograms below.
NARRENDWhen a distribution has more values to the left and tails off to the right, it is skewed negatively.
Unlock Deck
Unlock for access to all 140 flashcards in this deck.
Unlock Deck
k this deck
78
NARRBEGIN: Home Care
Home Care
Data are collected on the number of house calls (x) made in a given week by each of 60 nurses in a certain hospital. The same data set is displayed in each of the three histograms below. NARREND
A histogram represents interval data.
Home Care
Data are collected on the number of house calls (x) made in a given week by each of 60 nurses in a certain hospital. The same data set is displayed in each of the three histograms below.
NARRENDA histogram represents interval data.
Unlock Deck
Unlock for access to all 140 flashcards in this deck.
Unlock Deck
k this deck
79
NARRBEGIN: Home Care
Home Care
Data are collected on the number of house calls (x) made in a given week by each of 60 nurses in a certain hospital. The same data set is displayed in each of the three histograms below. NARREND
A skewed histogram is one with a long tail extending either to the right or left.
Home Care
Data are collected on the number of house calls (x) made in a given week by each of 60 nurses in a certain hospital. The same data set is displayed in each of the three histograms below.
NARRENDA skewed histogram is one with a long tail extending either to the right or left.
Unlock Deck
Unlock for access to all 140 flashcards in this deck.
Unlock Deck
k this deck
80
NARRBEGIN: Home Care
Home Care
Data are collected on the number of house calls (x) made in a given week by each of 60 nurses in a certain hospital. The same data set is displayed in each of the three histograms below. NARREND
A cumulative relative frequency distribution lists the number of observations that lie below each of the class limits.
Home Care
Data are collected on the number of house calls (x) made in a given week by each of 60 nurses in a certain hospital. The same data set is displayed in each of the three histograms below.
NARRENDA cumulative relative frequency distribution lists the number of observations that lie below each of the class limits.
Unlock Deck
Unlock for access to all 140 flashcards in this deck.
Unlock Deck
k this deck
Unlock Deck
Unlock for access to all 140 flashcards in this deck.


