Deck 4: Numerical Methods for Describing Data
Full screen (f)
Question
Question
A common topic of study among biologists who study social insects is colony integration, i.e. the ways members of a society interact with and influence each other. Previous research suggests that the queen of a wasp nest seems to encourage worker activity. That research is anecdotal, and quantitative information is lacking. The following data were gathered from wasp nests in California and Iowa. The nests were studied very early in their development, so each wasp could be individually identified using standard marking procedures, and their activity levels monitored reliably. The table below contains the proportions of time spent on the nest for 12 randomly selected colonies in Iowa. (The colony numbers are for identification in the table only.) There is only one queen per nest, so the proportion is for her only. The workers proportion is the average proportion for all the worker bees in the nest. 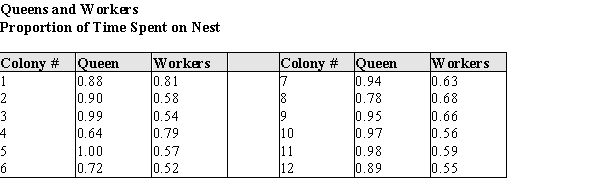 (a) Construct a comparative (back to back) stem & leaf plot of the proportions of time spent on the nest by Queens, and by Workers for these colonies.
(b) Using your plot in part (a), describe the differences and similarities in the distributions of the proportion of time spent on the nest by workers and queens.
(a) Construct a comparative (back to back) stem & leaf plot of the proportions of time spent on the nest by Queens, and by Workers for these colonies. (b) Using your plot in part (a), describe the differences and similarities in the distributions of the proportion of time spent on the nest by workers and queens.
Question
Question
A wide variety of oak trees grow in the United States. In one study a sample of acorns was collected from different locations, and their volumes, in cm3, were recorded. In the table below are summary statistics for these data. 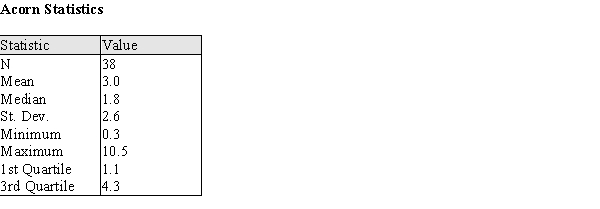 (a) Describe a procedure that uses these some or all of these summary statistics to determine whether outliers are present in the data.
(b) Using your procedure from part (a), determine if there are outliers in these data.
(a) Describe a procedure that uses these some or all of these summary statistics to determine whether outliers are present in the data. (b) Using your procedure from part (a), determine if there are outliers in these data.
Question
The data in the table below are from observations taken on Roman coins dating from the first three centuries AD. Historians believe that different mints might reveal themselves in different trace element profiles in the coins; these coins are known to have been minted in Rome. The technique of Atomic Absorption Spectrometry was used to estimate the % by weight of various elements in these coins; the % by weight that is gold is presented here. 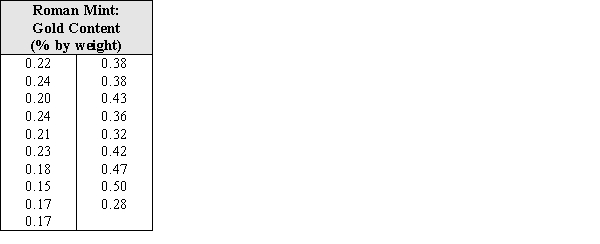 (a) Calculate these numerical summaries:
The mean _______________
The standard deviation _______________
The median _______________
The interquartile range _______________
(b) Construct a skeletal box plot for these data.
(c) Judging from the data and your responses in parts (a) and (b), would you say this distribution is skewed or approximately symmetric? Justify your response using appropriate statistical terminology.
(a) Calculate these numerical summaries: The mean _______________
The standard deviation _______________
The median _______________
The interquartile range _______________
(b) Construct a skeletal box plot for these data.
(c) Judging from the data and your responses in parts (a) and (b), would you say this distribution is skewed or approximately symmetric? Justify your response using appropriate statistical terminology.
Question
The % by weight of the element Antimony was calculated for the coins from a mint in Rome. 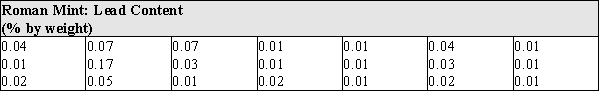 (a) Under what circumstances should one consider using a trimmed mean as a description of the center of a distribution? (b) Does the Antimony data exhibit the characteristic(s) that suggest a trimmed mean is the appropriate statistic to calculate? Explain.
(a) Under what circumstances should one consider using a trimmed mean as a description of the center of a distribution? (b) Does the Antimony data exhibit the characteristic(s) that suggest a trimmed mean is the appropriate statistic to calculate? Explain. Question
Question
Question
Question
Question
In order to attribute changes in nest activity to the active influence of the queen, 9 nests were randomly selected for experimental treatment. The normal activity of the nests were measured, and treatments were administered as described below: 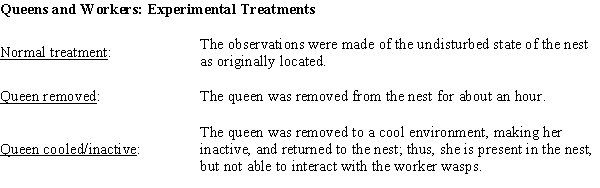 The data for the control treatment and each of the experimental treatments is given in the table below. The Activity Levels are the average proportion of active nest time for workers who were present in the normal and two experimental treatment periods. For example, 0.50 would mean for that nest the average amount of time the workers were actively working was 0.50 of the available time during that treatment. (The colony numbers are for identification in the table only.)
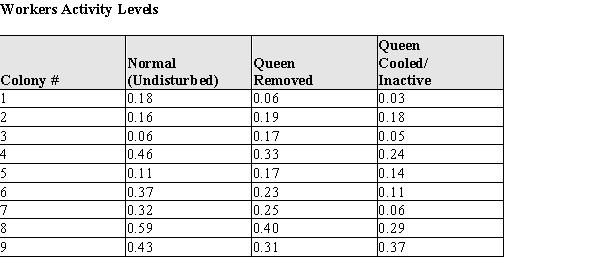
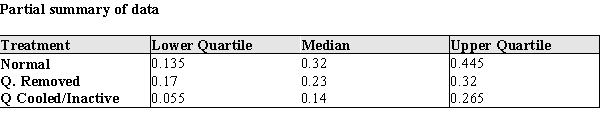
(a) Construct comparative box plots of the active nest times for (a) normal, (b) Queen removed, and (c) Queen Cooled/Inactive. (Note: since the data are proportions, there are no actual units for the data.)
(b) Two current theories about the queen's interaction with workers are that (A) the queen increases worker activity by her mere presence, or (B) she increases worker activity by interacting with worker bees. Based on your plot in part (a), which theory--if either--is supported by the data? Justify your conclusion with an appropriate statistical argument.
(c) What are the mean and standard deviation of the proportion of worker activity for undisturbed wasp nests. = s =
= s =
(d) One of the nests (Colony #4) has a proportion of worker activity of 0.46. How many standard deviations above/below the mean is the worker activity level in this nest?
(e) The biologists would like to provide some explanatory information for other scientists who would be using their new scale. They would like to state something like the following:
I. "Approximately _____ % of the undisturbed activity levels will be between −2σ and 2σ." OR
II. "At least _____ % of the undisturbed activity levels will be between −2σ and 2σ."
Based on your work so far, would you recommend using the Empirical Rule or Chebyshev's Rule to establish this percentage? Explain your reasoning in a few sentences.
(f) Using your recommended procedure from part (e) what percentage should be used to fill in the blank in the appropriate statement?
The data for the control treatment and each of the experimental treatments is given in the table below. The Activity Levels are the average proportion of active nest time for workers who were present in the normal and two experimental treatment periods. For example, 0.50 would mean for that nest the average amount of time the workers were actively working was 0.50 of the available time during that treatment. (The colony numbers are for identification in the table only.) (a) Construct comparative box plots of the active nest times for (a) normal, (b) Queen removed, and (c) Queen Cooled/Inactive. (Note: since the data are proportions, there are no actual units for the data.)
(b) Two current theories about the queen's interaction with workers are that (A) the queen increases worker activity by her mere presence, or (B) she increases worker activity by interacting with worker bees. Based on your plot in part (a), which theory--if either--is supported by the data? Justify your conclusion with an appropriate statistical argument.
(c) What are the mean and standard deviation of the proportion of worker activity for undisturbed wasp nests.
= s = (d) One of the nests (Colony #4) has a proportion of worker activity of 0.46. How many standard deviations above/below the mean is the worker activity level in this nest?
(e) The biologists would like to provide some explanatory information for other scientists who would be using their new scale. They would like to state something like the following:
I. "Approximately _____ % of the undisturbed activity levels will be between −2σ and 2σ." OR
II. "At least _____ % of the undisturbed activity levels will be between −2σ and 2σ."
Based on your work so far, would you recommend using the Empirical Rule or Chebyshev's Rule to establish this percentage? Explain your reasoning in a few sentences.
(f) Using your recommended procedure from part (e) what percentage should be used to fill in the blank in the appropriate statement?
Question
Question
The % by weight of the element Lead was calculated for the coins minted in Rome. Some of the summary statistics are given in the table below. 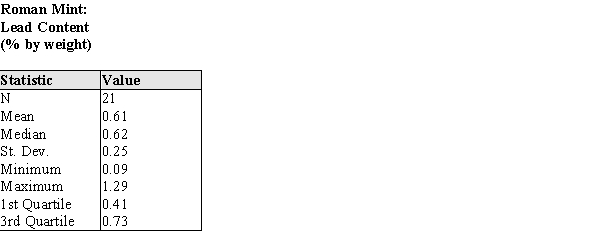 (a) Describe a procedure that uses these some or all of these summary statistics to determine whether outliers are present in the data. (b) Using your procedure from part (a), determine if there are outliers in these data.
(a) Describe a procedure that uses these some or all of these summary statistics to determine whether outliers are present in the data. (b) Using your procedure from part (a), determine if there are outliers in these data. Question
Astronomers are interested in the recessional velocity of galaxies - that is, the speed at which they are moving away from the Milky Way. The accompanying table contains the recessional velocities for a sample of galaxies, measured in km/sec. Negative velocity indicates the galaxy is moving towards us. 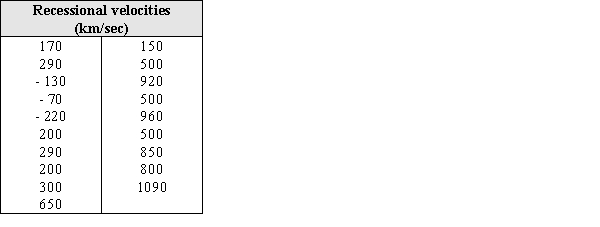
(a) Calculate these numerical summaries:
The mean _______________
The standard deviation _______________
The median _______________
The interquartile range _______________
(b) Construct a skeletal box plot for these data.
(c) Judging from the data and your responses in parts (a) and (b), would you say this distribution is skewed or approximately symmetric? Justify your response using appropriate statistical terminology.
Question
For data that is skewed to the right,  .
.
. Question
Question
Question
Question
An insurance agent is studying fire damage claims in a major city to see if the insurance premiums are matched to the company's risk. She takes a random sample of 20 claims, and finds the amount of each claim, in thousands of dollars. Her results are shown below: 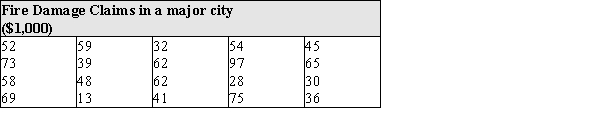 (a) Under what circumstances should one consider using a trimmed mean as a description of the center of a distribution? (b) Does the fire damage data exhibit the characteristic(s) that suggest a trimmed mean is the appropriate statistic to calculate? Explain.
(a) Under what circumstances should one consider using a trimmed mean as a description of the center of a distribution? (b) Does the fire damage data exhibit the characteristic(s) that suggest a trimmed mean is the appropriate statistic to calculate? Explain. Question
Question
Question
Identify the correct formula for the value of the z score.
A)
B)
C)
D)
E)
A)
B)
C)
D)
E)
Question
Question
The following are the number of bottles of cola drunk by a man each month during a year.  Calculate the lower quartile, the upper quartile, and the interquartile range for the data set.
A) lower quartile =40.67
upper quartile =60.33
iqr =19.66
B) lower quartile =58.5
upper quartile =63.5
iqr =5
C) lower quartile =40.5
upper quartile =60
iqr=19.5
D) lower quartile =40.5
upper quartile =60
iqr =50
E) lower quartile =58.5
upper quartile =63.5
iqr=39.5
F) lower quartile =40.67
upper quartile =60.33
iqr =50
Calculate the lower quartile, the upper quartile, and the interquartile range for the data set. A) lower quartile =40.67
upper quartile =60.33
iqr =19.66
B) lower quartile =58.5
upper quartile =63.5
iqr =5
C) lower quartile =40.5
upper quartile =60
iqr=19.5
D) lower quartile =40.5
upper quartile =60
iqr =50
E) lower quartile =58.5
upper quartile =63.5
iqr=39.5
F) lower quartile =40.67
upper quartile =60.33
iqr =50
Question
Question
The following are payments (in dollars) for a certain expense made by a woman during fifteen months.  Calculate the lower quartile, the upper quartile, and the interquartile range for the data set.
A) lower quartile =263
upper quartile =405
iqr =142
B) lower quartile =246
upper quartile =415
iqr =169
C) lower quartile =141
upper quartile =405
iqr =264
D) lower quartile =270.5
upper quartile =391.5
iqr =121
E) lower quartile =255.5
upper quartile =403.5
iqr =147.875
Calculate the lower quartile, the upper quartile, and the interquartile range for the data set. A) lower quartile =263
upper quartile =405
iqr =142
B) lower quartile =246
upper quartile =415
iqr =169
C) lower quartile =141
upper quartile =405
iqr =264
D) lower quartile =270.5
upper quartile =391.5
iqr =121
E) lower quartile =255.5
upper quartile =403.5
iqr =147.875

Unlock Deck
Sign up to unlock the cards in this deck!
Unlock Deck
Unlock Deck
1/26
Play
Full screen (f)
Deck 4: Numerical Methods for Describing Data
1
For any given data set, the median must be greater than or equal to the lower quartile, and less than or equal to the upper quartile.
True
2
A common topic of study among biologists who study social insects is colony integration, i.e. the ways members of a society interact with and influence each other. Previous research suggests that the queen of a wasp nest seems to encourage worker activity. That research is anecdotal, and quantitative information is lacking. The following data were gathered from wasp nests in California and Iowa. The nests were studied very early in their development, so each wasp could be individually identified using standard marking procedures, and their activity levels monitored reliably. The table below contains the proportions of time spent on the nest for 12 randomly selected colonies in Iowa. (The colony numbers are for identification in the table only.) There is only one queen per nest, so the proportion is for her only. The workers proportion is the average proportion for all the worker bees in the nest. (a) Construct a comparative (back to back) stem & leaf plot of the proportions of time spent on the nest by Queens, and by Workers for these colonies.
(b) Using your plot in part (a), describe the differences and similarities in the distributions of the proportion of time spent on the nest by workers and queens.
(a) Construct a comparative (back to back) stem & leaf plot of the proportions of time spent on the nest by Queens, and by Workers for these colonies. (b) Using your plot in part (a), describe the differences and similarities in the distributions of the proportion of time spent on the nest by workers and queens.
a) 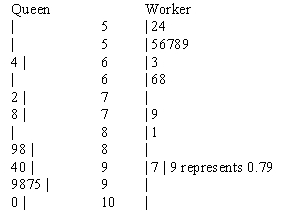
b) The shape of the Queen's distribution is single peaked and negatively skewed while the Worker's distribution is single peaked and positively skewed. The center for the Queen's distribution is much higher than the Workers (median: .92 vs. .585 ). Finally, the spread for the Queen's distribution is a little larger than the Worker's (range: .36 vs. .29, IQR: .145 vs. .115).
b) The shape of the Queen's distribution is single peaked and negatively skewed while the Worker's distribution is single peaked and positively skewed. The center for the Queen's distribution is much higher than the Workers (median: .92 vs. .585 ). Finally, the spread for the Queen's distribution is a little larger than the Worker's (range: .36 vs. .29, IQR: .145 vs. .115).
3
When using a 20% trimmed mean, the largest 10% and the smallest 10% of the observations are discarded for calculation purposes.
False
4
A wide variety of oak trees grow in the United States. In one study a sample of acorns was collected from different locations, and their volumes, in cm3, were recorded. In the table below are summary statistics for these data. (a) Describe a procedure that uses these some or all of these summary statistics to determine whether outliers are present in the data.
(b) Using your procedure from part (a), determine if there are outliers in these data.
(a) Describe a procedure that uses these some or all of these summary statistics to determine whether outliers are present in the data. (b) Using your procedure from part (a), determine if there are outliers in these data.
Unlock Deck
Unlock for access to all 26 flashcards in this deck.
Unlock Deck
k this deck
5
The data in the table below are from observations taken on Roman coins dating from the first three centuries AD. Historians believe that different mints might reveal themselves in different trace element profiles in the coins; these coins are known to have been minted in Rome. The technique of Atomic Absorption Spectrometry was used to estimate the % by weight of various elements in these coins; the % by weight that is gold is presented here. (a) Calculate these numerical summaries:
The mean _______________
The standard deviation _______________
The median _______________
The interquartile range _______________
(b) Construct a skeletal box plot for these data.
(c) Judging from the data and your responses in parts (a) and (b), would you say this distribution is skewed or approximately symmetric? Justify your response using appropriate statistical terminology.
(a) Calculate these numerical summaries: The mean _______________
The standard deviation _______________
The median _______________
The interquartile range _______________
(b) Construct a skeletal box plot for these data.
(c) Judging from the data and your responses in parts (a) and (b), would you say this distribution is skewed or approximately symmetric? Justify your response using appropriate statistical terminology.
Unlock Deck
Unlock for access to all 26 flashcards in this deck.
Unlock Deck
k this deck
6
The % by weight of the element Antimony was calculated for the coins from a mint in Rome. (a) Under what circumstances should one consider using a trimmed mean as a description of the center of a distribution? (b) Does the Antimony data exhibit the characteristic(s) that suggest a trimmed mean is the appropriate statistic to calculate? Explain.
(a) Under what circumstances should one consider using a trimmed mean as a description of the center of a distribution? (b) Does the Antimony data exhibit the characteristic(s) that suggest a trimmed mean is the appropriate statistic to calculate? Explain. Unlock Deck
Unlock for access to all 26 flashcards in this deck.
Unlock Deck
k this deck
7
One disadvantage of using the mean as a measure of center for a data set is that its value is affected by the presence of even a single outlier in the data set.
Unlock Deck
Unlock for access to all 26 flashcards in this deck.
Unlock Deck
k this deck
8
When the histogram of a data set is closely approximated by a normal curve, the standard deviation and the interquartile range are very close to equal on average.
Unlock Deck
Unlock for access to all 26 flashcards in this deck.
Unlock Deck
k this deck
9
The variance is the positive square root of the standard deviation.
Unlock Deck
Unlock for access to all 26 flashcards in this deck.
Unlock Deck
k this deck
10
The interquartile range is resistant to the effect of outliers.
Unlock Deck
Unlock for access to all 26 flashcards in this deck.
Unlock Deck
k this deck
11
In order to attribute changes in nest activity to the active influence of the queen, 9 nests were randomly selected for experimental treatment. The normal activity of the nests were measured, and treatments were administered as described below: The data for the control treatment and each of the experimental treatments is given in the table below. The Activity Levels are the average proportion of active nest time for workers who were present in the normal and two experimental treatment periods. For example, 0.50 would mean for that nest the average amount of time the workers were actively working was 0.50 of the available time during that treatment. (The colony numbers are for identification in the table only.)
(a) Construct comparative box plots of the active nest times for (a) normal, (b) Queen removed, and (c) Queen Cooled/Inactive. (Note: since the data are proportions, there are no actual units for the data.)
(b) Two current theories about the queen's interaction with workers are that (A) the queen increases worker activity by her mere presence, or (B) she increases worker activity by interacting with worker bees. Based on your plot in part (a), which theory--if either--is supported by the data? Justify your conclusion with an appropriate statistical argument.
(c) What are the mean and standard deviation of the proportion of worker activity for undisturbed wasp nests. = s =
(d) One of the nests (Colony #4) has a proportion of worker activity of 0.46. How many standard deviations above/below the mean is the worker activity level in this nest?
(e) The biologists would like to provide some explanatory information for other scientists who would be using their new scale. They would like to state something like the following:
I. "Approximately _____ % of the undisturbed activity levels will be between −2σ and 2σ." OR
II. "At least _____ % of the undisturbed activity levels will be between −2σ and 2σ."
Based on your work so far, would you recommend using the Empirical Rule or Chebyshev's Rule to establish this percentage? Explain your reasoning in a few sentences.
(f) Using your recommended procedure from part (e) what percentage should be used to fill in the blank in the appropriate statement?
The data for the control treatment and each of the experimental treatments is given in the table below. The Activity Levels are the average proportion of active nest time for workers who were present in the normal and two experimental treatment periods. For example, 0.50 would mean for that nest the average amount of time the workers were actively working was 0.50 of the available time during that treatment. (The colony numbers are for identification in the table only.) (a) Construct comparative box plots of the active nest times for (a) normal, (b) Queen removed, and (c) Queen Cooled/Inactive. (Note: since the data are proportions, there are no actual units for the data.)
(b) Two current theories about the queen's interaction with workers are that (A) the queen increases worker activity by her mere presence, or (B) she increases worker activity by interacting with worker bees. Based on your plot in part (a), which theory--if either--is supported by the data? Justify your conclusion with an appropriate statistical argument.
(c) What are the mean and standard deviation of the proportion of worker activity for undisturbed wasp nests.
= s = (d) One of the nests (Colony #4) has a proportion of worker activity of 0.46. How many standard deviations above/below the mean is the worker activity level in this nest?
(e) The biologists would like to provide some explanatory information for other scientists who would be using their new scale. They would like to state something like the following:
I. "Approximately _____ % of the undisturbed activity levels will be between −2σ and 2σ." OR
II. "At least _____ % of the undisturbed activity levels will be between −2σ and 2σ."
Based on your work so far, would you recommend using the Empirical Rule or Chebyshev's Rule to establish this percentage? Explain your reasoning in a few sentences.
(f) Using your recommended procedure from part (e) what percentage should be used to fill in the blank in the appropriate statement?
Unlock Deck
Unlock for access to all 26 flashcards in this deck.
Unlock Deck
k this deck
12
If there are no outliers, a skeletal and modified boxplot can differ in the length of the box, but not in the whisker lengths.
Unlock Deck
Unlock for access to all 26 flashcards in this deck.
Unlock Deck
k this deck
13
The % by weight of the element Lead was calculated for the coins minted in Rome. Some of the summary statistics are given in the table below. (a) Describe a procedure that uses these some or all of these summary statistics to determine whether outliers are present in the data. (b) Using your procedure from part (a), determine if there are outliers in these data.
(a) Describe a procedure that uses these some or all of these summary statistics to determine whether outliers are present in the data. (b) Using your procedure from part (a), determine if there are outliers in these data. Unlock Deck
Unlock for access to all 26 flashcards in this deck.
Unlock Deck
k this deck
14
Astronomers are interested in the recessional velocity of galaxies - that is, the speed at which they are moving away from the Milky Way. The accompanying table contains the recessional velocities for a sample of galaxies, measured in km/sec. Negative velocity indicates the galaxy is moving towards us.
(a) Calculate these numerical summaries:
The mean _______________
The standard deviation _______________
The median _______________
The interquartile range _______________
(b) Construct a skeletal box plot for these data.
(c) Judging from the data and your responses in parts (a) and (b), would you say this distribution is skewed or approximately symmetric? Justify your response using appropriate statistical terminology.
Unlock Deck
Unlock for access to all 26 flashcards in this deck.
Unlock Deck
k this deck
15
For data that is skewed to the right, .
. Unlock Deck
Unlock for access to all 26 flashcards in this deck.
Unlock Deck
k this deck
16
By definition, an outlier is "extreme" if it is more than 3.0 iqr away from the closest quartile.
Unlock Deck
Unlock for access to all 26 flashcards in this deck.
Unlock Deck
k this deck
17
According to Chebyshev's rule, the fraction of observations that are within 3 standard deviations of the mean is at least eight-ninths.
Unlock Deck
Unlock for access to all 26 flashcards in this deck.
Unlock Deck
k this deck
18
The mean is the middle value of an ordered data set.
Unlock Deck
Unlock for access to all 26 flashcards in this deck.
Unlock Deck
k this deck
19
An insurance agent is studying fire damage claims in a major city to see if the insurance premiums are matched to the company's risk. She takes a random sample of 20 claims, and finds the amount of each claim, in thousands of dollars. Her results are shown below: (a) Under what circumstances should one consider using a trimmed mean as a description of the center of a distribution? (b) Does the fire damage data exhibit the characteristic(s) that suggest a trimmed mean is the appropriate statistic to calculate? Explain.
(a) Under what circumstances should one consider using a trimmed mean as a description of the center of a distribution? (b) Does the fire damage data exhibit the characteristic(s) that suggest a trimmed mean is the appropriate statistic to calculate? Explain. Unlock Deck
Unlock for access to all 26 flashcards in this deck.
Unlock Deck
k this deck
20
The trimmed mean is less sensitive to outliers than is the mean.
Unlock Deck
Unlock for access to all 26 flashcards in this deck.
Unlock Deck
k this deck
21
What is the potential drawback of usage of boxplots?
A) Usage of boxplots is ineffective for large sets of data.
B) Usage of boxplots is ineffective for small sets of data.
C) A boxplot does not provide a graphical display of the data distribution.
D) A boxplot does not provide information about symmetry or skewness of the data.
E) A boxplot is one of very few statistical graph methods that do not show outliers.
Unlock Deck
Unlock for access to all 26 flashcards in this deck.
Unlock Deck
k this deck
22
Identify the correct formula for the value of the z score.
A)
B)
C)
D)
E)
A)
B)
C)
D)
E)
Unlock Deck
Unlock for access to all 26 flashcards in this deck.
Unlock Deck
k this deck
23
Mean and variance are two statistics defined for both the population and the sample. What is the difference?
A) The value of the sample mean/variance varies from sample to sample, whereas there is just one value for the population mean/variance.
B) The value of the population mean/variance varies from sample to sample, whereas there is just one value for the sample mean/variance.
C) The value of the sample mean/variance is always less than the value of the population mean/variance, since the sample size is less than the population size.
Unlock Deck
Unlock for access to all 26 flashcards in this deck.
Unlock Deck
k this deck
24
The following are the number of bottles of cola drunk by a man each month during a year. Calculate the lower quartile, the upper quartile, and the interquartile range for the data set.
A) lower quartile =40.67
upper quartile =60.33
iqr =19.66
B) lower quartile =58.5
upper quartile =63.5
iqr =5
C) lower quartile =40.5
upper quartile =60
iqr=19.5
D) lower quartile =40.5
upper quartile =60
iqr =50
E) lower quartile =58.5
upper quartile =63.5
iqr=39.5
F) lower quartile =40.67
upper quartile =60.33
iqr =50
Calculate the lower quartile, the upper quartile, and the interquartile range for the data set. A) lower quartile =40.67
upper quartile =60.33
iqr =19.66
B) lower quartile =58.5
upper quartile =63.5
iqr =5
C) lower quartile =40.5
upper quartile =60
iqr=19.5
D) lower quartile =40.5
upper quartile =60
iqr =50
E) lower quartile =58.5
upper quartile =63.5
iqr=39.5
F) lower quartile =40.67
upper quartile =60.33
iqr =50
Unlock Deck
Unlock for access to all 26 flashcards in this deck.
Unlock Deck
k this deck
25
The Empirical Rule can be used whenever the distribution of data values is reasonably well described by a normal (bell-shaped) curve.
Unlock Deck
Unlock for access to all 26 flashcards in this deck.
Unlock Deck
k this deck
26
The following are payments (in dollars) for a certain expense made by a woman during fifteen months. Calculate the lower quartile, the upper quartile, and the interquartile range for the data set.
A) lower quartile =263
upper quartile =405
iqr =142
B) lower quartile =246
upper quartile =415
iqr =169
C) lower quartile =141
upper quartile =405
iqr =264
D) lower quartile =270.5
upper quartile =391.5
iqr =121
E) lower quartile =255.5
upper quartile =403.5
iqr =147.875
Calculate the lower quartile, the upper quartile, and the interquartile range for the data set. A) lower quartile =263
upper quartile =405
iqr =142
B) lower quartile =246
upper quartile =415
iqr =169
C) lower quartile =141
upper quartile =405
iqr =264
D) lower quartile =270.5
upper quartile =391.5
iqr =121
E) lower quartile =255.5
upper quartile =403.5
iqr =147.875
Unlock Deck
Unlock for access to all 26 flashcards in this deck.
Unlock Deck
k this deck
Unlock Deck
Unlock for access to all 26 flashcards in this deck.


