Deck 13: Multiple Regression and Correlation Analysis
Full screen (f)
Question
The following correlations were computed as part of a multiple regression analysis that used education, job, and age to predict income. 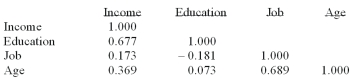 Which is the dependent variable?
A) Income
B) Age
C) Education
D) Job
E) None of these statements are correct
Which is the dependent variable?A) Income
B) Age
C) Education
D) Job
E) None of these statements are correct
Question
Question
Question
Question
Question
Question
Question
Question
Angela Chou has been asked to investigate the determinants of poverty in Ontario communities. She collected data on 60 communities from Statistics Canada. She selected the percentage of poor persons living under the poverty line [Poor (%)], measured by Low Income Cut-Off, designed by Statistics Canada as a measure of poverty for a community, as the dependent variable. The independent variables selected are percent of single families in each community, the unemployment rate in each community, and percent of population in the community holding a bachelor's degree as their highest level of education attained. ![<strong>Angela Chou has been asked to investigate the determinants of poverty in Ontario communities. She collected data on 60 communities from Statistics Canada. She selected the percentage of poor persons living under the poverty line [Poor (%)], measured by Low Income Cut-Off, designed by Statistics Canada as a measure of poverty for a community, as the dependent variable. The independent variables selected are percent of single families in each community, the unemployment rate in each community, and percent of population in the community holding a bachelor's degree as their highest level of education attained. Determine the regression equation.</strong> A) Poor (%) = -3.81 + 0.798 Single-Families (%) + 0.624 Unemployment Rate (%) - 0.170 Bachelor's Degree (%) B) Poor (%) = -3.88 + 0.798 Single-Families (%) + 0.625 Unemployment Rate (%) - 0.170 Bachelor's Degree (%) C) Poor (%) = 3.88 + 0.798 Single-Families (%) + 0.625 Unemployment Rate (%) - 0.170 Bachelor's Degree (%) D) Poor (%) = -3.88 - 0.798 Single-Families (%) - 0.625 Unemployment Rate (%) - 0.170 Bachelor's Degree (%) E) Poor (%) = 3.88 + 0.798 Single-Families (%) + 0.625 Unemployment Rate (%) + 0.170 Bachelor's Degree (%) <div style=padding-top: 35px>](https://d2lvgg3v3hfg70.cloudfront.net/TB7521/11eb23f8_d3a1_f46b_8c87_87cabfbc5088_TB7521_00.jpg) Determine the regression equation.
Determine the regression equation.
A) Poor (%) = -3.81 + 0.798 Single-Families (%) + 0.624 Unemployment Rate (%) - 0.170 Bachelor's Degree (%)
B) Poor (%) = -3.88 + 0.798 Single-Families (%) + 0.625 Unemployment Rate (%) - 0.170 Bachelor's Degree (%)
C) Poor (%) = 3.88 + 0.798 Single-Families (%) + 0.625 Unemployment Rate (%) - 0.170 Bachelor's Degree (%)
D) Poor (%) = -3.88 - 0.798 Single-Families (%) - 0.625 Unemployment Rate (%) - 0.170 Bachelor's Degree (%)
E) Poor (%) = 3.88 + 0.798 Single-Families (%) + 0.625 Unemployment Rate (%) + 0.170 Bachelor's Degree (%)
Determine the regression equation.A) Poor (%) = -3.81 + 0.798 Single-Families (%) + 0.624 Unemployment Rate (%) - 0.170 Bachelor's Degree (%)
B) Poor (%) = -3.88 + 0.798 Single-Families (%) + 0.625 Unemployment Rate (%) - 0.170 Bachelor's Degree (%)
C) Poor (%) = 3.88 + 0.798 Single-Families (%) + 0.625 Unemployment Rate (%) - 0.170 Bachelor's Degree (%)
D) Poor (%) = -3.88 - 0.798 Single-Families (%) - 0.625 Unemployment Rate (%) - 0.170 Bachelor's Degree (%)
E) Poor (%) = 3.88 + 0.798 Single-Families (%) + 0.625 Unemployment Rate (%) + 0.170 Bachelor's Degree (%)
Question
Angela Chou has been asked to investigate the determinants of poverty in Ontario communities. She collected data on 60 communities from Statistics Canada. She selected the percentage of poor persons living under the poverty line [Poor (%)], measured by Low Income Cut-Off, designed by Statistics Canada as a measure of poverty for a community, as the dependent variable. The independent variables selected are percent of single families in each community, the unemployment rate in each community, and percent of population in the community holding a bachelor's degree as their highest
Of education attained.![<strong>Angela Chou has been asked to investigate the determinants of poverty in Ontario communities. She collected data on 60 communities from Statistics Canada. She selected the percentage of poor persons living under the poverty line [Poor (%)], measured by Low Income Cut-Off, designed by Statistics Canada as a measure of poverty for a community, as the dependent variable. The independent variables selected are percent of single families in each community, the unemployment rate in each community, and percent of population in the community holding a bachelor's degree as their highest Of education attained. Determine the regression equation.</strong> A) Poor (%) = -3.81 - 0.798 Single-Families (%) + 0.624 Unemployment Rate (%) - 0.170 Bachelor's Degree (%) - 0.003 High School (%) B)Poor (%) = -3.81 + 0.798 Single-Families (%) + 0.624 Unemployment Rate (%) + 0.170 Bachelor's Degree (%) + 0.003 High School (%) C)Poor (%) = 3.81 + 0.798 Single-Families (%) + 0.624 Unemployment Rate (%) - 0.170 Bachelor's Degree (%) - 0.003 High School (%) D) Poor (%) = -3.81 + 0.798 Single-Families (%) + 0.624 Unemployment Rate (%) - 0.170 Bachelor's Degree (%) - 0.003 High School (%) E) Poor (%) = 3.81 + 0.798 Single-Families (%) - 0.624 Unemployment Rate (%) + 0.170 Bachelor's Degree (%) - 0.003 High School (%) <div style=padding-top: 35px>](https://d2lvgg3v3hfg70.cloudfront.net/TB7521/11eb23f8_d3a1_a64a_8c87_dfe737c5f5da_TB7521_00.jpg) Determine the regression equation.
Determine the regression equation.
A) Poor (%) = -3.81 - 0.798 Single-Families (%) + 0.624 Unemployment Rate (%) - 0.170 Bachelor's Degree (%) - 0.003 High School (%)
B)Poor (%) = -3.81 + 0.798 Single-Families (%) + 0.624 Unemployment Rate (%) + 0.170 Bachelor's Degree (%) + 0.003 High School (%)
C)Poor (%) = 3.81 + 0.798 Single-Families (%) + 0.624 Unemployment Rate (%) - 0.170 Bachelor's Degree (%) - 0.003 High School (%)
D) Poor (%) = -3.81 + 0.798 Single-Families (%) + 0.624 Unemployment Rate (%) - 0.170 Bachelor's Degree (%) - 0.003 High School (%)
E) Poor (%) = 3.81 + 0.798 Single-Families (%) - 0.624 Unemployment Rate (%) + 0.170 Bachelor's Degree (%) - 0.003 High School (%)
Of education attained.
Determine the regression equation.A) Poor (%) = -3.81 - 0.798 Single-Families (%) + 0.624 Unemployment Rate (%) - 0.170 Bachelor's Degree (%) - 0.003 High School (%)
B)Poor (%) = -3.81 + 0.798 Single-Families (%) + 0.624 Unemployment Rate (%) + 0.170 Bachelor's Degree (%) + 0.003 High School (%)
C)Poor (%) = 3.81 + 0.798 Single-Families (%) + 0.624 Unemployment Rate (%) - 0.170 Bachelor's Degree (%) - 0.003 High School (%)
D) Poor (%) = -3.81 + 0.798 Single-Families (%) + 0.624 Unemployment Rate (%) - 0.170 Bachelor's Degree (%) - 0.003 High School (%)
E) Poor (%) = 3.81 + 0.798 Single-Families (%) - 0.624 Unemployment Rate (%) + 0.170 Bachelor's Degree (%) - 0.003 High School (%)
Question
A manager at a local bank analyzed the relationship between monthly salary and three independent variables: length of service (measured in months), gender (0 = female, 1 = male) and job type (0 =
Clerical, 1 = technical). The following ANOVA summarizes the regression results: In the regression model, which of the following are dummy variables?
A) Intercept
B) Service
C) Service and gender
D) Gender and job
E) Service, gender, and job
Clerical, 1 = technical). The following ANOVA summarizes the regression results:
In the regression model, which of the following are dummy variables?A) Intercept
B) Service
C) Service and gender
D) Gender and job
E) Service, gender, and job
Question
Question
Question
Question
Question
Question
Question
Question
 The information above is from the multiple regression analysis computer output for 28 teams in Major League Baseball. The model is designed to predict wins using attendance, payroll, batting average, home runs, stolen bases, errors, and team ERA. Predict the number of wins for a team with:
BATAVG = 0.260 HOMERUNS = 150 ERA = 3
STOLENBASE = 100 ERROR = 100
PAYROLL = 25(million) ATTENDANCE = 3(million)
A) 77
B) 101
C) 187
D) 210
E) 186
Question
Question
Question
Question
Question
Question
Question
Question
Question
Question
Question
Question
Question
Question
Question
Question
Question
Question
Question
Question
Question
Question
Question
A manager at a local bank analyzed the relationship between monthly salary and three independent variables: length of service (measured in months), gender (0 = female, 1 = male) and job type (0 = clerical, 1 = technical). The following ANOVA summarizes the regression results:  Based on the ANOVA, the multiple coefficient of determination is
A) 5.957%
B) 59.3%
C) 40.7%
D) cannot be computed
Based on the ANOVA, the multiple coefficient of determination isA) 5.957%
B) 59.3%
C) 40.7%
D) cannot be computed
Question
Question
Question
Question
Question
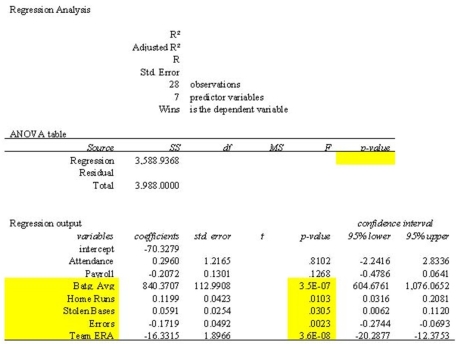 The information above is from the multiple regression analysis computer output for 28 teams in Major League Baseball. The model is designed to predict wins using attendance, payroll, batting average, home runs, stolen bases, errors, and team ERA. The critical value of F to be used in the global test of the model is: (5% level of significance)
A) 2.51
B) 2.58
C) 3.70
D) 5.57
E) 3.39
Question
Question
Question
Question
Question
Question
Question
Question
Question
 The information above is from the multiple regression analysis computer output for 28 teams in Major League Baseball. The model is designed to predict wins using attendance, payroll, batting average, home runs, stolen bases, errors, and team ERA. The computed F for the global test is:
A) 7.802
B) 25.695
C) 15.790
D) 26.981
E) 114.779
Question
Question
Question
Question
A manager at a local bank analyzed the relationship between monthly salary and three independent variables: length of service (measured in months), gender (0 = female, 1 = male) and job type (0 =
Clerical, 1 = technical). The following ANOVA summarizes the regression results: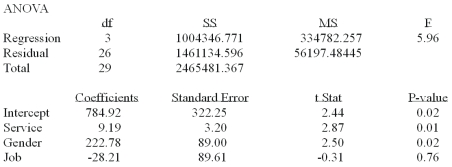 Based on the ANOVA and a 0.05 significance level, the global null hypothesis test of the multiple regression model
A) Will be rejected and conclude that monthly salary is related to all of the independent variables
B) Will be rejected and conclude that monthly salary is related to at least one of the independent variables.
C) Will not be rejected.
D) Will show a high multiple coefficient of determination
Clerical, 1 = technical). The following ANOVA summarizes the regression results:
Based on the ANOVA and a 0.05 significance level, the global null hypothesis test of the multiple regression modelA) Will be rejected and conclude that monthly salary is related to all of the independent variables
B) Will be rejected and conclude that monthly salary is related to at least one of the independent variables.
C) Will not be rejected.
D) Will show a high multiple coefficient of determination
Question
Question
Question
Question
A manager at a local bank analyzed the relationship between monthly salary and three independent variables: length of service (measured in months), gender (0 = female, 1 = male) and job type (0 = Clerical, 1 = technical). The following ANOVA summarizes the regression results:  Based on the hypothesis tests for the individual regression coefficients,
A) All the regression coefficients are not equal to zero.
B) "job" is the only significant variable in the model
C) Only months of service and gender are significantly related to monthly salary.
D) "service" is the only significant variable in the model
Based on the hypothesis tests for the individual regression coefficients,A) All the regression coefficients are not equal to zero.
B) "job" is the only significant variable in the model
C) Only months of service and gender are significantly related to monthly salary.
D) "service" is the only significant variable in the model
Question
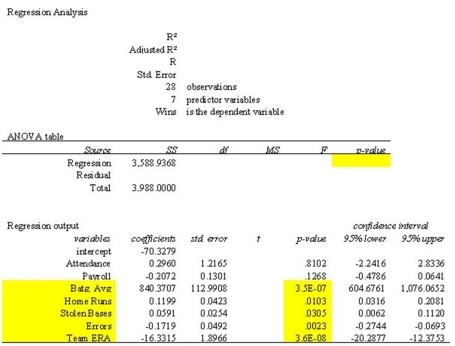
The information above is from the multiple regression analysis computer output for 28 teams in Major League Baseball. The model is designed to predict wins using attendance, payroll, batting average, home runs, stolen bases, errors, and team ERA. The t-value computed for testing the coefficient "Batg. Avg." is:
A) 112.991
B) 2.086
C) 7.438
D) 2.832
E) -1.593
Question
Question
Twenty-one executives in a large corporation were randomly selected for a study in which several factors were examined to determine their effect on annual salary (expressed in $000's). The factors selected were age, seniority, years of college, number of company divisions they had been exposed to and the level of their responsibility. A regression analysis was performed using a popular spreadsheet program with the following regression output:
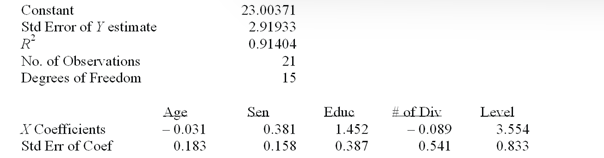
-Which of the following has the most influence on salary--20 years of seniority, 5 years of college or attaining 55 years of age?____________
-Which of the following has the most influence on salary--20 years of seniority, 5 years of college or attaining 55 years of age?____________
Question
The following correlations were computed as part of a multiple regression analysis that used education, job, and age to predict income. 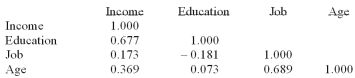
What is this table called?
A) Net regression coefficients
B) Coefficients of nondetermination
C) Analysis of variance
D) Correlation matrix
E) None of these statements are correct
What is this table called?
A) Net regression coefficients
B) Coefficients of nondetermination
C) Analysis of variance
D) Correlation matrix
E) None of these statements are correct
Question
Question
Question
The following correlations were computed as part of a multiple regression analysis that used education, job, and age to predict income. 
Which independent variable has the weakest association with the dependent variable?
A) Income
B) Age
C) Education
D) Job
E) None of these statements are correct
Which independent variable has the weakest association with the dependent variable?
A) Income
B) Age
C) Education
D) Job
E) None of these statements are correct
Question
Question
Angela Chou has been asked to investigate the determinants of poverty in Ontario communities. She collected data on 60 communities from Statistics Canada. She selected the percentage of poor persons
Living under the poverty line [Poor (%)], measured by Low Income Cut-Off, and designed by Statistics
Canada as a measure of poverty for a community, as the dependent variable. The independent variables selected are percent of single families in each community, the unemployment rate in each community, percent of population in the community holding a bachelor's degree as their highest level of education attained, and percent of population holding a High School Diploma as their highest level of education attained. Using the output below, determine which variable Angela should consider deleting.![<strong>Angela Chou has been asked to investigate the determinants of poverty in Ontario communities. She collected data on 60 communities from Statistics Canada. She selected the percentage of poor persons Living under the poverty line [Poor (%)], measured by Low Income Cut-Off, and designed by Statistics Canada as a measure of poverty for a community, as the dependent variable. The independent variables selected are percent of single families in each community, the unemployment rate in each community, percent of population in the community holding a bachelor's degree as their highest level of education attained, and percent of population holding a High School Diploma as their highest level of education attained. Using the output below, determine which variable Angela should consider deleting. </strong> A) It doesn't matter which she uses, the results are virtually the same in any case. B) Angela should delete the high school information, because the P-value is over 0.05. C) Angela should delete the bachelor's degree information, because the P-value is close to 0.05 D) Angela should delete the unemployment rate information because the P-value is 0.00 E) Angela should exclude the single-family and unemployment information because the P-value values are 0. <div style=padding-top: 35px>](https://d2lvgg3v3hfg70.cloudfront.net/TB7521/11eb23f8_d3a5_ec10_8c87_89b556a1d010_TB7521_00.jpg)
A) It doesn't matter which she uses, the results are virtually the same in any case.
B) Angela should delete the high school information, because the P-value is over 0.05.
C) Angela should delete the bachelor's degree information, because the P-value is close to 0.05
D) Angela should delete the unemployment rate information because the P-value is 0.00
E) Angela should exclude the single-family and unemployment information because the P-value values are 0.
Living under the poverty line [Poor (%)], measured by Low Income Cut-Off, and designed by Statistics
Canada as a measure of poverty for a community, as the dependent variable. The independent variables selected are percent of single families in each community, the unemployment rate in each community, percent of population in the community holding a bachelor's degree as their highest level of education attained, and percent of population holding a High School Diploma as their highest level of education attained. Using the output below, determine which variable Angela should consider deleting.
A) It doesn't matter which she uses, the results are virtually the same in any case.
B) Angela should delete the high school information, because the P-value is over 0.05.
C) Angela should delete the bachelor's degree information, because the P-value is close to 0.05
D) Angela should delete the unemployment rate information because the P-value is 0.00
E) Angela should exclude the single-family and unemployment information because the P-value values are 0.
Question
A manager at a local bank analyzed the relationship between monthly salary and three independent variables: length of service (measured in months), gender (0 = female, 1 = male) and job type (0 = Clerical, 1 = technical). The following ANOVA summarizes the regression results:  The results for the variable gender show that
A) males average $222.78 more than females in monthly salary
B) females average $222.78 more than males in monthly salary
C) gender is not related to monthly salary
D) Gender and months of service are correlated.
The results for the variable gender show thatA) males average $222.78 more than females in monthly salary
B) females average $222.78 more than males in monthly salary
C) gender is not related to monthly salary
D) Gender and months of service are correlated.
Question
Twenty-one executives in a large corporation were randomly selected for a study in which several factors were examined to determine their effect on annual salary (expressed in $000's). The factors selected were age, seniority, years of college, number of company divisions they had been exposed to and the level of their responsibility. A regression analysis was performed using a popular spreadsheet program with the following regression output:
-Write out the multiple regression equation____________.
-Write out the multiple regression equation____________.
Question
The following summary is from home heating costs, using mean outside temperature as X1 the number of centimetres of insulation as X2, and the presence of a garage as X3. Is the presence of the independent variable garage significant in predicting heating costs, when tested at the 0.05 level of significance? 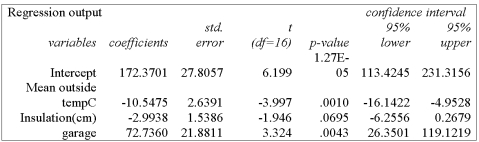
A) Since the p-value is less than the level of significance, the null hypothesis is rejected, and so the garage should be included in the analysis.
B) Since the p-value is less than the level of significance, the null hypothesis is accepted, and so the garage should not be included in the analysis.
C) Since the p-value is more than the level of significance, the null hypothesis is accepted, and so the garage should not be included in the analysis.
D) Since the p-value is more than the level of significance, the null hypothesis is rejected, and so the garage should be included in the analysis.
Question
Question
The following correlations were computed as part of a multiple regression analysis that used education, job, and age to predict income. 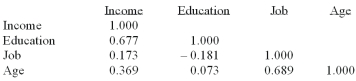
Which independent variable has the strongest association with the dependent variable?
A) Income
B) Age
C) Education
D) Job
E) None of these statements are correct
Which independent variable has the strongest association with the dependent variable?
A) Income
B) Age
C) Education
D) Job
E) None of these statements are correct
Question
Question

Unlock Deck
Sign up to unlock the cards in this deck!
Unlock Deck
Unlock Deck
1/99
Play
Full screen (f)
Deck 13: Multiple Regression and Correlation Analysis
1
The following correlations were computed as part of a multiple regression analysis that used education, job, and age to predict income. Which is the dependent variable?
A) Income
B) Age
C) Education
D) Job
E) None of these statements are correct
Which is the dependent variable?A) Income
B) Age
C) Education
D) Job
E) None of these statements are correct
A
2
Angela Chou has been asked to investigate the determinants of poverty in Ontario communities. She collected data on 60 communities from Statistics Canada. She selected the percentage of poor persons living under the poverty line [Poor (%)], measured by Low Income Cut-Off, designed by Statistics Canada as a measure of poverty for a community, as the dependent variable. The independent variables selected are percent of single families in each community, the unemployment rate in each community, percent of population in the community holding a bachelor's degree as their highest level of education attained, and percent of population holding a High School Diploma as their highest level of education attained.[Adapted from 1st Canadian Lind text 14-14]
Given the regression equation Poor (%) = -3.81 + 0.798 Single-Families (%) + 0.624 Unemployment Rate (%) - 0.170 Bachelor's Degree (%) - 0.003 High School (%) How many dependent variables are there in this regression?
A) 1
B) 2
C) 3
D) 4
E) 5
Given the regression equation Poor (%) = -3.81 + 0.798 Single-Families (%) + 0.624 Unemployment Rate (%) - 0.170 Bachelor's Degree (%) - 0.003 High School (%) How many dependent variables are there in this regression?
A) 1
B) 2
C) 3
D) 4
E) 5
4
3
i. A multiple regression equation defines the relationship between the dependent variable and the independent variables in the form of an equation.
Ii) Autocorrelation often happens when data has been collected over periods of time.
Iii) Homoscedasticity occurs when the variance of the residuals (Y - Y') is different for different values of Y'.
A) (i), (ii) and (iii) are all correct statements
B) (i) and (ii) are correct statements, but not (iii).
C) (i) and (iii) are correct statements but not (ii).
D) (ii) and (iii) are correct statements but not (i).
E) All statements are false
B
4
i. Multiple regression analysis examines the relationship of several dependent variables on the independent variable.
Ii) A multiple regression equation defines the relationship between the dependent variable and the independent variables in the form of an equation.
Iii) Autocorrelation often happens when data has been collected over periods of time.
A) (i), (ii) and (iii) are all correct statements.
B) (i) and (ii) are correct statements, but not (iii).
C) (i) and (iii) are correct statements but not (ii).
D) (ii) and (iii) are correct statements but not (i).
E) All statements are false.
Unlock Deck
Unlock for access to all 99 flashcards in this deck.
Unlock Deck
k this deck
5
i. Multiple regression is used when two or more independent variables are used to predict a value of a single dependent variable.
Ii) The values of b1, b2 and b3 in a multiple regression equation are called the net regression coefficients. They indicate the change in the predicted value for a unit change in one X when the other X variables are held constant.
Iii) Autocorrelation often happens when data has been collected over periods of time.
A) (i), (ii) and (iii) are all correct statements
B) (i) and (ii) are correct statements, but not (iii).
C) (i) and (iii) are correct statements but not (ii).
D) (ii) and (iii) are correct statements but not (i).
E) All statements are false
Unlock Deck
Unlock for access to all 99 flashcards in this deck.
Unlock Deck
k this deck
6
i. The values of b1, b2 and b3 in a multiple regression equation are called the net regression coefficients. They indicate the change in the predicted value for a unit change in one X when the other X variables are held constant.
ii. Multiple regression analysis examines the relationship of several dependent variables on the independent variable.
Iii) A multiple regression equation defines the relationship between the dependent variable and the independent variables in the form of an equation.
A) (i), (ii) and (iii) are all correct statements.
B) (i) and (ii) are correct statements, but not (iii).
C) (i) and (iii) are correct statements but not (ii).
D) (ii) and (iii) are correct statements but not (i).
E) All statements are false.
Unlock Deck
Unlock for access to all 99 flashcards in this deck.
Unlock Deck
k this deck
7
Multiple regression analysis is applied when analyzing the relationship between
A) An independent variable and several dependent variables
B) A dependent variable and several independent variables
C) Several dependent variables and several independent variables
D) Several regression equations and a single sample
E) None of these statements are correct
A) An independent variable and several dependent variables
B) A dependent variable and several independent variables
C) Several dependent variables and several independent variables
D) Several regression equations and a single sample
E) None of these statements are correct
Unlock Deck
Unlock for access to all 99 flashcards in this deck.
Unlock Deck
k this deck
8
i. Violating the need for successive observations of the dependent variable to be uncorrelated is called autocorrelation.
Ii) If an inverse relationship exists between the dependent variable and independent variables, the regression coefficients for the independent variables are negative.
Iii) Given a multiple linear equation Y' = 5.1 + 2.2X1 - 3.5X2, assuming other things are held constant, an increase in one unit of the second independent variable will cause a -3.5 unit change in Y.
A) (i), (ii) and (iii) are all correct statements
B) (i) and (ii) are correct statements, but not (iii).
C) (i) and (iii) are correct statements but not (ii).
D) (ii) and (iii) are correct statements but not (i).
E) All statements are false
Unlock Deck
Unlock for access to all 99 flashcards in this deck.
Unlock Deck
k this deck
9
Angela Chou has been asked to investigate the determinants of poverty in Ontario communities. She collected data on 60 communities from Statistics Canada. She selected the percentage of poor persons living under the poverty line [Poor (%)], measured by Low Income Cut-Off, designed by Statistics Canada as a measure of poverty for a community, as the dependent variable. The independent variables selected are percent of single families in each community, the unemployment rate in each community, and percent of population in the community holding a bachelor's degree as their highest level of education attained. Determine the regression equation.
A) Poor (%) = -3.81 + 0.798 Single-Families (%) + 0.624 Unemployment Rate (%) - 0.170 Bachelor's Degree (%)
B) Poor (%) = -3.88 + 0.798 Single-Families (%) + 0.625 Unemployment Rate (%) - 0.170 Bachelor's Degree (%)
C) Poor (%) = 3.88 + 0.798 Single-Families (%) + 0.625 Unemployment Rate (%) - 0.170 Bachelor's Degree (%)
D) Poor (%) = -3.88 - 0.798 Single-Families (%) - 0.625 Unemployment Rate (%) - 0.170 Bachelor's Degree (%)
E) Poor (%) = 3.88 + 0.798 Single-Families (%) + 0.625 Unemployment Rate (%) + 0.170 Bachelor's Degree (%)
Determine the regression equation.A) Poor (%) = -3.81 + 0.798 Single-Families (%) + 0.624 Unemployment Rate (%) - 0.170 Bachelor's Degree (%)
B) Poor (%) = -3.88 + 0.798 Single-Families (%) + 0.625 Unemployment Rate (%) - 0.170 Bachelor's Degree (%)
C) Poor (%) = 3.88 + 0.798 Single-Families (%) + 0.625 Unemployment Rate (%) - 0.170 Bachelor's Degree (%)
D) Poor (%) = -3.88 - 0.798 Single-Families (%) - 0.625 Unemployment Rate (%) - 0.170 Bachelor's Degree (%)
E) Poor (%) = 3.88 + 0.798 Single-Families (%) + 0.625 Unemployment Rate (%) + 0.170 Bachelor's Degree (%)
Unlock Deck
Unlock for access to all 99 flashcards in this deck.
Unlock Deck
k this deck
10
Angela Chou has been asked to investigate the determinants of poverty in Ontario communities. She collected data on 60 communities from Statistics Canada. She selected the percentage of poor persons living under the poverty line [Poor (%)], measured by Low Income Cut-Off, designed by Statistics Canada as a measure of poverty for a community, as the dependent variable. The independent variables selected are percent of single families in each community, the unemployment rate in each community, and percent of population in the community holding a bachelor's degree as their highest
Of education attained. Determine the regression equation.
A) Poor (%) = -3.81 - 0.798 Single-Families (%) + 0.624 Unemployment Rate (%) - 0.170 Bachelor's Degree (%) - 0.003 High School (%)
B)Poor (%) = -3.81 + 0.798 Single-Families (%) + 0.624 Unemployment Rate (%) + 0.170 Bachelor's Degree (%) + 0.003 High School (%)
C)Poor (%) = 3.81 + 0.798 Single-Families (%) + 0.624 Unemployment Rate (%) - 0.170 Bachelor's Degree (%) - 0.003 High School (%)
D) Poor (%) = -3.81 + 0.798 Single-Families (%) + 0.624 Unemployment Rate (%) - 0.170 Bachelor's Degree (%) - 0.003 High School (%)
E) Poor (%) = 3.81 + 0.798 Single-Families (%) - 0.624 Unemployment Rate (%) + 0.170 Bachelor's Degree (%) - 0.003 High School (%)
Of education attained.
Determine the regression equation.A) Poor (%) = -3.81 - 0.798 Single-Families (%) + 0.624 Unemployment Rate (%) - 0.170 Bachelor's Degree (%) - 0.003 High School (%)
B)Poor (%) = -3.81 + 0.798 Single-Families (%) + 0.624 Unemployment Rate (%) + 0.170 Bachelor's Degree (%) + 0.003 High School (%)
C)Poor (%) = 3.81 + 0.798 Single-Families (%) + 0.624 Unemployment Rate (%) - 0.170 Bachelor's Degree (%) - 0.003 High School (%)
D) Poor (%) = -3.81 + 0.798 Single-Families (%) + 0.624 Unemployment Rate (%) - 0.170 Bachelor's Degree (%) - 0.003 High School (%)
E) Poor (%) = 3.81 + 0.798 Single-Families (%) - 0.624 Unemployment Rate (%) + 0.170 Bachelor's Degree (%) - 0.003 High School (%)
Unlock Deck
Unlock for access to all 99 flashcards in this deck.
Unlock Deck
k this deck
11
A manager at a local bank analyzed the relationship between monthly salary and three independent variables: length of service (measured in months), gender (0 = female, 1 = male) and job type (0 =
Clerical, 1 = technical). The following ANOVA summarizes the regression results: In the regression model, which of the following are dummy variables?
A) Intercept
B) Service
C) Service and gender
D) Gender and job
E) Service, gender, and job
Clerical, 1 = technical). The following ANOVA summarizes the regression results:
In the regression model, which of the following are dummy variables?A) Intercept
B) Service
C) Service and gender
D) Gender and job
E) Service, gender, and job
Unlock Deck
Unlock for access to all 99 flashcards in this deck.
Unlock Deck
k this deck
12
How is the Y intercept in the multiple regression equation represented?
A) b1
B) x1
C) b2
D) x2
E) None of these statements are correct
A) b1
B) x1
C) b2
D) x2
E) None of these statements are correct
Unlock Deck
Unlock for access to all 99 flashcards in this deck.
Unlock Deck
k this deck
13
For a unit change in the first independent variable with other things being held constant, what change can be expected in the dependent variable in the multiple regression equation Y' = 5.2 + 6.3X1 - 7.1X2?
A) - 7.1
B) + 6.3
C) + 5.2
D) + 4.4
E) None of these statements are correct
A) - 7.1
B) + 6.3
C) + 5.2
D) + 4.4
E) None of these statements are correct
Unlock Deck
Unlock for access to all 99 flashcards in this deck.
Unlock Deck
k this deck
14
i. The values of b1, b2 and b3 in a multiple regression equation are called the net regression coefficients. They indicate the change in the predicted value for a unit change in one X when the other X variables are held constant.
ii. A multiple regression equation defines the relationship between the dependent variable and the independent variables in the form of an equation.
Iii) If an inverse relationship exists between the dependent variable and independent variables, the regression coefficients for the independent variables are positive.
A) (i), (ii) and (iii) are all correct statements.
B) (i) and (ii) are correct statements, but not (iii).
C) (i) and (iii) are correct statements but not (ii).
D) (ii) and (iii) are correct statements but not (i).
E) All statements are false.
Unlock Deck
Unlock for access to all 99 flashcards in this deck.
Unlock Deck
k this deck
15
i. Multiple regression is used when two or more independent variables are used to predict a value of a single dependent variable.
ii. The values of b1, b2 and b3 in a multiple regression equation are called the net regression coefficients. They indicate the change in the predicted value for a unit change in one X when the other X variables are held constant.
Iii) Multiple regression analysis examines the relationship of several dependent variables on the
Independent variable.
A) (i), (ii) and (iii) are all correct statements
B) (i) and (ii) are correct statements, but not (iii).
C) (i) and (iii) are correct statements but not (ii).
D) (ii) and (iii) are correct statements but not (i).
E) All statements are false
Unlock Deck
Unlock for access to all 99 flashcards in this deck.
Unlock Deck
k this deck
16
Angela Chou has been asked to investigate the determinants of poverty in Ontario communities. She collected data on 60 communities from Statistics Canada. She selected the percentage of poor persons living under the poverty line [Poor (%)], measured by Low Income Cut-Off, designed by Statistics Canada as a measure of poverty for a community, as the dependent variable. The independent variables selected are percent of single families in each community, the unemployment rate in each community, percent of population in the community holding a bachelor's degree as their highest level of education attained, and percent of population holding a High School Diploma as their highest levelof education attained. [Adapted from 1st Canadian Lind text 14-14]
Given the regression equation Poor (%) = -3.81 + 0.798 Single-Families (%) + 0.624 Unemployment Rate (%) - 0.170 Bachelor's Degree (%) - 0.003 High School (%)
What is the estimated percentage of poor persons living below the poverty line in a community with 5% of the community as single-families, a 5% unemployment rate, only 5% holding a Bachelor's Degree and 25% having High School as their highest attained educational level?
A) 2.375
B) -2.375
C) 11.845
D) -11.845
E) None of these statements are correct
Unlock Deck
Unlock for access to all 99 flashcards in this deck.
Unlock Deck
k this deck
17
i. If an inverse relationship exists between the dependent variable and independent variables, the regression coefficients for the independent variables are positive.
Ii) Given a multiple linear equation Y' = 5.1 + 2.2X1 - 3.5X2, assuming other things are held constant, an increase of one unit in the second independent variable will cause a -3.5 unit change in Y.
Iii) When the variance of the differences between the actual and the predicted values of the dependent variable are approximately the same, the variables are said to exhibit homoscedasticity.
A) (i), (ii) and (iii) are all correct statements
B) (i) and (ii) are correct statements, but not (iii).
C) (i) and (iii) are correct statements but not (ii).
D) (ii) and (iii) are correct statements but not (i).
E) All statements are false
Unlock Deck
Unlock for access to all 99 flashcards in this deck.
Unlock Deck
k this deck
18
If there are four independent variables in a multiple regression equation, there are also four
A) Y-intercepts.
B) regression coefficients.
C) dependent variables.
D) constant terms.
E) None of these statements are correct.
A) Y-intercepts.
B) regression coefficients.
C) dependent variables.
D) constant terms.
E) None of these statements are correct.
Unlock Deck
Unlock for access to all 99 flashcards in this deck.
Unlock Deck
k this deck
19
The information above is from the multiple regression analysis computer output for 28 teams in Major League Baseball. The model is designed to predict wins using attendance, payroll, batting average, home runs, stolen bases, errors, and team ERA. Predict the number of wins for a team with:BATAVG = 0.260 HOMERUNS = 150 ERA = 3
STOLENBASE = 100 ERROR = 100
PAYROLL = 25(million) ATTENDANCE = 3(million)
A) 77
B) 101
C) 187
D) 210
E) 186
Unlock Deck
Unlock for access to all 99 flashcards in this deck.
Unlock Deck
k this deck
20
Angela Chou has been asked to investigate the determinants of poverty in Ontario communities. She collected data on 60 communities from Statistics Canada. She selected the percentage of poor persons living under the poverty line [Poor (%)], measured by Low Income Cut-Off, designed by Statistics Canada as a measure of poverty for a community, as the dependent variable. The independent variables selected are percent of single families in each community, the unemployment rate in each community, percent of population in the community holding a bachelor's degree as their highest level of education attained, and percent of population holding a High School Diploma as their highest level of education attained. [Adapted from 1st Canadian Lind text 14-14]
Given the regression equation Poor (%) = -3.81 + 0.798 Single-Families (%) + 0.624 Unemployment Rate (%) - 0.170 Bachelor's Degree (%) - 0.003 High School (%)
Which single event would have the strongest effect in reducing the % poor in Ontario?
A) Decreasing the % of single families by 5%
B) Decreasing the Unemployment rate by 5%
C) Increasing the % of persons with a Bachelor's Degree by 10%
D) Decreasing the % of persons with a High School Diploma by 40%
E) Increasing the % of persons with a Bachelor's Degree by 15%
Unlock Deck
Unlock for access to all 99 flashcards in this deck.
Unlock Deck
k this deck
21
i. The multiple standard error of estimate measures the variation about the regression plane when two independent variables are considered.
Ii) The multiple coefficient of determination, R2, reports the proportion of the variation in Y that is not
Explained by the variation in the set of independent variables.
Iii) The coefficient of multiple determination reports the strength of the association between the dependent variable and the set of independent variables.
A) (i), (ii) and (iii) are all correct statements
B) (i) and (ii) are correct statements, but not (iii).
C) (i) and (iii) are correct statements but not (ii).
D) (ii) and (iii) are correct statements but not (i).
E) All statements are false
Unlock Deck
Unlock for access to all 99 flashcards in this deck.
Unlock Deck
k this deck
22
If the correlation between two variables, X and Y, is +0.67, what is the regression coefficient for these two variables?
A) + 0.67
B) > 0
C) < 0
D) = 0
E) None of these statements are correct
A) + 0.67
B) > 0
C) < 0
D) = 0
E) None of these statements are correct
Unlock Deck
Unlock for access to all 99 flashcards in this deck.
Unlock Deck
k this deck
23
In regression analysis, the dfreg = __________.
A) the sample size - 1
B) the sample size - k - 1
C) the number of dependent variables
D) the number of independent variables
E) the sample size - k
A) the sample size - 1
B) the sample size - k - 1
C) the number of dependent variables
D) the number of independent variables
E) the sample size - k
Unlock Deck
Unlock for access to all 99 flashcards in this deck.
Unlock Deck
k this deck
24
i. The multiple coefficient of determination, R2, reports the proportion of the variation in Y that is not explained by the variation in the set of independent variables.
Ii) The coefficient of multiple determination reports the strength of the association between the dependent variable and the set of independent variables.
Iii) The multiple standard error of estimate for two independent variables measures the variation about a regression plane.
A) (i), (ii) and (iii) are all correct statements
B) (i) and (ii) are correct statements, but not (iii).
C) (i) and (iii) are correct statements but not (ii).
D) (ii) and (iii) are correct statements but not (i).
E) All statements are false
Unlock Deck
Unlock for access to all 99 flashcards in this deck.
Unlock Deck
k this deck
25
What is the estimated index of satisfaction for a person who first married at 25, has an annual income of $46,000, has two children, has assets of $200,000, has in index of health status of 141, and has 2.5 social activities per week?
A sample of General Mills employees was studied to determine their degree of satisfaction with their present life. A special index, called the index of satisfaction, was used to measure satisfaction. Six factors were studied: age at the time of first marriage (X1), annual income (X2), number of children living (X3), value of all assets (X4), status of health in the form of an index (X5), and the average number of social activities per week (X6). Suppose the multiple regression equation is:
Y' = 16.24 + 0.017X1 + 0.00028X2 + 42X3 + 0.0012X4 + 0.19X5 + 26.8X6
A) 368.3
B) 421.6
C) 366.0
D) 601.6
E) 769.8
Unlock Deck
Unlock for access to all 99 flashcards in this deck.
Unlock Deck
k this deck
26
What is the estimated index of satisfaction for a person who first married at 25, has an annual income of $60,000, has two children, has assets of $350,000, has in index of health status of 141, and has 2 social activities per week?
A sample of General Mills employees was studied to determine their degree of satisfaction with their present life. A special index, called the index of satisfaction, was used to measure satisfaction. Six factors were studied: age at the time of first marriage (X1), annual income (X2), number of children living (X3), value of all assets (X4), status of health in the form of an index (X5), and the average number of social activities per week (X6). Suppose the multiple regression equation is:
Y' = 16.24 + 0.017X1 + 0.00028X2 + 42X3 + 0.0012X4 + 0.19X5 + 26.8X6
A) 777.7
B) 796.6
C) 588.6
D) 601.6
E) 769.8
Unlock Deck
Unlock for access to all 99 flashcards in this deck.
Unlock Deck
k this deck
27
What is the estimated index of satisfaction for a person who first married at 25, has an annual income of $26,500, has two children, has assets of $156,000, has in index of health status of 141, and has 2.5 social activities per week?
A sample of General Mills employees was studied to determine their degree of satisfaction with their present life. A special index, called the index of satisfaction, was used to measure satisfaction. Six factors were studied: age at the time of first marriage (X1), annual income (X2), number of children living (X3), value of all assets (X4), status of health in the form of an index (X5), and the average number of social activities per week (X6). Suppose the multiple regression equation is:
Y' = 16.24 + 0.017X1 + 0.00028X2 + 42X3 + 0.0012X4 + 0.19X5 + 26.8X6
A) 368.3
B) 421.6
C) 366.0
D) 601.6
E) 769.8
Unlock Deck
Unlock for access to all 99 flashcards in this deck.
Unlock Deck
k this deck
28
i. Multiple R2 measures the proportion of explained variation.
ii. 90% of total variation in the dependent variable is explained by the independent variable for a multiple R2= 0.90.
Iii) The multiple standard error of estimate measures the variation about the regression plane when two independent variables are considered.
A) (i), (ii) and (iii) are all correct statements
B) (i) and (ii) are correct statements, but not (iii).
C) (i) and (iii) are correct statements but not (ii).
D) (ii) and (iii) are correct statements but not (i).
E) All statements are false
Unlock Deck
Unlock for access to all 99 flashcards in this deck.
Unlock Deck
k this deck
29
In regression analysis, the dferr =__________ .
A) the sample size - 1
B) the sample size - k - 1
C) the number of dependent variables
D) the number of independent variables
E) the sample size - k
A) the sample size - 1
B) the sample size - k - 1
C) the number of dependent variables
D) the number of independent variables
E) the sample size - k
Unlock Deck
Unlock for access to all 99 flashcards in this deck.
Unlock Deck
k this deck
30
What is the estimated index of satisfaction for a person who first married at 25, has an annual income of $100,000, has two children, has assets of $500,000, has in index of health status of 141, and has 2 social activities per week?
A sample of General Mills employees was studied to determine their degree of satisfaction with their present life. A special index, called the index of satisfaction, was used to measure satisfaction. Six factors were studied: age at the time of first marriage (X1), annual income (X2), number of children living (X3), value of all assets (X4), status of health in the form of an index (X5), and the average number of social activities per week (X6). Suppose the multiple regression equation is:
Y' = 16.24 + 0.017X1 + 0.00028X2 + 42X3 + 0.0012X4 + 0.19X5 + 26.8X6
A) 777.7
B) 796.6
C) 588.6
D) 601.6
E) 769.8
Unlock Deck
Unlock for access to all 99 flashcards in this deck.
Unlock Deck
k this deck
31
If a multiple regression analysis is based on ten independent variables collected from a sample of 125 observations, what will be the value of the denominator in the calculation of the multiple standard error of estimate?
A) 125
B) 10
C) 114
D) 115
E) None of these statements are correct
A) 125
B) 10
C) 114
D) 115
E) None of these statements are correct
Unlock Deck
Unlock for access to all 99 flashcards in this deck.
Unlock Deck
k this deck
32
i. The multiple standard error of estimate for two independent variables measures the variation about a regression plane.
Ii) A multiple correlation determination equalling -0.76 is definitely possible.
Iii) Multiple R2 measures the proportion of explained variation relative to total variation.
A) (i), (ii) and (iii) are all correct statements
B) (i) and (ii) are correct statements, but not (iii).
C) (i) and (iii) are correct statements but not (ii).
D) (ii) and (iii) are correct statements but not (i).
E) All statements are false
Unlock Deck
Unlock for access to all 99 flashcards in this deck.
Unlock Deck
k this deck
33
What is the estimated index of satisfaction for a person who first married at 25, has an annual income of $100,000, has two children, has assets of $500,000, has in index of health status of 141, and has 3 social activities per week?
A sample of General Mills employees was studied to determine their degree of satisfaction with their present life. A special index, called the index of satisfaction, was used to measure satisfaction. Six factors were studied: age at the time of first marriage (X1), annual income (X2), number of children living (X3), value of all assets (X4), status of health in the form of an index (X5), and the average number of social activities per week (X6). Suppose the multiple regression equation is:
Y' = 16.24 + 0.017X1 +0.00028X2 + 42X3 + 0.0012X4 + 0.19X5 + 26.8X6
A) 777.7
B) 796.6
C) 588.6
D) 601.6
E) 769.8
Unlock Deck
Unlock for access to all 99 flashcards in this deck.
Unlock Deck
k this deck
34
i. The coefficient of multiple determination reports the strength of the association between the dependent variable and the set of independent variables.
ii. The multiple standard error of estimate for two independent variables measures the variation about a regression plane.
Iii) A multiple correlation determination equalling -0.76 is definitely possible.
A) (i), (ii) and (iii) are all correct statements
B) (i) and (ii) are correct statements, but not (iii).
C) (i) and (iii) are correct statements but not (ii).
D) (ii) and (iii) are correct statements but not (i).
E) All statements are false
Unlock Deck
Unlock for access to all 99 flashcards in this deck.
Unlock Deck
k this deck
35
What is the estimated index of satisfaction for a person who first married at 25, has an annual income of $100,000, has two children, has assets of $500,000, has in index of health status of 141, and has 3.5 social activities per week?
A sample of General Mills employees was studied to determine their degree of satisfaction with their present life. A special index, called the index of satisfaction, was used to measure satisfaction. Six factors were studied: age at the time of first marriage (X1), annual income (X2), number of children living (X3), value of all assets (X4), status of health in the form of an index (X5), and the average number of social activities per week (X6). Suppose the multiple regression equation is:
Y' = 16.24 + 0.017X1 +0.00028X2 + 42X3 + 0.0012X4 + 0.19X5 + 26.8X6
A) 777.7
B) 796.6
C) 810.0
D) 601.6
E) 769.8
Unlock Deck
Unlock for access to all 99 flashcards in this deck.
Unlock Deck
k this deck
36
What is the estimated index of satisfaction for a person who first married at 25, has an annual income of $46,000, has two children, has assets of $350,000, has in index of health status of 141, and has 2.5 social activities per week?
A sample of General Mills employees was studied to determine their degree of satisfaction with their present life. A special index, called the index of satisfaction, was used to measure satisfaction. Six factors were studied: age at the time of first marriage (X1), annual income (X2), number of children living (X3), value of all assets (X4), status of health in the form of an index (X5), and the average number of social activities per week (X6). Suppose the multiple regression equation is:
Y' = 16.24 + 0.017X1 +0.00028X2 + 42X3 + 0.0012X4 + 0.19X5 + 26.8X6
A) 368.3
B) 421.6
C) 366.0
D) 601.6
E) 769.8
Unlock Deck
Unlock for access to all 99 flashcards in this deck.
Unlock Deck
k this deck
37
What does the multiple standard error of estimate measure?
A) Change in Y' for a change in X1
B) Variation of the data points between Y and Y'.
C) Variation due to the relationship between the dependent and independent variables
D) Amount of explained variation
E) None of these statements are correct
A) Change in Y' for a change in X1
B) Variation of the data points between Y and Y'.
C) Variation due to the relationship between the dependent and independent variables
D) Amount of explained variation
E) None of these statements are correct
Unlock Deck
Unlock for access to all 99 flashcards in this deck.
Unlock Deck
k this deck
38
i. 90% of total variation in the dependent variable is explained by the independent variable for a multiple R2= 0.90.
ii. The multiple standard error of estimate measures the variation about the regression plane when two independent variables are considered.
Iii) The multiple coefficient of determination, R2, reports the proportion of the variation in Y that is not
Explained by the variation in the set of independent variables.
A) (i), (ii) and (iii) are all correct statements
B) (i) and (ii) are correct statements, but not (iii).
C) (i) and (iii) are correct statements but not (ii).
D) (ii) and (iii) are correct statements but not (i).
E) All statements are false
Unlock Deck
Unlock for access to all 99 flashcards in this deck.
Unlock Deck
k this deck
39
In a regression analysis, three independent variables are used in the equation based on a sample of forty observations. What are the degrees of freedom associated with the F-statistic?
A) 3 and 39
B) 4 and 40
C) 3 and 36
D) 2 and 39
E) None of these statements are correct
A) 3 and 39
B) 4 and 40
C) 3 and 36
D) 2 and 39
E) None of these statements are correct
Unlock Deck
Unlock for access to all 99 flashcards in this deck.
Unlock Deck
k this deck
40
What are the degrees of freedom associated with the regression sum of squares?
A) Number of independent variables
B) 1
C) F-ratio
D) (n - 2)
E) None of these statements are correct
A) Number of independent variables
B) 1
C) F-ratio
D) (n - 2)
E) None of these statements are correct
Unlock Deck
Unlock for access to all 99 flashcards in this deck.
Unlock Deck
k this deck
41
The coefficient of determination measures the proportion of
A) explained variation relative to total variation.
B) variation due to the relationship among variables.
C) error variation relative to total variation.
D) variation due to regression.
E) None of these statements are correct.
A) explained variation relative to total variation.
B) variation due to the relationship among variables.
C) error variation relative to total variation.
D) variation due to regression.
E) None of these statements are correct.
Unlock Deck
Unlock for access to all 99 flashcards in this deck.
Unlock Deck
k this deck
42
A manager at a local bank analyzed the relationship between monthly salary and three independent variables: length of service (measured in months), gender (0 = female, 1 = male) and job type (0 = clerical, 1 = technical). The following ANOVA summarizes the regression results: Based on the ANOVA, the multiple coefficient of determination is
A) 5.957%
B) 59.3%
C) 40.7%
D) cannot be computed
Based on the ANOVA, the multiple coefficient of determination isA) 5.957%
B) 59.3%
C) 40.7%
D) cannot be computed
Unlock Deck
Unlock for access to all 99 flashcards in this deck.
Unlock Deck
k this deck
43
i. If the null hypothesis β4 = 0 is not rejected, then the independent variable X4 has a strong effect in predicting the dependent variable ii. A dummy variable is added to the regression equation to control for error.
Iii) A variable whose possible outcomes are coded as a "1" or a "0" is called a strong independent variable.
A) (i), (ii) and (iii) are all correct statements
B) (i) and (ii) are correct statements, but not (iii).
C) (i) and (iii) are correct statements but not (ii).
D) (ii) and (iii) are correct statements but not (i).
E) All statements are false
Unlock Deck
Unlock for access to all 99 flashcards in this deck.
Unlock Deck
k this deck
44
In multiple regression, a dummy variable can be included in a multiple regression model as
A) An additional quantitative variable
B) A nominal variable with three or more values
C) A nominal variable with only two values
D) A new regression coefficient
A) An additional quantitative variable
B) A nominal variable with three or more values
C) A nominal variable with only two values
D) A new regression coefficient
Unlock Deck
Unlock for access to all 99 flashcards in this deck.
Unlock Deck
k this deck
45
i. A variable whose possible outcomes are coded as a "1" or a "0" is called a dummy variable.
ii. A dummy variable is added to the regression equation to control for error.
Iii) If the null hypothesis ?4 = 0 is not rejected, then the independent variable X4 has no effect in predicting the dependent variable.
A) (i), (ii) and (iii) are all correct statements
B) (i) and (ii) are correct statements, but not (iii).
C) (i) and (iii) are correct statements but not (ii).
D) (ii) and (iii) are correct statements but not (i).
E) All statements are false
Unlock Deck
Unlock for access to all 99 flashcards in this deck.
Unlock Deck
k this deck
46
The best example of a null hypothesis for a global test of a multiple regression model is:
A) H0: ?1 = ?2=?3 = ?4
B) H0: ?1 = ?2 = ?3 = ?4
C) H0: ?1 = 0
D) If F is greater than 20.00 then reject
A) H0: ?1 = ?2=?3 = ?4
B) H0: ?1 = ?2 = ?3 = ?4
C) H0: ?1 = 0
D) If F is greater than 20.00 then reject
Unlock Deck
Unlock for access to all 99 flashcards in this deck.
Unlock Deck
k this deck
47
The information above is from the multiple regression analysis computer output for 28 teams in Major League Baseball. The model is designed to predict wins using attendance, payroll, batting average, home runs, stolen bases, errors, and team ERA. The critical value of F to be used in the global test of the model is: (5% level of significance)A) 2.51
B) 2.58
C) 3.70
D) 5.57
E) 3.39
Unlock Deck
Unlock for access to all 99 flashcards in this deck.
Unlock Deck
k this deck
48
The best example of an alternate hypothesis for a global test of a multiple regression model is:
A) H1: ?1 = ?2 = ?3 = ?4
B) H1:?1 ?2 ?3 ?4
C) H1: Not all the ?'s are 0
D) If F is less than 20.00 then fail to reject
A) H1: ?1 = ?2 = ?3 = ?4
B) H1:?1 ?2 ?3 ?4
C) H1: Not all the ?'s are 0
D) If F is less than 20.00 then fail to reject
Unlock Deck
Unlock for access to all 99 flashcards in this deck.
Unlock Deck
k this deck
49
What test investigates whether all the independent variables have zero net regression coefficients?
A) Multicollinearity
B) Autocorrelation
C) Global
D) Pearson
E) None of these statements are correct
A) Multicollinearity
B) Autocorrelation
C) Global
D) Pearson
E) None of these statements are correct
Unlock Deck
Unlock for access to all 99 flashcards in this deck.
Unlock Deck
k this deck
50
How is the degree of association between the set of independent variables and the dependent variable is measured?
A) Confidence intervals.
B) Autocorrelation
C) Coefficient of multiple determination
D) Standard error of estimate
E) None of these statements are correct
A) Confidence intervals.
B) Autocorrelation
C) Coefficient of multiple determination
D) Standard error of estimate
E) None of these statements are correct
Unlock Deck
Unlock for access to all 99 flashcards in this deck.
Unlock Deck
k this deck
51
i. The multiple standard error of estimate measures the variation about the regression plane when two independent variables are considered.
Ii) A multiple correlation determination equalling -0.76 is definitely possible.
Iii) The number of degrees of freedom associated with the regression sum of squares in the regression equation model equals the number of independent variables.
A) (i), (ii) and (iii) are all correct statements
B) (i) and (ii) are correct statements, but not (iii).
C) (i) and (iii) are correct statements but not (ii).
D) (ii) and (iii) are correct statements but not (i).
E) All statements are false
Unlock Deck
Unlock for access to all 99 flashcards in this deck.
Unlock Deck
k this deck
52
Which of the following is a characteristic of the F-distribution?
A) Normally distributed
B) Positively skewed
C) Negatively skewed
D) Equal to the t-distribution
E) None of these statements are correct
A) Normally distributed
B) Positively skewed
C) Negatively skewed
D) Equal to the t-distribution
E) None of these statements are correct
Unlock Deck
Unlock for access to all 99 flashcards in this deck.
Unlock Deck
k this deck
53
What is the measurement of explained variation?
A) Coefficient of multiple determination
B) Coefficient of multiple nondetermination
C) Regression coefficient
D) Correlation matrix
E) None of these statements are correct
A) Coefficient of multiple determination
B) Coefficient of multiple nondetermination
C) Regression coefficient
D) Correlation matrix
E) None of these statements are correct
Unlock Deck
Unlock for access to all 99 flashcards in this deck.
Unlock Deck
k this deck
54
What happens as the scatter of data values about the regression plane increases?
A) Standard error of estimate increases
B) R2 decreases
C) (1 - R2) increases
D) Residual sum of squares increases
E) All of the choices are correct
A) Standard error of estimate increases
B) R2 decreases
C) (1 - R2) increases
D) Residual sum of squares increases
E) All of the choices are correct
Unlock Deck
Unlock for access to all 99 flashcards in this deck.
Unlock Deck
k this deck
55
What is the range of values for multiple R?
A) -100% to -100% inclusive
B) -100% to 0% inclusive
C) 0% to +100% inclusive
D) Unlimited range
E) None of these statements are correct
A) -100% to -100% inclusive
B) -100% to 0% inclusive
C) 0% to +100% inclusive
D) Unlimited range
E) None of these statements are correct
Unlock Deck
Unlock for access to all 99 flashcards in this deck.
Unlock Deck
k this deck
56
The information above is from the multiple regression analysis computer output for 28 teams in Major League Baseball. The model is designed to predict wins using attendance, payroll, batting average, home runs, stolen bases, errors, and team ERA. The computed F for the global test is:A) 7.802
B) 25.695
C) 15.790
D) 26.981
E) 114.779
Unlock Deck
Unlock for access to all 99 flashcards in this deck.
Unlock Deck
k this deck
57
Which test statistic do we apply to test the null hypothesis that the multiple regression coefficients are all zero?
A) z
B) t
C) F
D) SPSS-X
E) None of these statements are correct
A) z
B) t
C) F
D) SPSS-X
E) None of these statements are correct
Unlock Deck
Unlock for access to all 99 flashcards in this deck.
Unlock Deck
k this deck
58
If the coefficient of multiple determination is 0.81, what percent of variation is not explained?
A) 19%
B) 90%
C) 66%
D) 81%
E) None of these statements are correct
A) 19%
B) 90%
C) 66%
D) 81%
E) None of these statements are correct
Unlock Deck
Unlock for access to all 99 flashcards in this deck.
Unlock Deck
k this deck
59
i. The multiple coefficient of determination, R2, reports the proportion of the variation in Y that is explained by the variation in the set of independent variables.
ii. The coefficient of multiple determination reports the strength of the association between the dependent variable and the set of independent variables.
Iii) A multiple correlation determination equalling -0.76 is definitely possible.
A) (i), (ii) and (iii) are all correct statements
B) (i) and (ii) are correct statements, but not (iii).
C) (i) and (iii) are correct statements but not (ii).
D) (ii) and (iii) are correct statements but not (i).
E) All statements are false
Unlock Deck
Unlock for access to all 99 flashcards in this deck.
Unlock Deck
k this deck
60
A manager at a local bank analyzed the relationship between monthly salary and three independent variables: length of service (measured in months), gender (0 = female, 1 = male) and job type (0 =
Clerical, 1 = technical). The following ANOVA summarizes the regression results: Based on the ANOVA and a 0.05 significance level, the global null hypothesis test of the multiple regression model
A) Will be rejected and conclude that monthly salary is related to all of the independent variables
B) Will be rejected and conclude that monthly salary is related to at least one of the independent variables.
C) Will not be rejected.
D) Will show a high multiple coefficient of determination
Clerical, 1 = technical). The following ANOVA summarizes the regression results:
Based on the ANOVA and a 0.05 significance level, the global null hypothesis test of the multiple regression modelA) Will be rejected and conclude that monthly salary is related to all of the independent variables
B) Will be rejected and conclude that monthly salary is related to at least one of the independent variables.
C) Will not be rejected.
D) Will show a high multiple coefficient of determination
Unlock Deck
Unlock for access to all 99 flashcards in this deck.
Unlock Deck
k this deck
61
Hypotheses concerning individual regression coefficients are tested using which statistic?
A) t-statistic
B) z-statistic
C)?2 (chi-square statistic)
D) H
E) None of these statements are correct
A) t-statistic
B) z-statistic
C)?2 (chi-square statistic)
D) H
E) None of these statements are correct
Unlock Deck
Unlock for access to all 99 flashcards in this deck.
Unlock Deck
k this deck
62
It has been hypothesized that overall academic success for freshmen at college as measured by grade point average (GPA) is a function of IQ scores (X1), hours spent studying each week (X2), and one's high school average (X3). Suppose the regression equation is:
Y' = -6.9 + 0.055X1 + 0.107X2 + 0.0083X3.
The multiple standard error is 6.313 and R2 = 0.826.
-How will a student's GPA be affected if an additional hour is spent studying each weeknight? ____________
Y' = -6.9 + 0.055X1 + 0.107X2 + 0.0083X3.
The multiple standard error is 6.313 and R2 = 0.826.
-How will a student's GPA be affected if an additional hour is spent studying each weeknight? ____________
Unlock Deck
Unlock for access to all 99 flashcards in this deck.
Unlock Deck
k this deck
63
i. A variable whose possible outcomes are coded as a "1" or a "0" is called a dummy variable.
ii. If the null hypothesis ?4 = 0 is not rejected, then the independent variable X4 has no effect in predicting the dependent variable.
Iii) A dummy variable is added to the regression equation to control for error.
A) (i), (ii) and (iii) are all correct statements
B) (i) and (ii) are correct statements, but not (iii).
C) (i) and (iii) are correct statements but not (ii).
D) (ii) and (iii) are correct statements but not (i).
E) All statements are false
Unlock Deck
Unlock for access to all 99 flashcards in this deck.
Unlock Deck
k this deck
64
A manager at a local bank analyzed the relationship between monthly salary and three independent variables: length of service (measured in months), gender (0 = female, 1 = male) and job type (0 = Clerical, 1 = technical). The following ANOVA summarizes the regression results: Based on the hypothesis tests for the individual regression coefficients,
A) All the regression coefficients are not equal to zero.
B) "job" is the only significant variable in the model
C) Only months of service and gender are significantly related to monthly salary.
D) "service" is the only significant variable in the model
Based on the hypothesis tests for the individual regression coefficients,A) All the regression coefficients are not equal to zero.
B) "job" is the only significant variable in the model
C) Only months of service and gender are significantly related to monthly salary.
D) "service" is the only significant variable in the model
Unlock Deck
Unlock for access to all 99 flashcards in this deck.
Unlock Deck
k this deck
65
The information above is from the multiple regression analysis computer output for 28 teams in Major League Baseball. The model is designed to predict wins using attendance, payroll, batting average, home runs, stolen bases, errors, and team ERA. The t-value computed for testing the coefficient "Batg. Avg." is:
A) 112.991
B) 2.086
C) 7.438
D) 2.832
E) -1.593
Unlock Deck
Unlock for access to all 99 flashcards in this deck.
Unlock Deck
k this deck
66
It has been hypothesized that overall academic success for freshmen at college as measured by grade point average (GPA) is a function of IQ scores (X1), hours spent studying each week (X2), and one's high school average (X3). Suppose the regression equation is:
Y' = -6.9 + 0.055X1 + 0.107X2 + 0.0083X3.
The multiple standard error is 6.313 and R2 = 0.826.
-For which independent variable does a unit change have the greatest effect on the GPA? ____________
Y' = -6.9 + 0.055X1 + 0.107X2 + 0.0083X3.
The multiple standard error is 6.313 and R2 = 0.826.
-For which independent variable does a unit change have the greatest effect on the GPA? ____________
Unlock Deck
Unlock for access to all 99 flashcards in this deck.
Unlock Deck
k this deck
67
Twenty-one executives in a large corporation were randomly selected for a study in which several factors were examined to determine their effect on annual salary (expressed in $000's). The factors selected were age, seniority, years of college, number of company divisions they had been exposed to and the level of their responsibility. A regression analysis was performed using a popular spreadsheet program with the following regression output:
-Which of the following has the most influence on salary--20 years of seniority, 5 years of college or attaining 55 years of age?____________
-Which of the following has the most influence on salary--20 years of seniority, 5 years of college or attaining 55 years of age?____________
Unlock Deck
Unlock for access to all 99 flashcards in this deck.
Unlock Deck
k this deck
68
The following correlations were computed as part of a multiple regression analysis that used education, job, and age to predict income.
What is this table called?
A) Net regression coefficients
B) Coefficients of nondetermination
C) Analysis of variance
D) Correlation matrix
E) None of these statements are correct
What is this table called?
A) Net regression coefficients
B) Coefficients of nondetermination
C) Analysis of variance
D) Correlation matrix
E) None of these statements are correct
Unlock Deck
Unlock for access to all 99 flashcards in this deck.
Unlock Deck
k this deck
69
What is it called when the independent variables are highly correlated?
A) Autocorrelation
B) Multicollinearity
C) Homoscedasticity
D) Zero correlation
E) None of these statements are correct
A) Autocorrelation
B) Multicollinearity
C) Homoscedasticity
D) Zero correlation
E) None of these statements are correct
Unlock Deck
Unlock for access to all 99 flashcards in this deck.
Unlock Deck
k this deck
70
What can we conclude if the net regression coefficients in the population are not significantly different from zero?
A) Strong relationship exists among the variables
B) No relationship exists between the dependent variable and the independent variables
C) Independent variables are good predictors
D) Good forecasts are possible
E) None of these statements are correct
A) Strong relationship exists among the variables
B) No relationship exists between the dependent variable and the independent variables
C) Independent variables are good predictors
D) Good forecasts are possible
E) None of these statements are correct
Unlock Deck
Unlock for access to all 99 flashcards in this deck.
Unlock Deck
k this deck
71
The following correlations were computed as part of a multiple regression analysis that used education, job, and age to predict income.
Which independent variable has the weakest association with the dependent variable?
A) Income
B) Age
C) Education
D) Job
E) None of these statements are correct
Which independent variable has the weakest association with the dependent variable?
A) Income
B) Age
C) Education
D) Job
E) None of these statements are correct
Unlock Deck
Unlock for access to all 99 flashcards in this deck.
Unlock Deck
k this deck
72
When does multicollinearity occur in a multiple regression analysis?
A) Dependent variables are highly correlated
B) Independent variables are minimally correlated
C) Independent variables are highly correlated
D) Independent variables have no correlation
E) None of these statements are correct
A) Dependent variables are highly correlated
B) Independent variables are minimally correlated
C) Independent variables are highly correlated
D) Independent variables have no correlation
E) None of these statements are correct
Unlock Deck
Unlock for access to all 99 flashcards in this deck.
Unlock Deck
k this deck
73
Angela Chou has been asked to investigate the determinants of poverty in Ontario communities. She collected data on 60 communities from Statistics Canada. She selected the percentage of poor persons
Living under the poverty line [Poor (%)], measured by Low Income Cut-Off, and designed by Statistics
Canada as a measure of poverty for a community, as the dependent variable. The independent variables selected are percent of single families in each community, the unemployment rate in each community, percent of population in the community holding a bachelor's degree as their highest level of education attained, and percent of population holding a High School Diploma as their highest level of education attained. Using the output below, determine which variable Angela should consider deleting.
A) It doesn't matter which she uses, the results are virtually the same in any case.
B) Angela should delete the high school information, because the P-value is over 0.05.
C) Angela should delete the bachelor's degree information, because the P-value is close to 0.05
D) Angela should delete the unemployment rate information because the P-value is 0.00
E) Angela should exclude the single-family and unemployment information because the P-value values are 0.
Unlock Deck
Unlock for access to all 99 flashcards in this deck.
Unlock Deck
k this deck
74
A manager at a local bank analyzed the relationship between monthly salary and three independent variables: length of service (measured in months), gender (0 = female, 1 = male) and job type (0 = Clerical, 1 = technical). The following ANOVA summarizes the regression results: The results for the variable gender show that
A) males average $222.78 more than females in monthly salary
B) females average $222.78 more than males in monthly salary
C) gender is not related to monthly salary
D) Gender and months of service are correlated.
The results for the variable gender show thatA) males average $222.78 more than females in monthly salary
B) females average $222.78 more than males in monthly salary
C) gender is not related to monthly salary
D) Gender and months of service are correlated.
Unlock Deck
Unlock for access to all 99 flashcards in this deck.
Unlock Deck
k this deck
75
Twenty-one executives in a large corporation were randomly selected for a study in which several factors were examined to determine their effect on annual salary (expressed in $000's). The factors selected were age, seniority, years of college, number of company divisions they had been exposed to and the level of their responsibility. A regression analysis was performed using a popular spreadsheet program with the following regression output:
-Write out the multiple regression equation____________.
-Write out the multiple regression equation____________.
Unlock Deck
Unlock for access to all 99 flashcards in this deck.
Unlock Deck
k this deck
76
The following summary is from home heating costs, using mean outside temperature as X1 the number of centimetres of insulation as X2, and the presence of a garage as X3. Is the presence of the independent variable garage significant in predicting heating costs, when tested at the 0.05 level of significance?
A) Since the p-value is less than the level of significance, the null hypothesis is rejected, and so the garage should be included in the analysis.
B) Since the p-value is less than the level of significance, the null hypothesis is accepted, and so the garage should not be included in the analysis.
C) Since the p-value is more than the level of significance, the null hypothesis is accepted, and so the garage should not be included in the analysis.
D) Since the p-value is more than the level of significance, the null hypothesis is rejected, and so the garage should be included in the analysis.
Unlock Deck
Unlock for access to all 99 flashcards in this deck.
Unlock Deck
k this deck
77
If the correlation between the two independent variables of a regression analysis is 0.11 and each independent variable is highly correlated to the dependent variable, what does this indicate?
A) Multicollinearity between these two independent variables
B) Negative relationship is not possible
C) Only one of the two independent variables will explain a high percent of the variation
D) An effective regression equation
E) None of these statements are correct
A) Multicollinearity between these two independent variables
B) Negative relationship is not possible
C) Only one of the two independent variables will explain a high percent of the variation
D) An effective regression equation
E) None of these statements are correct
Unlock Deck
Unlock for access to all 99 flashcards in this deck.
Unlock Deck
k this deck
78
The following correlations were computed as part of a multiple regression analysis that used education, job, and age to predict income.
Which independent variable has the strongest association with the dependent variable?
A) Income
B) Age
C) Education
D) Job
E) None of these statements are correct
Which independent variable has the strongest association with the dependent variable?
A) Income
B) Age
C) Education
D) Job
E) None of these statements are correct
Unlock Deck
Unlock for access to all 99 flashcards in this deck.
Unlock Deck
k this deck
79
What does the correlation matrix for a multiple regression analysis contain?
A) Multiple correlation coefficients
B) Simple correlation coefficients
C) Multiple coefficients of determination
D) Multiple standard errors of estimate
E) None of these statements are correct
A) Multiple correlation coefficients
B) Simple correlation coefficients
C) Multiple coefficients of determination
D) Multiple standard errors of estimate
E) None of these statements are correct
Unlock Deck
Unlock for access to all 99 flashcards in this deck.
Unlock Deck
k this deck
80
It has been hypothesized that overall academic success for freshmen at college as measured by grade point average (GPA) is a function of IQ scores (X1), hours spent studying each week (X2), and one's high school average (X3). Suppose the regression equation is:
Y' = -6.9 + 0.055X1 + 0.107X2 + 0.0083X3.
The multiple standard error is 6.313 and R2 = 0.826.
-How many dependent variables are in the regression equation?____________
Y' = -6.9 + 0.055X1 + 0.107X2 + 0.0083X3.
The multiple standard error is 6.313 and R2 = 0.826.
-How many dependent variables are in the regression equation?____________
Unlock Deck
Unlock for access to all 99 flashcards in this deck.
Unlock Deck
k this deck
Unlock Deck
Unlock for access to all 99 flashcards in this deck.


