Deck 10: Tests With Qualitative Data
Full screen (f)
Question
Question
The following MINITAB output display presents a 95% confidence interval for the difference 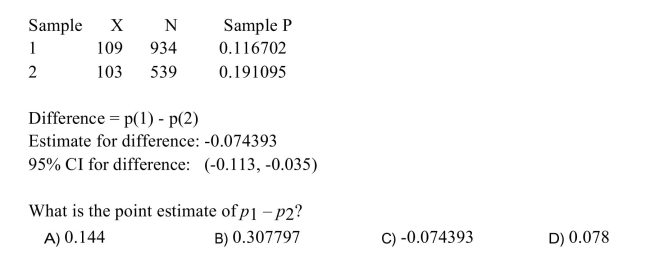
Question
Question
Question
The following display from a TI-84 Plus calculator presents a 95 % confidence interval for the difference between two means. The sample sizes are 
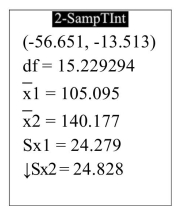
How many degrees of freedom did the calculator use?
A) 15.229294
B) -0.549
C) 105.095
D) -35.082
How many degrees of freedom did the calculator use?
A) 15.229294
B) -0.549
C) 105.095
D) -35.082
Question
The following display from a TI-84 Plus calculator presents a 95% confidence interval for the 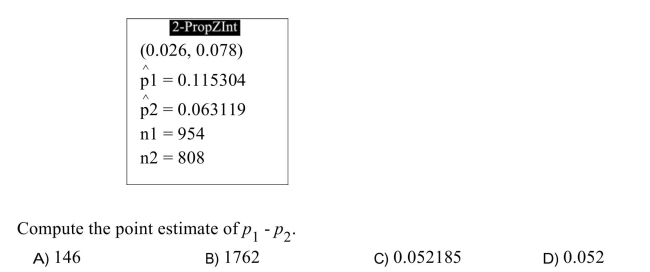
Question
Construct the confidence interval for the difference  for the given level and values of
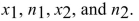
Level 98%:
A) (-0.084,0.288)
B) (-0.079,0.283)
C) (-0.062,0.266)
D) (-0.073,0.277)
for the given level and values of Level 98%:
A) (-0.084,0.288)
B) (-0.079,0.283)
C) (-0.062,0.266)
D) (-0.073,0.277)
Question
In an agricultural experiment,) 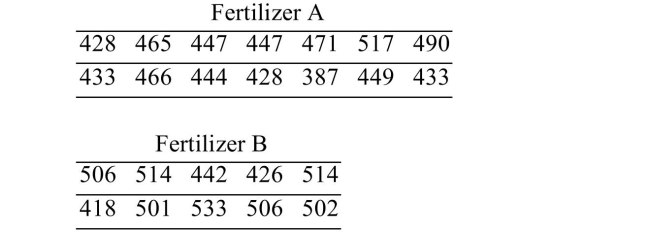 Assume that the populations are approximately normal. Construct a 99% confidence interval for the difference between the mean yields for the two types of fertilizer. Based on your
Results, is it reasonable to conclude that the mean yields may be the same for fertilizers A
And B?
A)No
B)Yes
Assume that the populations are approximately normal. Construct a 99% confidence interval for the difference between the mean yields for the two types of fertilizer. Based on yourResults, is it reasonable to conclude that the mean yields may be the same for fertilizers A
And B?
A)No
B)Yes
Question
The following MINITAB output display presents a 95% confidence interval for the difference 
Question
A amateur golfer wishes to determine if there is a difference between the drive distances  Assume that the populations are approximately normal. Construct a 95% confidence interval for the difference between the mean drive distances for the two drivers.
A)(-32.8, 18.2)
B)(-38.8, 24.1)
C)(-36.3, 21.9)
D)(-42.0, 27.3)
Assume that the populations are approximately normal. Construct a 95% confidence interval for the difference between the mean drive distances for the two drivers.A)(-32.8, 18.2)
B)(-38.8, 24.1)
C)(-36.3, 21.9)
D)(-42.0, 27.3)
Question
In an agricultural experiment,) 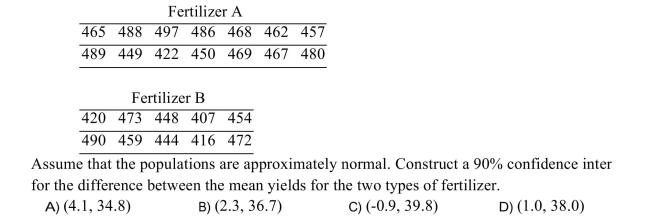
Question
An amateur golfer wishes to determine if there is a difference between the drive 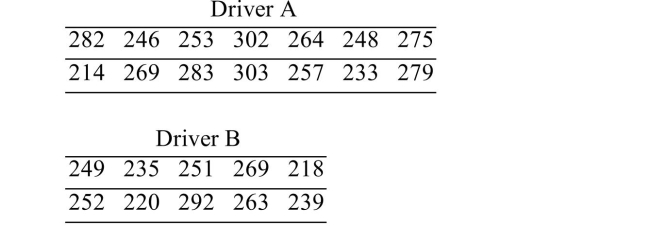 Assume that the populations are approximately normal. Construct a 90% confidence interval for the difference between the mean drive distances for the two drivers. Based on your
Results, is it reasonable to conclude that the mean drive distances may be the same for
Drivers A and B?
A)No
B)Yes
Assume that the populations are approximately normal. Construct a 90% confidence interval for the difference between the mean drive distances for the two drivers. Based on yourResults, is it reasonable to conclude that the mean drive distances may be the same for
Drivers A and B?
A)No
B)Yes
Question
The following display from a TI-84 Plus calculator presents a 95 % confidence interval for the difference between two means. The sample sizes are 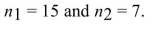

Compute the point estimate of
A) 48.498
B) -39.701
C) 105.575
D) -0.205
Compute the point estimate of
A) 48.498
B) -39.701
C) 105.575
D) -0.205
Question
The following MINITAB output display presents a 95% confidence interval for the difference 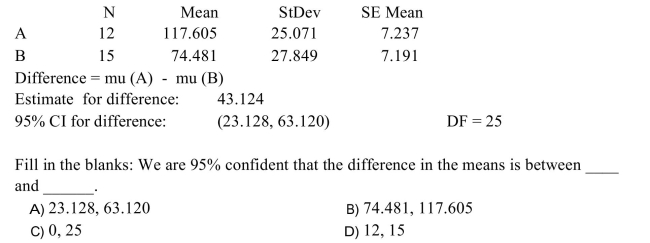
Question
The following display from a TI-84 Plus calculator presents a 95% confidence interval for the n 
Question
Question
The following display from a TI-84 Plus calculator presents a 95% confidence interval for the difference between two means. The sample sizes are 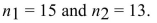
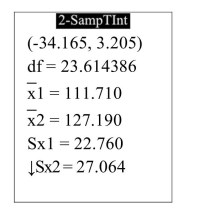
Fill in the blanks: We are 95% confident that the difference between the means is between ____ and _____.
A) 111.710,127.190
B) 22.760,27.064
C) -34.165,3.205
D) 0,23.614386
Fill in the blanks: We are 95% confident that the difference between the means is between ____ and _____.
A) 111.710,127.190
B) 22.760,27.064
C) -34.165,3.205
D) 0,23.614386
Question
Construct the confidence interval for the difference  for the given level and values of
Level 90% ,
A) (10.8,14.0)
B) (9.0,15.8)
C) (10.3,14.5)
D) (7.2,17.6)
for the given level and values of Level 90% ,
A) (10.8,14.0)
B) (9.0,15.8)
C) (10.3,14.5)
D) (7.2,17.6)
Question
Question
The following MINITAB output display presents a 95% confidence interval for the difference 
Question
The following display from a TI-84 Plus calculator presents a 95% confidence interval for the 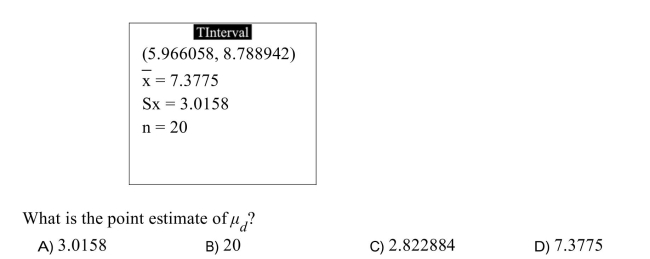
Question
Two microprocessors are compared on a sample of 6 benchmark codes to determine whether 
Question
The following MINITAB output display presents a 95% confidence interval for the difference 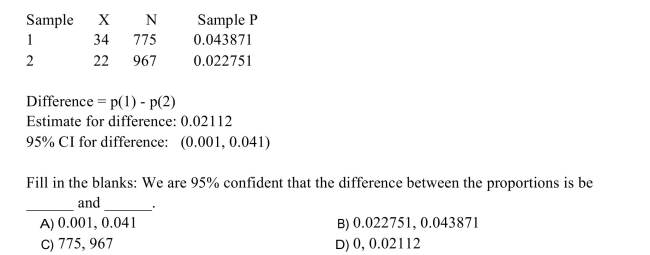
Question
The following display from a TI-84 Plus calculator presents a 95% confidence interval 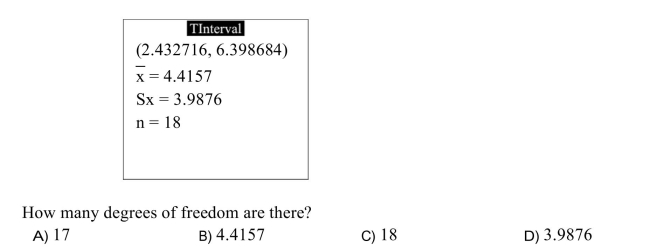
Question
The following output from MINITAB presents a confidence interval for the mean difference between matched pairs.
95 % CI for mean difference: (7.74239,9.78921)
Fill in the blanks: We are 95 % confident that the mean difference is between and
A) 6.5791,10.9525
B) 0,8.7658
C) 7.74239,9.78921
D) 0.488961,2.1867
95 % CI for mean difference: (7.74239,9.78921)
Fill in the blanks: We are 95 % confident that the mean difference is between and
A) 6.5791,10.9525
B) 0,8.7658
C) 7.74239,9.78921
D) 0.488961,2.1867
Question
The following output from MINITAB presents a confidence interval for the mean differer between matched pairs.
95% CI for mean difference: (9.639447,12.773153)
What is the point estimate of
A) 11.2063
B) 17
C) 3.1508
D) 0.742651
95% CI for mean difference: (9.639447,12.773153)
What is the point estimate of
A) 11.2063
B) 17
C) 3.1508
D) 0.742651
Question
Question
The following output from MINITAB presents a confidence interval for the mean differer between matched pairs.
95% CI for mean difference: (4.672247,8.894353)
How many degrees of freedom are there?
A) 4.1059
B) 16
C) 0.995827
D) 17
95% CI for mean difference: (4.672247,8.894353)
How many degrees of freedom are there?
A) 4.1059
B) 16
C) 0.995827
D) 17
Question
A group of six individuals with high blood pressure volunteered to test whether petting cats for 10  A researcher claims that the mean reduction in systolic blood pressure is 11 mmHg. Does the 98% confidence interval contradict this claim? (Hint: you need to find the 98%
Confidence interval for the mean reduction in systolic blood pressure.)
A)Yes
B)No
A researcher claims that the mean reduction in systolic blood pressure is 11 mmHg. Does the 98% confidence interval contradict this claim? (Hint: you need to find the 98%Confidence interval for the mean reduction in systolic blood pressure.)
A)Yes
B)No
Question
The following display from a TI-84 Plus calculator presents a 95% confidence interval for the 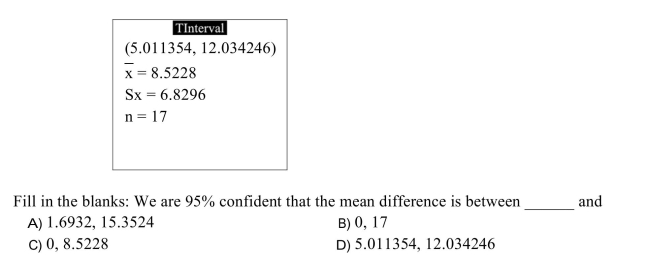
Question
A group of six individuals with high blood pressure volunteered to test whether petting cats for 10 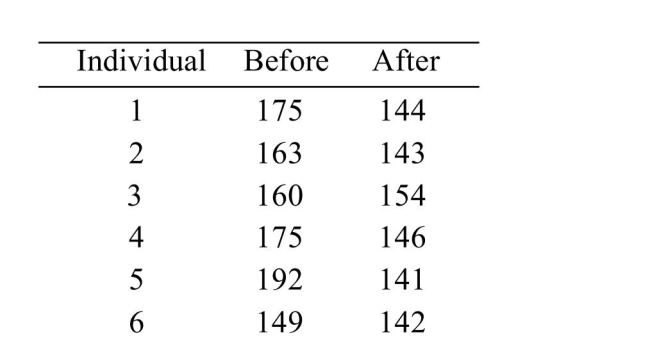 Find the 98% confidence interval for the mean reduction in systolic blood pressure.
A)(0.05, 50.27)
B)(-3.90, 51.90)
C)(-2.27, -3.90)
D)(0.75, 47.25)
Find the 98% confidence interval for the mean reduction in systolic blood pressure.A)(0.05, 50.27)
B)(-3.90, 51.90)
C)(-2.27, -3.90)
D)(0.75, 47.25)
Question
Two microprocessors are compared on a sample of 6 benchmark codes to determine whether 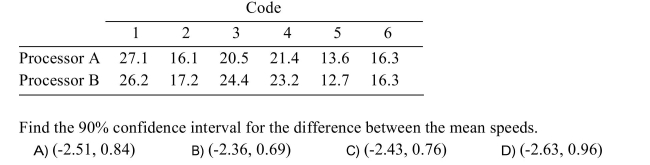
Question
A group of six individuals with high cholesterol levels were given a new diet designed to lower  Find the 95% confidence interval for the mean reduction in cholesterol level.
A)(12.87, 48.46)
B)(11.09, 9.85)
C)(11.98, 50.24)
D)(9.85, 51.49)
Find the 95% confidence interval for the mean reduction in cholesterol level.A)(12.87, 48.46)
B)(11.09, 9.85)
C)(11.98, 50.24)
D)(9.85, 51.49)

Unlock Deck
Sign up to unlock the cards in this deck!
Unlock Deck
Unlock Deck
1/33
Play
Full screen (f)
Deck 10: Tests With Qualitative Data
1
A survey of college students reported that in a sample of 384 males students, the average Construct a 90% confidence interval for the difference between men and women in the
Mean number of energy drinks consumed. Based on your results, is it reasonable to
Believe that the mean number of energy drinks consumed my be the same for both male
And female students?
A)No
B)Yes
Mean number of energy drinks consumed. Based on your results, is it reasonable to
Believe that the mean number of energy drinks consumed my be the same for both male
And female students?
A)No
B)Yes
A
2
The following MINITAB output display presents a 95% confidence interval for the difference
C
3
The concentration of hexane (a common solvent)was measured in units of micrograms It is reasonable to assume that both samples come from populations that are approximately
Normal. Construct a 99% confidence interval for the reduction of hexane concentration
After treatment.
A)(175.6, 180.8)
B)(175.1, 181.3)
C)(176.7, 179.7)
D)(170.9, 185.5)
Normal. Construct a 99% confidence interval for the reduction of hexane concentration
After treatment.
A)(175.6, 180.8)
B)(175.1, 181.3)
C)(176.7, 179.7)
D)(170.9, 185.5)
D
4
A computer software magazine compares the rates of malware infection for computers Assuming these to be random samples of infection rates for the two security software packages,
Construct a 98% confidence interval for the difference between the proportions of
Infection for the two types of security software packages. Does the confidence interval
Contradict the claim that the proportion of infections is the same for the two types of
Security software?
A)Yes
B)No
Construct a 98% confidence interval for the difference between the proportions of
Infection for the two types of security software packages. Does the confidence interval
Contradict the claim that the proportion of infections is the same for the two types of
Security software?
A)Yes
B)No
Unlock Deck
Unlock for access to all 33 flashcards in this deck.
Unlock Deck
k this deck
5
The following display from a TI-84 Plus calculator presents a 95 % confidence interval for the difference between two means. The sample sizes are
How many degrees of freedom did the calculator use?
A) 15.229294
B) -0.549
C) 105.095
D) -35.082
How many degrees of freedom did the calculator use?
A) 15.229294
B) -0.549
C) 105.095
D) -35.082
Unlock Deck
Unlock for access to all 33 flashcards in this deck.
Unlock Deck
k this deck
6
The following display from a TI-84 Plus calculator presents a 95% confidence interval for the
Unlock Deck
Unlock for access to all 33 flashcards in this deck.
Unlock Deck
k this deck
7
Construct the confidence interval for the difference for the given level and values of
Level 98%:
A) (-0.084,0.288)
B) (-0.079,0.283)
C) (-0.062,0.266)
D) (-0.073,0.277)
for the given level and values of Level 98%:
A) (-0.084,0.288)
B) (-0.079,0.283)
C) (-0.062,0.266)
D) (-0.073,0.277)
Unlock Deck
Unlock for access to all 33 flashcards in this deck.
Unlock Deck
k this deck
8
In an agricultural experiment,) Assume that the populations are approximately normal. Construct a 99% confidence interval for the difference between the mean yields for the two types of fertilizer. Based on your
Results, is it reasonable to conclude that the mean yields may be the same for fertilizers A
And B?
A)No
B)Yes
Assume that the populations are approximately normal. Construct a 99% confidence interval for the difference between the mean yields for the two types of fertilizer. Based on yourResults, is it reasonable to conclude that the mean yields may be the same for fertilizers A
And B?
A)No
B)Yes
Unlock Deck
Unlock for access to all 33 flashcards in this deck.
Unlock Deck
k this deck
9
The following MINITAB output display presents a 95% confidence interval for the difference
Unlock Deck
Unlock for access to all 33 flashcards in this deck.
Unlock Deck
k this deck
10
A amateur golfer wishes to determine if there is a difference between the drive distances Assume that the populations are approximately normal. Construct a 95% confidence interval for the difference between the mean drive distances for the two drivers.
A)(-32.8, 18.2)
B)(-38.8, 24.1)
C)(-36.3, 21.9)
D)(-42.0, 27.3)
Assume that the populations are approximately normal. Construct a 95% confidence interval for the difference between the mean drive distances for the two drivers.A)(-32.8, 18.2)
B)(-38.8, 24.1)
C)(-36.3, 21.9)
D)(-42.0, 27.3)
Unlock Deck
Unlock for access to all 33 flashcards in this deck.
Unlock Deck
k this deck
11
In an agricultural experiment,)
Unlock Deck
Unlock for access to all 33 flashcards in this deck.
Unlock Deck
k this deck
12
An amateur golfer wishes to determine if there is a difference between the drive Assume that the populations are approximately normal. Construct a 90% confidence interval for the difference between the mean drive distances for the two drivers. Based on your
Results, is it reasonable to conclude that the mean drive distances may be the same for
Drivers A and B?
A)No
B)Yes
Assume that the populations are approximately normal. Construct a 90% confidence interval for the difference between the mean drive distances for the two drivers. Based on yourResults, is it reasonable to conclude that the mean drive distances may be the same for
Drivers A and B?
A)No
B)Yes
Unlock Deck
Unlock for access to all 33 flashcards in this deck.
Unlock Deck
k this deck
13
The following display from a TI-84 Plus calculator presents a 95 % confidence interval for the difference between two means. The sample sizes are
Compute the point estimate of
A) 48.498
B) -39.701
C) 105.575
D) -0.205
Compute the point estimate of
A) 48.498
B) -39.701
C) 105.575
D) -0.205
Unlock Deck
Unlock for access to all 33 flashcards in this deck.
Unlock Deck
k this deck
14
The following MINITAB output display presents a 95% confidence interval for the difference
Unlock Deck
Unlock for access to all 33 flashcards in this deck.
Unlock Deck
k this deck
15
The following display from a TI-84 Plus calculator presents a 95% confidence interval for the n
Unlock Deck
Unlock for access to all 33 flashcards in this deck.
Unlock Deck
k this deck
16
A survey of college students reported that in a sample of 433 males students, the averagenumber of energy drinks consumed per month was 2.40 with a standard deviation of4.71, and in a sample of 63 female students, the average was 1.67 with a standarddeviation of 3.50.Construct a 98% confidence interval for the difference between men and women in themean number of energy drinks consumed.
A)(-0.53, 1.99)
B)(-9.61, 11.07)
C)(-0.38, 1.84)
D)(-0.49, 1.95)
A)(-0.53, 1.99)
B)(-9.61, 11.07)
C)(-0.38, 1.84)
D)(-0.49, 1.95)
Unlock Deck
Unlock for access to all 33 flashcards in this deck.
Unlock Deck
k this deck
17
The following display from a TI-84 Plus calculator presents a 95% confidence interval for the difference between two means. The sample sizes are
Fill in the blanks: We are 95% confident that the difference between the means is between ____ and _____.
A) 111.710,127.190
B) 22.760,27.064
C) -34.165,3.205
D) 0,23.614386
Fill in the blanks: We are 95% confident that the difference between the means is between ____ and _____.
A) 111.710,127.190
B) 22.760,27.064
C) -34.165,3.205
D) 0,23.614386
Unlock Deck
Unlock for access to all 33 flashcards in this deck.
Unlock Deck
k this deck
18
Construct the confidence interval for the difference for the given level and values of
Level 90% ,
A) (10.8,14.0)
B) (9.0,15.8)
C) (10.3,14.5)
D) (7.2,17.6)
for the given level and values of Level 90% ,
A) (10.8,14.0)
B) (9.0,15.8)
C) (10.3,14.5)
D) (7.2,17.6)
Unlock Deck
Unlock for access to all 33 flashcards in this deck.
Unlock Deck
k this deck
19
A computer software magazine compares the rates of malware infection for computers 28 out of 645 computers became infected after 1000 hours of internet interaction.
Assuming these to be random samples of infection rates for the two security software packages,
Construct a 95% confidence interval for the difference between the proportions of
Infection for the two types of security software packages.
A)(-0.028, 0.014)
B)(-0.025, 0.011)
C)(-0.027, 0.012)
D)(-0.029, 0.014)
Unlock Deck
Unlock for access to all 33 flashcards in this deck.
Unlock Deck
k this deck
20
The following MINITAB output display presents a 95% confidence interval for the difference
Unlock Deck
Unlock for access to all 33 flashcards in this deck.
Unlock Deck
k this deck
21
The following display from a TI-84 Plus calculator presents a 95% confidence interval for the
Unlock Deck
Unlock for access to all 33 flashcards in this deck.
Unlock Deck
k this deck
22
Two microprocessors are compared on a sample of 6 benchmark codes to determine whether
Unlock Deck
Unlock for access to all 33 flashcards in this deck.
Unlock Deck
k this deck
23
The following MINITAB output display presents a 95% confidence interval for the difference
Unlock Deck
Unlock for access to all 33 flashcards in this deck.
Unlock Deck
k this deck
24
The following display from a TI-84 Plus calculator presents a 95% confidence interval
Unlock Deck
Unlock for access to all 33 flashcards in this deck.
Unlock Deck
k this deck
25
The following output from MINITAB presents a confidence interval for the mean difference between matched pairs.
95 % CI for mean difference: (7.74239,9.78921)
Fill in the blanks: We are 95 % confident that the mean difference is between and
A) 6.5791,10.9525
B) 0,8.7658
C) 7.74239,9.78921
D) 0.488961,2.1867
95 % CI for mean difference: (7.74239,9.78921)
Fill in the blanks: We are 95 % confident that the mean difference is between and
A) 6.5791,10.9525
B) 0,8.7658
C) 7.74239,9.78921
D) 0.488961,2.1867
Unlock Deck
Unlock for access to all 33 flashcards in this deck.
Unlock Deck
k this deck
26
The following output from MINITAB presents a confidence interval for the mean differer between matched pairs.
95% CI for mean difference: (9.639447,12.773153)
What is the point estimate of
A) 11.2063
B) 17
C) 3.1508
D) 0.742651
95% CI for mean difference: (9.639447,12.773153)
What is the point estimate of
A) 11.2063
B) 17
C) 3.1508
D) 0.742651
Unlock Deck
Unlock for access to all 33 flashcards in this deck.
Unlock Deck
k this deck
27
A group of six individuals with high cholesterol levels were given a new diet designed to lower A dietician claims that the mean reduction in cholesterol level is 50 milligrams per deciliter.
Does the 99% confidence interval contradict this claim? (Hint: you need to find the 99%
Confidence interval for the mean reduction in cholesterol level.)
A)Yes
B)No
Does the 99% confidence interval contradict this claim? (Hint: you need to find the 99%
Confidence interval for the mean reduction in cholesterol level.)
A)Yes
B)No
Unlock Deck
Unlock for access to all 33 flashcards in this deck.
Unlock Deck
k this deck
28
The following output from MINITAB presents a confidence interval for the mean differer between matched pairs.
95% CI for mean difference: (4.672247,8.894353)
How many degrees of freedom are there?
A) 4.1059
B) 16
C) 0.995827
D) 17
95% CI for mean difference: (4.672247,8.894353)
How many degrees of freedom are there?
A) 4.1059
B) 16
C) 0.995827
D) 17
Unlock Deck
Unlock for access to all 33 flashcards in this deck.
Unlock Deck
k this deck
29
A group of six individuals with high blood pressure volunteered to test whether petting cats for 10 A researcher claims that the mean reduction in systolic blood pressure is 11 mmHg. Does the 98% confidence interval contradict this claim? (Hint: you need to find the 98%
Confidence interval for the mean reduction in systolic blood pressure.)
A)Yes
B)No
A researcher claims that the mean reduction in systolic blood pressure is 11 mmHg. Does the 98% confidence interval contradict this claim? (Hint: you need to find the 98%Confidence interval for the mean reduction in systolic blood pressure.)
A)Yes
B)No
Unlock Deck
Unlock for access to all 33 flashcards in this deck.
Unlock Deck
k this deck
30
The following display from a TI-84 Plus calculator presents a 95% confidence interval for the
Unlock Deck
Unlock for access to all 33 flashcards in this deck.
Unlock Deck
k this deck
31
A group of six individuals with high blood pressure volunteered to test whether petting cats for 10 Find the 98% confidence interval for the mean reduction in systolic blood pressure.
A)(0.05, 50.27)
B)(-3.90, 51.90)
C)(-2.27, -3.90)
D)(0.75, 47.25)
Find the 98% confidence interval for the mean reduction in systolic blood pressure.A)(0.05, 50.27)
B)(-3.90, 51.90)
C)(-2.27, -3.90)
D)(0.75, 47.25)
Unlock Deck
Unlock for access to all 33 flashcards in this deck.
Unlock Deck
k this deck
32
Two microprocessors are compared on a sample of 6 benchmark codes to determine whether
Unlock Deck
Unlock for access to all 33 flashcards in this deck.
Unlock Deck
k this deck
33
A group of six individuals with high cholesterol levels were given a new diet designed to lower Find the 95% confidence interval for the mean reduction in cholesterol level.
A)(12.87, 48.46)
B)(11.09, 9.85)
C)(11.98, 50.24)
D)(9.85, 51.49)
Find the 95% confidence interval for the mean reduction in cholesterol level.A)(12.87, 48.46)
B)(11.09, 9.85)
C)(11.98, 50.24)
D)(9.85, 51.49)
Unlock Deck
Unlock for access to all 33 flashcards in this deck.
Unlock Deck
k this deck
Unlock Deck
Unlock for access to all 33 flashcards in this deck.


