Deck 8: Hypothesis Testing
Full screen (f)
Question
Find the critical value or values of  based on the given information.

A) 14.848
B) 30.813
C) -30.813
D) 14.042
based on the given information.A) 14.848
B) 30.813
C) -30.813
D) 14.042
Question
Which of the following is not a requirement for testing a claim about a population proportion?
A)The sample observations are a simple random sample.
B)The conditions for a binomial distribution are satisfied.
C)
D)All of the other statements are requirements for testing a claim about a population proportion.
A)The sample observations are a simple random sample.
B)The conditions for a binomial distribution are satisfied.
C)
D)All of the other statements are requirements for testing a claim about a population proportion.
Question
Question
Find the critical value or values of  based on the given information.
A) 8.231
B) 31.526
C) 7.015
D) 8.907
based on the given information.A) 8.231
B) 31.526
C) 7.015
D) 8.907
Question
Question
A hypothesis test is performed to test the claim that a population proportion is greater than 0.7. Find the probability of a type II error,  , given that the true value of the population proportion
Is 0.72. The sample size is 50 and the significance level is 0.05.
A)0.4129
B)0.5754
C)0.7123
D)0.9706
, given that the true value of the population proportionIs 0.72. The sample size is 50 and the significance level is 0.05.
A)0.4129
B)0.5754
C)0.7123
D)0.9706
Question
Question
Use the given information to find the P -value. Also, use a 0.05 significance level and state the conclusion about the null hypothesis (reject the null hypothesis or fail to reject the null hypothesis). With  the test statistic is z=1.34 .
A) 0.9099 ; fail to reject the null hypothesis
B) 0.0901 ; reject the null hypothesis
C) 0.0901 ; fail to reject the null hypothesis
D) 0.1802 ; reject the null hypothesis
the test statistic is z=1.34 .A) 0.9099 ; fail to reject the null hypothesis
B) 0.0901 ; reject the null hypothesis
C) 0.0901 ; fail to reject the null hypothesis
D) 0.1802 ; reject the null hypothesis
Question
Question
Find the value of the test statistic z using  .
.
The claim is that the proportion of drowning deaths of children attributable to beaches is more than 0.25 , and the sample statistics include n=696 drowning deaths of children with 30 % of them attributable to beaches.
A) 3.05
B) -3.05
C) -2.88
D) 2.88
.The claim is that the proportion of drowning deaths of children attributable to beaches is more than 0.25 , and the sample statistics include n=696 drowning deaths of children with 30 % of them attributable to beaches.
A) 3.05
B) -3.05
C) -2.88
D) 2.88
Question
Question
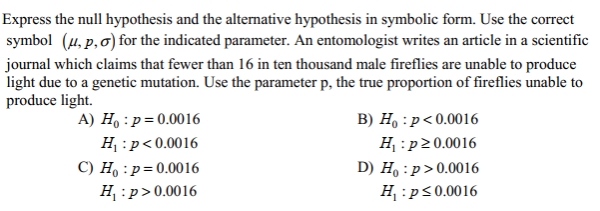
Express the null hypothesis and the alternative hypothesis in symbolic form. Use the correct symbol  for the indicated parameter. An entomologist writes an article in a scientific journal which claims that fewer than 16 in ten thousand male fireflies are unable to produce light due to a genetic mutation. Use the parameter p , the true proportion of fireflies unable to produce light.
A)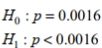
B)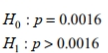
C)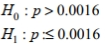
D)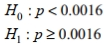
for the indicated parameter. An entomologist writes an article in a scientific journal which claims that fewer than 16 in ten thousand male fireflies are unable to produce light due to a genetic mutation. Use the parameter p , the true proportion of fireflies unable to produce light.A)
B)
C)
D)
Question
A formal hypothesis test is to be conducted using the claim that the mean body temperature is equal to  What is the null hypothesis and how is it denoted?
A)
B)
C)
D)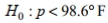
What is the null hypothesis and how is it denoted?A)
B)
C)
D)
Question
Formulate the indicated conclusion in nontechnical terms. Be sure to address the original claim. The principal of a middle school claims that test scores of the seventh-graders at his school
Vary less than the test scores of the seventh-graders at a neighboring school, which have
Variation described by = 14.7. Assuming that a hypothesis test of the claim has been
Conducted and that the conclusion is to reject the null hypothesis, state the conclusion in
Nontechnical terms.
A)There is sufficient evidence to support the claim that the standard deviation is greater than 14.7.
B)There is sufficient evidence to support the claim that the standard deviation is less than 14.7.
C)There is not sufficient evidence to support the claim that the standard deviation is greater than 14.7.
D)There is not sufficient evidence to support the claim that the standard deviation is less than 14.7.
Vary less than the test scores of the seventh-graders at a neighboring school, which have
Variation described by
= 14.7. Assuming that a hypothesis test of the claim has beenConducted and that the conclusion is to reject the null hypothesis, state the conclusion in
Nontechnical terms.
A)There is sufficient evidence to support the claim that the standard deviation is greater than 14.7.
B)There is sufficient evidence to support the claim that the standard deviation is less than 14.7.
C)There is not sufficient evidence to support the claim that the standard deviation is greater than 14.7.
D)There is not sufficient evidence to support the claim that the standard deviation is less than 14.7.
Question
Express the null hypothesis and the alternative hypothesis in symbolic form. Use the correct symbol  for the indicated parameter. A psychologist claims that more than 5.8 percent of the population suffers from professional problems due to extreme shyness. Use p , the true percentage of the population that suffers from extreme shyness.
A)
B)
C)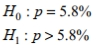
D)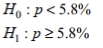
for the indicated parameter. A psychologist claims that more than 5.8 percent of the population suffers from professional problems due to extreme shyness. Use p , the true percentage of the population that suffers from extreme shyness.A)
B)
C)
D)
Question
Express the original claim in symbolic form. Claim: 20% of adults smoke 
Question
Question
Use the given information to find the P -value. Also, use a 0.05 significance level and state the conclusion about the null hypothesis (reject the null hypothesis or fail to reject the null hypothesis). With  the test statistic is z=0.78 .
A) 0.2177 ; reject the null hypothesis
B) 0.4354 ; reject the null hypothesis
C) 0.4354 ; fail to reject the null hypothesis
D) 0.2177 fail to reject the null hypothesis
the test statistic is z=0.78 .A) 0.2177 ; reject the null hypothesis
B) 0.4354 ; reject the null hypothesis
C) 0.4354 ; fail to reject the null hypothesis
D) 0.2177 fail to reject the null hypothesis
Question
Question
Solve the problem. For large numbers of degrees of freedom, the critical  values can be approximated as follows:
 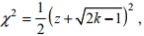 where \mathrm{k} is the number of degrees of freedom and z is the critical value. To find the lower critical value, the negative z -value is used, to find the upper critical value, the positive z -value is used. Use this approximation to estimate the critical value of
  in a two-tailed hypothesis test with n=104 and
A)
B)
C)
D)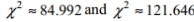
values can be approximated as follows: where \mathrm{k} is the number of degrees of freedom and z is the critical value. To find the lower critical value, the negative z -value is used, to find the upper critical value, the positive z -value is used. Use this approximation to estimate the critical value of in a two-tailed hypothesis test with n=104 and A)
B)
C)
D)
Question
Question
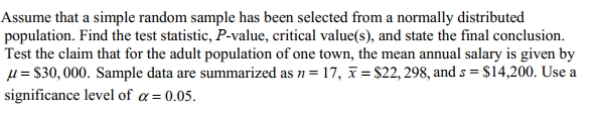
Assume that a simple random sample has been selected from a normally distributed population_
and test the given claim. Use either the traditional method or P-value method as indicated.
Identify the null and alternative hypotheses, test statistic, critical value(s)or P-value (or range
of P-values)as appropriate, and state the final conclusion that addresses the original claim.
A cereal company claims that the mean weight of the cereal in its packets is 14 oz. The
weights (in ounces)of the cereal in a random sample of 8 of its cereal packets are listed below. Test the claim at the 0.01 significance level.
and test the given claim. Use either the traditional method or P-value method as indicated.
Identify the null and alternative hypotheses, test statistic, critical value(s)or P-value (or range
of P-values)as appropriate, and state the final conclusion that addresses the original claim.
A cereal company claims that the mean weight of the cereal in its packets is 14 oz. The
weights (in ounces)of the cereal in a random sample of 8 of its cereal packets are listed below.
Test the claim at the 0.01 significance level. Question
Question
Find the critical value or values of  based on the given information.
A) 8.907
B) 8.231
C) 7.015
D) 31.526
based on the given information.A) 8.907
B) 8.231
C) 7.015
D) 31.526
Question
Use the given information to find the P -value. Also, use a 0.05 significance level and state the conclusion about the null hypothesis (reject the null hypothesis or fail to reject the null hypothesis). With  the test statistic is z=3.06 .
A) 0.0011 ; reject the null hypothesis
B) 0.0022 ; fail to reject the null hypothesis
C) 0.0022 ; reject the null hypothesis
D) 0.0011 ; fail to reject the null hypothesis
the test statistic is z=3.06 .A) 0.0011 ; reject the null hypothesis
B) 0.0022 ; fail to reject the null hypothesis
C) 0.0022 ; reject the null hypothesis
D) 0.0011 ; fail to reject the null hypothesis
Question
 pqn A claim is made that the proportion of children who play sports is less than 0.5, and the
Sample statistics include n = 1320 subjects with 30% saying that they play a sport.
A)14.53
B)29.66
C)−29.66
D)−14.53
Question
Solve the problem. A hypothesis test is performed to test the claim that a population proportion_ is greater than 0.7. Find the probability of a type II e
Rror, , given that the true value of the
Population proportion is 0.72. The sample size is 50 and the significance level is 0.05.
A)0.4129
B)0.7123
C)0.5754
D)0.9706
Rror,
, given that the true value of thePopulation proportion is 0.72. The sample size is 50 and the significance level is 0.05.
A)0.4129
B)0.7123
C)0.5754
D)0.9706
Question
Suppose we want to test the claim that less than  of Americans are in favor of raising the voting age to 21. Is the hypothesis test left-tailed, right-tailed, or two-tailed?
A)Left-tailed
B)Right-tailed
C)Two-tailed
of Americans are in favor of raising the voting age to 21. Is the hypothesis test left-tailed, right-tailed, or two-tailed?A)Left-tailed
B)Right-tailed
C)Two-tailed
Question
Solve the problem. For large numbers of degrees of freedom, the critical  values can be approximated as follows:
 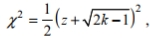 where k is the number of degrees of freedom and z is the critical value. To find the lower critical value, the negative z -value is used, to find the upper critical value, the positive z -value is used. Use this approximation to estimate the critical value of
  in a right-tailed hypothesis test with n=143 and
A)
B)
C)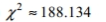
D)
values can be approximated as follows: where k is the number of degrees of freedom and z is the critical value. To find the lower critical value, the negative z -value is used, to find the upper critical value, the positive z -value is used. Use this approximation to estimate the critical value of in a right-tailed hypothesis test with n=143 and A)
B)
C)
D)
Question
Express the original claim in symbolic form.
Claim: 60 % of homes have smoke detectors.
A)
B) p=0.6
C)
D)
Claim: 60 % of homes have smoke detectors.
A)
B) p=0.6
C)
D)
Question
Question
Question
Express the null hypothesis and the alternative hypothesis in symbolic form. Use the correct symbol  for the indicated parameter. The manufacturer of a refrigerator system for beer kegs produces refrigerators that are supposed to maintain a true mean temperature,
  , of
, of  ideal for a certain type of German pilsner. The owner of the brewery does not agree with the refrigerator manufacturer, and claims he can prove that the true mean temperature is incorrect.
A)
B)
C)
D)
for the indicated parameter. The manufacturer of a refrigerator system for beer kegs produces refrigerators that are supposed to maintain a true mean temperature, , of ideal for a certain type of German pilsner. The owner of the brewery does not agree with the refrigerator manufacturer, and claims he can prove that the true mean temperature is incorrect.A)
B)
C)
D)
Question
Which of the following is a requirement for testing a claim about a population proportion?
A) The sample observations are a stratified sample.
B) The trials are dependent.
C) The conditions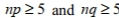 are both satisfied.
D) None of the other statements are requirements for testing a claim about a population proportion.
A) The sample observations are a stratified sample.
B) The trials are dependent.
C) The conditions
are both satisfied.D) None of the other statements are requirements for testing a claim about a population proportion.
Question
A formal hypothesis test is to be conducted using the claim that the mean AC thermostat setting in restaurants is equal to 74° F. What is the null hypothesis and how is it denoted? 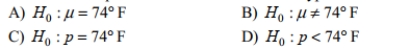
Question
Question
Question
 10
10 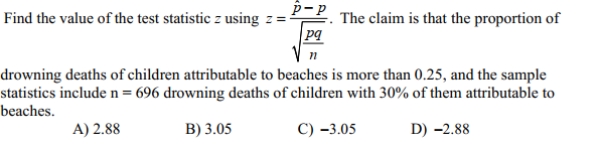 112
112 Question
Solve the problem. For large numbers of degrees of freedom, the critical  values can be approximated as follows:
 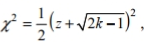 where k is the number of degrees of freedom and z is the critical value. To find the lower critical value, the negative z-value is used, to find the upper critical value, the positive z-value is used. Use this approximation to estimate the critical value of
  in a two-tailed hypothesis test with n=104 and
A)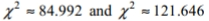
B)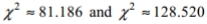
C)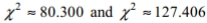
D)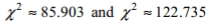
values can be approximated as follows: where k is the number of degrees of freedom and z is the critical value. To find the lower critical value, the negative z-value is used, to find the upper critical value, the positive z-value is used. Use this approximation to estimate the critical value of in a two-tailed hypothesis test with n=104 and A)
B)
C)
D)
Question
Question
Test the given claim. Use the P-value method or the traditional method as indicated.
the null hypothesis, alternative hypothesis, test statistic, critical value(s)or P-value,
conclusion about the null hypothesis, and final conclusion that addresses the original claim.
The mean resting pulse rate for men is 72 beats per minute. A simple random sample of
men who regularly work out at Mitch's Gym is obtained and their resting pulse rates (in beats
per minute)are listed below. Use a 0.05 significance level to test the claim that these sample
pulse rates come from a population with a mean less than 72 beats per minute. Assume that
the standard deviation of the resting pulse rates of all men who work out at Mitch's Gym is
known to be 6.6 beats per minute. Use the traditional method of testing hypotheses.
Question
Question
Question
Question
Question
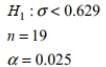
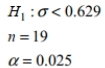
Use the traditional method to test the given hypothesis. Assume that the population is normally
distributed and that the sample has been randomly selected. For randomly selected adults, IQ
scores are normally distributed with a standard deviation of 15. The scores of 14 randomly
selected college students are listed below. Use a 0.10 significance level to test the claim that
the standard deviation of IQ scores of college students is less than 15. Round the sample
standard deviation to three decimal places.
Question
Provide an appropriate response. Complete the following table on hypothesis testing. 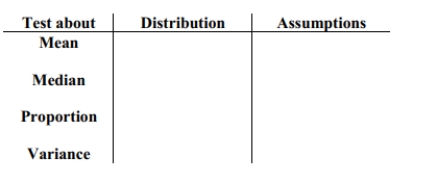
Question
Question
A watch manufacturer believes that 60% of men over age 50 wear watches.
manufacturer took a simple random sample of 275 men over age 50 and 170 of those men
wore watches. Test the watch manufacturer's claim at
manufacturer took a simple random sample of 275 men over age 50 and 170 of those men
wore watches. Test the watch manufacturer's claim at
Question
Question
Use the traditional method to test the given hypothesis. Assume that the population is normally_
distributed and that the sample has been randomly selected. Heights of men aged 25 to 34
have a standard deviation of 2.9. Use a 0.05 significance level to test the claim that the heights
of women aged 25 to 34 have a different standard deviation. The heights (in inches)of 16
randomly selected women aged 25 to 34 are listed below. Round the sample standard
deviation to five decimal places.
Question
Question
An oil change shop claims that they will change your oil in under 15 minutes. To test this
claim, a consumer advocacy group takes a simple random sample of 10 customers and records
the number of minutes it took to complete oil changes for these customers. Assume that oil
change times are normally distributed.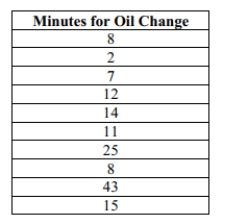 Conduct a hypothesis test for the oil shop's claim about oil change times at the 5% level of
significance.
claim, a consumer advocacy group takes a simple random sample of 10 customers and records
the number of minutes it took to complete oil changes for these customers. Assume that oil
change times are normally distributed.
Conduct a hypothesis test for the oil shop's claim about oil change times at the 5% level ofsignificance.
Question
Question
Question
Question

Unlock Deck
Sign up to unlock the cards in this deck!
Unlock Deck
Unlock Deck
1/57
Play
Full screen (f)
Deck 8: Hypothesis Testing
1
Find the critical value or values of based on the given information.
A) 14.848
B) 30.813
C) -30.813
D) 14.042
based on the given information.A) 14.848
B) 30.813
C) -30.813
D) 14.042
14.042
2
Which of the following is not a requirement for testing a claim about a population proportion?
A)The sample observations are a simple random sample.
B)The conditions for a binomial distribution are satisfied.
C)
D)All of the other statements are requirements for testing a claim about a population proportion.
A)The sample observations are a simple random sample.
B)The conditions for a binomial distribution are satisfied.
C)
D)All of the other statements are requirements for testing a claim about a population proportion.
C
3
Suppose we want to test the claim that the majority of adults are in favor of raising the voting age to 21. Is the hypothesis test left-tailed, right-tailed, or two-tailed?
A)Left-tailed
B)Right-tailed
C)Two-tailed
A)Left-tailed
B)Right-tailed
C)Two-tailed
B
4
Find the critical value or values of based on the given information.
A) 8.231
B) 31.526
C) 7.015
D) 8.907
based on the given information.A) 8.231
B) 31.526
C) 7.015
D) 8.907
Unlock Deck
Unlock for access to all 57 flashcards in this deck.
Unlock Deck
k this deck
5
Find the P-value in a test of the claim that the mean IQ score of acupuncturists is equal to 100, given that the test statistic is z =−2.00.
A)0.0228
B)0.955
C)0.977
D)0.0455
A)0.0228
B)0.955
C)0.977
D)0.0455
Unlock Deck
Unlock for access to all 57 flashcards in this deck.
Unlock Deck
k this deck
6
A hypothesis test is performed to test the claim that a population proportion is greater than 0.7. Find the probability of a type II error, , given that the true value of the population proportion
Is 0.72. The sample size is 50 and the significance level is 0.05.
A)0.4129
B)0.5754
C)0.7123
D)0.9706
, given that the true value of the population proportionIs 0.72. The sample size is 50 and the significance level is 0.05.
A)0.4129
B)0.5754
C)0.7123
D)0.9706
Unlock Deck
Unlock for access to all 57 flashcards in this deck.
Unlock Deck
k this deck
7
A Type I error is the mistake of ________________ when it is actually true.
A)failing to reject the null hypothesis
B)failing to reject the alternative hypothesis
C)rejecting the null hypothesis
D)rejecting the alternative hypothesis
A)failing to reject the null hypothesis
B)failing to reject the alternative hypothesis
C)rejecting the null hypothesis
D)rejecting the alternative hypothesis
Unlock Deck
Unlock for access to all 57 flashcards in this deck.
Unlock Deck
k this deck
8
Use the given information to find the P -value. Also, use a 0.05 significance level and state the conclusion about the null hypothesis (reject the null hypothesis or fail to reject the null hypothesis). With the test statistic is z=1.34 .
A) 0.9099 ; fail to reject the null hypothesis
B) 0.0901 ; reject the null hypothesis
C) 0.0901 ; fail to reject the null hypothesis
D) 0.1802 ; reject the null hypothesis
the test statistic is z=1.34 .A) 0.9099 ; fail to reject the null hypothesis
B) 0.0901 ; reject the null hypothesis
C) 0.0901 ; fail to reject the null hypothesis
D) 0.1802 ; reject the null hypothesis
Unlock Deck
Unlock for access to all 57 flashcards in this deck.
Unlock Deck
k this deck
9
The ________________ is the probability of getting a test statistic at least as extreme as the one representing the sample data, assuming that the null hypothesis is true.
A)P-value
B)sample proportion
C)critical value
D)level of significance
A)P-value
B)sample proportion
C)critical value
D)level of significance
Unlock Deck
Unlock for access to all 57 flashcards in this deck.
Unlock Deck
k this deck
10
Find the value of the test statistic z using .
The claim is that the proportion of drowning deaths of children attributable to beaches is more than 0.25 , and the sample statistics include n=696 drowning deaths of children with 30 % of them attributable to beaches.
A) 3.05
B) -3.05
C) -2.88
D) 2.88
.The claim is that the proportion of drowning deaths of children attributable to beaches is more than 0.25 , and the sample statistics include n=696 drowning deaths of children with 30 % of them attributable to beaches.
A) 3.05
B) -3.05
C) -2.88
D) 2.88
Unlock Deck
Unlock for access to all 57 flashcards in this deck.
Unlock Deck
k this deck
11
Formulate the indicated conclusion in nontechnical terms. Be sure to address the original claim. Carter Motor Company claims that its new sedan, the Libra, will average better than 32
Miles per gallon in the city. Assuming that a hypothesis test of the claim has been conducted
And that the conclusion is to reject the null hypothesis, state the conclusion in nontechnical
Terms.
A)There is sufficient evidence to support the claim that the mean is greater than 32 miles per gallon.
B)There is not sufficient evidence to support the claim that the mean is greater than 32 miles per gallon.
C)There is not sufficient evidence to support the claim that the mean is less than 32 miles per gallon.
D)There is sufficient evidence to support the claim that the mean is less than 32 miles per gallon.
Unlock Deck
Unlock for access to all 57 flashcards in this deck.
Unlock Deck
k this deck
12
Express the null hypothesis and the alternative hypothesis in symbolic form. Use the correct symbol for the indicated parameter. An entomologist writes an article in a scientific journal which claims that fewer than 16 in ten thousand male fireflies are unable to produce light due to a genetic mutation. Use the parameter p , the true proportion of fireflies unable to produce light.
A)
B)
C)
D)
for the indicated parameter. An entomologist writes an article in a scientific journal which claims that fewer than 16 in ten thousand male fireflies are unable to produce light due to a genetic mutation. Use the parameter p , the true proportion of fireflies unable to produce light.A)
B)
C)
D)
Unlock Deck
Unlock for access to all 57 flashcards in this deck.
Unlock Deck
k this deck
13
A formal hypothesis test is to be conducted using the claim that the mean body temperature is equal to What is the null hypothesis and how is it denoted?
A)
B)
C)
D)
What is the null hypothesis and how is it denoted?A)
B)
C)
D)
Unlock Deck
Unlock for access to all 57 flashcards in this deck.
Unlock Deck
k this deck
14
Formulate the indicated conclusion in nontechnical terms. Be sure to address the original claim. The principal of a middle school claims that test scores of the seventh-graders at his school
Vary less than the test scores of the seventh-graders at a neighboring school, which have
Variation described by = 14.7. Assuming that a hypothesis test of the claim has been
Conducted and that the conclusion is to reject the null hypothesis, state the conclusion in
Nontechnical terms.
A)There is sufficient evidence to support the claim that the standard deviation is greater than 14.7.
B)There is sufficient evidence to support the claim that the standard deviation is less than 14.7.
C)There is not sufficient evidence to support the claim that the standard deviation is greater than 14.7.
D)There is not sufficient evidence to support the claim that the standard deviation is less than 14.7.
Vary less than the test scores of the seventh-graders at a neighboring school, which have
Variation described by
= 14.7. Assuming that a hypothesis test of the claim has beenConducted and that the conclusion is to reject the null hypothesis, state the conclusion in
Nontechnical terms.
A)There is sufficient evidence to support the claim that the standard deviation is greater than 14.7.
B)There is sufficient evidence to support the claim that the standard deviation is less than 14.7.
C)There is not sufficient evidence to support the claim that the standard deviation is greater than 14.7.
D)There is not sufficient evidence to support the claim that the standard deviation is less than 14.7.
Unlock Deck
Unlock for access to all 57 flashcards in this deck.
Unlock Deck
k this deck
15
Express the null hypothesis and the alternative hypothesis in symbolic form. Use the correct symbol for the indicated parameter. A psychologist claims that more than 5.8 percent of the population suffers from professional problems due to extreme shyness. Use p , the true percentage of the population that suffers from extreme shyness.
A)
B)
C)
D)
for the indicated parameter. A psychologist claims that more than 5.8 percent of the population suffers from professional problems due to extreme shyness. Use p , the true percentage of the population that suffers from extreme shyness.A)
B)
C)
D)
Unlock Deck
Unlock for access to all 57 flashcards in this deck.
Unlock Deck
k this deck
16
Express the original claim in symbolic form. Claim: 20% of adults smoke
Unlock Deck
Unlock for access to all 57 flashcards in this deck.
Unlock Deck
k this deck
17
Use the given information to find the P-value. Also, use a 0.05 significance level and state the conclusion about the null hypothesis (reject the null hypothesis or fail to reject the null
Hypothesis). The test statistic in a right-tailed test is z = 0.52.
A)0.6030; fail to reject the null hypothesis
B)0.3015; reject the null hypothesis
C)0.0195; reject the null hypothesis
D)0.3015; fail to reject the null hypothesis
Hypothesis). The test statistic in a right-tailed test is z = 0.52.
A)0.6030; fail to reject the null hypothesis
B)0.3015; reject the null hypothesis
C)0.0195; reject the null hypothesis
D)0.3015; fail to reject the null hypothesis
Unlock Deck
Unlock for access to all 57 flashcards in this deck.
Unlock Deck
k this deck
18
Use the given information to find the P -value. Also, use a 0.05 significance level and state the conclusion about the null hypothesis (reject the null hypothesis or fail to reject the null hypothesis). With the test statistic is z=0.78 .
A) 0.2177 ; reject the null hypothesis
B) 0.4354 ; reject the null hypothesis
C) 0.4354 ; fail to reject the null hypothesis
D) 0.2177 fail to reject the null hypothesis
the test statistic is z=0.78 .A) 0.2177 ; reject the null hypothesis
B) 0.4354 ; reject the null hypothesis
C) 0.4354 ; fail to reject the null hypothesis
D) 0.2177 fail to reject the null hypothesis
Unlock Deck
Unlock for access to all 57 flashcards in this deck.
Unlock Deck
k this deck
19
A chi-square hypothesis test is going to be conducted about a population standard deviation. Select the statement that is not true about the Chi-square test
A)The sample must be a simple random sample.
B)The population does not have to be a normally distributed population.
C)The alternative hypothesis must contain < , >, or ?
D)The sample size must be known.
A)The sample must be a simple random sample.
B)The population does not have to be a normally distributed population.
C)The alternative hypothesis must contain < , >, or ?
D)The sample size must be known.
Unlock Deck
Unlock for access to all 57 flashcards in this deck.
Unlock Deck
k this deck
20
Solve the problem. For large numbers of degrees of freedom, the critical values can be approximated as follows: where \mathrm{k} is the number of degrees of freedom and z is the critical value. To find the lower critical value, the negative z -value is used, to find the upper critical value, the positive z -value is used. Use this approximation to estimate the critical value of in a two-tailed hypothesis test with n=104 and
A)
B)
C)
D)
values can be approximated as follows: where \mathrm{k} is the number of degrees of freedom and z is the critical value. To find the lower critical value, the negative z -value is used, to find the upper critical value, the positive z -value is used. Use this approximation to estimate the critical value of in a two-tailed hypothesis test with n=104 and A)
B)
C)
D)
Unlock Deck
Unlock for access to all 57 flashcards in this deck.
Unlock Deck
k this deck
21
Assume that a hypothesis test of the given claim will be conducted. Identify the type I or type II_ error for the test. A consumer advocacy group claims that the mean mileage for the Carter
Motor Company's new sedan is less than 32 miles per gallon. Identify the type I error for the
Test.
A)Reject the claim that the mean is equal to 32 miles per gallon when it is actually less than 32 miles per gallon.
B)Fail to reject the claim that the mean is equal to 32 miles per gallon when it is actually less than 32 miles per gallon.
C)Fail to reject the claim that the mean is equal to 32 miles per gallon when it is actually greater than 32 miles per gallon.
D)Reject the claim that the mean is equal to 32 miles per gallon when it is actually 32 miles per gallon.
Unlock Deck
Unlock for access to all 57 flashcards in this deck.
Unlock Deck
k this deck
22
Assume that a simple random sample has been selected from a normally distributed population_
and test the given claim. Use either the traditional method or P-value method as indicated.
Identify the null and alternative hypotheses, test statistic, critical value(s)or P-value (or range
of P-values)as appropriate, and state the final conclusion that addresses the original claim.
A cereal company claims that the mean weight of the cereal in its packets is 14 oz. The
weights (in ounces)of the cereal in a random sample of 8 of its cereal packets are listed below. Test the claim at the 0.01 significance level.
and test the given claim. Use either the traditional method or P-value method as indicated.
Identify the null and alternative hypotheses, test statistic, critical value(s)or P-value (or range
of P-values)as appropriate, and state the final conclusion that addresses the original claim.
A cereal company claims that the mean weight of the cereal in its packets is 14 oz. The
weights (in ounces)of the cereal in a random sample of 8 of its cereal packets are listed below.
Test the claim at the 0.01 significance level. Unlock Deck
Unlock for access to all 57 flashcards in this deck.
Unlock Deck
k this deck
23
Find the P-value in a test of the claim that the mean College Algebra final exam score of engineering majors equal to 88, given that the test statistic is z = 1.50.
A)0.0668
B)0.9331
C)0.1336
D)0.1500
A)0.0668
B)0.9331
C)0.1336
D)0.1500
Unlock Deck
Unlock for access to all 57 flashcards in this deck.
Unlock Deck
k this deck
24
Find the critical value or values of based on the given information.
A) 8.907
B) 8.231
C) 7.015
D) 31.526
based on the given information.A) 8.907
B) 8.231
C) 7.015
D) 31.526
Unlock Deck
Unlock for access to all 57 flashcards in this deck.
Unlock Deck
k this deck
25
Use the given information to find the P -value. Also, use a 0.05 significance level and state the conclusion about the null hypothesis (reject the null hypothesis or fail to reject the null hypothesis). With the test statistic is z=3.06 .
A) 0.0011 ; reject the null hypothesis
B) 0.0022 ; fail to reject the null hypothesis
C) 0.0022 ; reject the null hypothesis
D) 0.0011 ; fail to reject the null hypothesis
the test statistic is z=3.06 .A) 0.0011 ; reject the null hypothesis
B) 0.0022 ; fail to reject the null hypothesis
C) 0.0022 ; reject the null hypothesis
D) 0.0011 ; fail to reject the null hypothesis
Unlock Deck
Unlock for access to all 57 flashcards in this deck.
Unlock Deck
k this deck
26
pqn A claim is made that the proportion of children who play sports is less than 0.5, and theSample statistics include n = 1320 subjects with 30% saying that they play a sport.
A)14.53
B)29.66
C)−29.66
D)−14.53
Unlock Deck
Unlock for access to all 57 flashcards in this deck.
Unlock Deck
k this deck
27
Solve the problem. A hypothesis test is performed to test the claim that a population proportion_ is greater than 0.7. Find the probability of a type II e
Rror, , given that the true value of the
Population proportion is 0.72. The sample size is 50 and the significance level is 0.05.
A)0.4129
B)0.7123
C)0.5754
D)0.9706
Rror,
, given that the true value of thePopulation proportion is 0.72. The sample size is 50 and the significance level is 0.05.
A)0.4129
B)0.7123
C)0.5754
D)0.9706
Unlock Deck
Unlock for access to all 57 flashcards in this deck.
Unlock Deck
k this deck
28
Suppose we want to test the claim that less than of Americans are in favor of raising the voting age to 21. Is the hypothesis test left-tailed, right-tailed, or two-tailed?
A)Left-tailed
B)Right-tailed
C)Two-tailed
of Americans are in favor of raising the voting age to 21. Is the hypothesis test left-tailed, right-tailed, or two-tailed?A)Left-tailed
B)Right-tailed
C)Two-tailed
Unlock Deck
Unlock for access to all 57 flashcards in this deck.
Unlock Deck
k this deck
29
Solve the problem. For large numbers of degrees of freedom, the critical values can be approximated as follows: where k is the number of degrees of freedom and z is the critical value. To find the lower critical value, the negative z -value is used, to find the upper critical value, the positive z -value is used. Use this approximation to estimate the critical value of in a right-tailed hypothesis test with n=143 and
A)
B)
C)
D)
values can be approximated as follows: where k is the number of degrees of freedom and z is the critical value. To find the lower critical value, the negative z -value is used, to find the upper critical value, the positive z -value is used. Use this approximation to estimate the critical value of in a right-tailed hypothesis test with n=143 and A)
B)
C)
D)
Unlock Deck
Unlock for access to all 57 flashcards in this deck.
Unlock Deck
k this deck
30
Express the original claim in symbolic form.
Claim: 60 % of homes have smoke detectors.
A)
B) p=0.6
C)
D)
Claim: 60 % of homes have smoke detectors.
A)
B) p=0.6
C)
D)
Unlock Deck
Unlock for access to all 57 flashcards in this deck.
Unlock Deck
k this deck
31
A _____________ error is the mistake of rejecting the null hypothesis when it is actually true.
A)Type I
B)Type II
C)Type III
D)Type IV
A)Type I
B)Type II
C)Type III
D)Type IV
Unlock Deck
Unlock for access to all 57 flashcards in this deck.
Unlock Deck
k this deck
32
Identify the null hypothesis, alternative hypothesis, test statistic, P-value, conclusion about the_
null hypothesis, and final conclusion that addresses the original claim. The health of
employees is monitored by periodically weighing them in. A sample of 54 employees has a
mean weight of 183.9 lb. Assuming that σ is known to be 121.2 lb, use a 0.10 significance
level to test the claim that the population mean of all such employees weights is less than 200
lb.
Unlock Deck
Unlock for access to all 57 flashcards in this deck.
Unlock Deck
k this deck
33
Express the null hypothesis and the alternative hypothesis in symbolic form. Use the correct symbol for the indicated parameter. The manufacturer of a refrigerator system for beer kegs produces refrigerators that are supposed to maintain a true mean temperature, , of ideal for a certain type of German pilsner. The owner of the brewery does not agree with the refrigerator manufacturer, and claims he can prove that the true mean temperature is incorrect.
A)
B)
C)
D)
for the indicated parameter. The manufacturer of a refrigerator system for beer kegs produces refrigerators that are supposed to maintain a true mean temperature, , of ideal for a certain type of German pilsner. The owner of the brewery does not agree with the refrigerator manufacturer, and claims he can prove that the true mean temperature is incorrect.A)
B)
C)
D)
Unlock Deck
Unlock for access to all 57 flashcards in this deck.
Unlock Deck
k this deck
34
Which of the following is a requirement for testing a claim about a population proportion?
A) The sample observations are a stratified sample.
B) The trials are dependent.
C) The conditions are both satisfied.
D) None of the other statements are requirements for testing a claim about a population proportion.
A) The sample observations are a stratified sample.
B) The trials are dependent.
C) The conditions
are both satisfied.D) None of the other statements are requirements for testing a claim about a population proportion.
Unlock Deck
Unlock for access to all 57 flashcards in this deck.
Unlock Deck
k this deck
35
A formal hypothesis test is to be conducted using the claim that the mean AC thermostat setting in restaurants is equal to 74° F. What is the null hypothesis and how is it denoted?
Unlock Deck
Unlock for access to all 57 flashcards in this deck.
Unlock Deck
k this deck
36
Formulate the indicated conclusion in nontechnical terms. Be sure to address the original claim._ The owner of a football team claims that the average attendance at games is over 523, and he is
Therefore justified in moving the team to a city with a larger stadium. Assuming that a
Hypothesis test of the claim has been conducted and that the conclusion is failure to reject the
Null hypothesis, state the conclusion in nontechnical terms.
A)There is sufficient evidence to support the claim that the mean attendance is less than 523.
B)There is not sufficient evidence to support the claim that the mean attendance is less than 523.
C)There is sufficient evidence to support the claim that the mean attendance is greater than 523.
D)There is not sufficient evidence to support the claim that the mean attendance is greater than 523.
Unlock Deck
Unlock for access to all 57 flashcards in this deck.
Unlock Deck
k this deck
37
The p-value is the probability of getting a test statistic at least as extreme as the one representing the sample data, assuming that ______________________________.
A)the null hypothesis is true
B)the null hypothesis is false
C)the alternative hypothesis is true
D)the alternative hypothesis is false
A)the null hypothesis is true
B)the null hypothesis is false
C)the alternative hypothesis is true
D)the alternative hypothesis is false
Unlock Deck
Unlock for access to all 57 flashcards in this deck.
Unlock Deck
k this deck
38
10 112 Unlock Deck
Unlock for access to all 57 flashcards in this deck.
Unlock Deck
k this deck
39
Solve the problem. For large numbers of degrees of freedom, the critical values can be approximated as follows: where k is the number of degrees of freedom and z is the critical value. To find the lower critical value, the negative z-value is used, to find the upper critical value, the positive z-value is used. Use this approximation to estimate the critical value of in a two-tailed hypothesis test with n=104 and
A)
B)
C)
D)
values can be approximated as follows: where k is the number of degrees of freedom and z is the critical value. To find the lower critical value, the negative z-value is used, to find the upper critical value, the positive z-value is used. Use this approximation to estimate the critical value of in a two-tailed hypothesis test with n=104 and A)
B)
C)
D)
Unlock Deck
Unlock for access to all 57 flashcards in this deck.
Unlock Deck
k this deck
40
Formulate the indicated conclusion in nontechnical terms. Be sure to address the original claim._ Carter Motor Company claims that its new sedan, the Libra, will average better than 32 miles
Per gallon in the city. Assuming that a hypothesis test of the claim has been conducted and
That the conclusion is to reject the null hypothesis, state the conclusion in nontechnical terms.
A)There is not sufficient evidence to support the claim that the mean is greater than 32 miles per gallon.
B)There is not sufficient evidence to support the claim that the mean is less than 32 miles per gallon.
C)There is sufficient evidence to support the claim that the mean is less than 32 miles per gallon.
D)There is sufficient evidence to support the claim that the mean is greater than 32 miles per gallon.
Unlock Deck
Unlock for access to all 57 flashcards in this deck.
Unlock Deck
k this deck
41
Test the given claim. Use the P-value method or the traditional method as indicated.
the null hypothesis, alternative hypothesis, test statistic, critical value(s)or P-value,
conclusion about the null hypothesis, and final conclusion that addresses the original claim.
The mean resting pulse rate for men is 72 beats per minute. A simple random sample of
men who regularly work out at Mitch's Gym is obtained and their resting pulse rates (in beats
per minute)are listed below. Use a 0.05 significance level to test the claim that these sample
pulse rates come from a population with a mean less than 72 beats per minute. Assume that
the standard deviation of the resting pulse rates of all men who work out at Mitch's Gym is
known to be 6.6 beats per minute. Use the traditional method of testing hypotheses.
the null hypothesis, alternative hypothesis, test statistic, critical value(s)or P-value,
conclusion about the null hypothesis, and final conclusion that addresses the original claim.
The mean resting pulse rate for men is 72 beats per minute. A simple random sample of
men who regularly work out at Mitch's Gym is obtained and their resting pulse rates (in beats
per minute)are listed below. Use a 0.05 significance level to test the claim that these sample
pulse rates come from a population with a mean less than 72 beats per minute. Assume that
the standard deviation of the resting pulse rates of all men who work out at Mitch's Gym is
known to be 6.6 beats per minute. Use the traditional method of testing hypotheses.
Unlock Deck
Unlock for access to all 57 flashcards in this deck.
Unlock Deck
k this deck
42
Use the traditional method to test the given hypothesis. Assume that the population is normally_
distributed and that the sample has been randomly selected. A manufacturer uses a new
production method to produce steel rods. A random sample of 17 steel rods resulted in lengths
with a standard deviation of 4.7 cm. At the 0.10 significance level, test the claim that the new
production method has lengths with a standard deviation different from 3.5 cm, which was the
standard deviation for the old method.
Unlock Deck
Unlock for access to all 57 flashcards in this deck.
Unlock Deck
k this deck
43
Solve the problem. What do you conclude about the claim below? Do not use formal_
procedures or exact calculations. Use only the rare event rule and make a subjective estimate to
determine whether the event is likely.
Claim: A roulette wheel is fair and in 40 consecutive spins of the wheel, black shows up 23
times. (A roulette wheel has 38 equally likely slots of which 18 are black).
Unlock Deck
Unlock for access to all 57 flashcards in this deck.
Unlock Deck
k this deck
44
Sam wanted to test a claim about the mean of a population whose standard deviation was_
unknown. He picked a simple random sample of size 20 from the population. Lou wanted to
test a claim about a mean of a different population whose standard deviation was known. He
picked a simple random sample of size 22 from that population. George said that Sam would
need to determine whether his sample was from a normally distributed population because the
population standard deviation was unknown. He said that Lou would not need to do this since
for his test the population standard deviation was known. Is George right?
116
Unlock Deck
Unlock for access to all 57 flashcards in this deck.
Unlock Deck
k this deck
45
What do you conclude about the claim below? Do not use formal procedures or exact_
calculations. Use only the rare event rule and make a subjective estimate to determine whether
the event is likely.
Claim: A die is fair and in 100 rolls there are 63 sixes.
calculations. Use only the rare event rule and make a subjective estimate to determine whether
the event is likely.
Claim: A die is fair and in 100 rolls there are 63 sixes.
Unlock Deck
Unlock for access to all 57 flashcards in this deck.
Unlock Deck
k this deck
46
Use the traditional method to test the given hypothesis. Assume that the population is normally
distributed and that the sample has been randomly selected. For randomly selected adults, IQ
scores are normally distributed with a standard deviation of 15. The scores of 14 randomly
selected college students are listed below. Use a 0.10 significance level to test the claim that
the standard deviation of IQ scores of college students is less than 15. Round the sample
standard deviation to three decimal places.
distributed and that the sample has been randomly selected. For randomly selected adults, IQ
scores are normally distributed with a standard deviation of 15. The scores of 14 randomly
selected college students are listed below. Use a 0.10 significance level to test the claim that
the standard deviation of IQ scores of college students is less than 15. Round the sample
standard deviation to three decimal places.
Unlock Deck
Unlock for access to all 57 flashcards in this deck.
Unlock Deck
k this deck
47
Provide an appropriate response. Complete the following table on hypothesis testing.
Unlock Deck
Unlock for access to all 57 flashcards in this deck.
Unlock Deck
k this deck
48
A simple random sample of the running time of movies of 70 international movies resulted in
a sample mean length of 112 minutes and a sample standard deviation of 7 minutes. Test the
claim that international movies have a mean running time of more than 110 minutes at the 5%
level of significance. Assume that the lengths of movies are normally distributed.
a sample mean length of 112 minutes and a sample standard deviation of 7 minutes. Test the
claim that international movies have a mean running time of more than 110 minutes at the 5%
level of significance. Assume that the lengths of movies are normally distributed.
Unlock Deck
Unlock for access to all 57 flashcards in this deck.
Unlock Deck
k this deck
49
A watch manufacturer believes that 60% of men over age 50 wear watches.
manufacturer took a simple random sample of 275 men over age 50 and 170 of those men
wore watches. Test the watch manufacturer's claim at
manufacturer took a simple random sample of 275 men over age 50 and 170 of those men
wore watches. Test the watch manufacturer's claim at
Unlock Deck
Unlock for access to all 57 flashcards in this deck.
Unlock Deck
k this deck
50
Solve the problem. Use the P-value method to test the claim that the population standard
deviation of the systolic blood pressures of adults aged 40-50 is equal to 22 mmHg. The
sample statistics are as follows: nx==23, 132.2 mmHg, s = 26.6 mmHg. Be sure to state
the hypotheses, the value of this test statistic, the P-value, and your conclusion. Use a
significance level of 0.05.
deviation of the systolic blood pressures of adults aged 40-50 is equal to 22 mmHg. The
sample statistics are as follows: nx==23, 132.2 mmHg, s = 26.6 mmHg. Be sure to state
the hypotheses, the value of this test statistic, the P-value, and your conclusion. Use a
significance level of 0.05.
Unlock Deck
Unlock for access to all 57 flashcards in this deck.
Unlock Deck
k this deck
51
Use the traditional method to test the given hypothesis. Assume that the population is normally_
distributed and that the sample has been randomly selected. Heights of men aged 25 to 34
have a standard deviation of 2.9. Use a 0.05 significance level to test the claim that the heights
of women aged 25 to 34 have a different standard deviation. The heights (in inches)of 16
randomly selected women aged 25 to 34 are listed below. Round the sample standard
deviation to five decimal places.
Unlock Deck
Unlock for access to all 57 flashcards in this deck.
Unlock Deck
k this deck
52
Solve the problem. Suppose that you are conducting a study on the effectiveness of a new
teaching method and that you wish to use a hypothesis test to support your claim regarding
the mean test score under this method. What restrictions are there in the wording of the claim?
Will your claim become the null hypothesis or the alternative hypothesis, or does it depend on
the situation? Give an example of a claim which is incorrectly worded.
Unlock Deck
Unlock for access to all 57 flashcards in this deck.
Unlock Deck
k this deck
53
An oil change shop claims that they will change your oil in under 15 minutes. To test this
claim, a consumer advocacy group takes a simple random sample of 10 customers and records
the number of minutes it took to complete oil changes for these customers. Assume that oil
change times are normally distributed. Conduct a hypothesis test for the oil shop's claim about oil change times at the 5% level of
significance.
claim, a consumer advocacy group takes a simple random sample of 10 customers and records
the number of minutes it took to complete oil changes for these customers. Assume that oil
change times are normally distributed.
Conduct a hypothesis test for the oil shop's claim about oil change times at the 5% level ofsignificance.
Unlock Deck
Unlock for access to all 57 flashcards in this deck.
Unlock Deck
k this deck
54
Unlock Deck
Unlock for access to all 57 flashcards in this deck.
Unlock Deck
k this deck
55
Provide an appropriate response. Tim believes that a coin is coming up tails less than 50% of_
the time. He tests the claim p < 0.5. In 100 tosses, the coin comes up tails 57 times. What is the
value of the sample proportion? Do you think the P-value will be small or large and what
should Tim conclude about the claim p < 0.5?
the time. He tests the claim p < 0.5. In 100 tosses, the coin comes up tails 57 times. What is the
value of the sample proportion? Do you think the P-value will be small or large and what
should Tim conclude about the claim p < 0.5?
Unlock Deck
Unlock for access to all 57 flashcards in this deck.
Unlock Deck
k this deck
56
Assume that a simple random sample has been selected from a normally distributed population
and test the given claim. Use either the traditional method or P-value method as indicated.
Identify the null and alternative hypotheses, test statistic, critical value(s)or P-value (or range
of P-values)as appropriate, and state the final conclusion that addresses the original claim. A
public bus company official claims that the mean waiting time for bus number 14 during peak
hours is less than 10 minutes. Karen took bus number 14 during peak hours on 18 different
occasions. Her mean waiting time was 7.6 minutes with a standard deviation of 2.3 minutes.
At the 0.01 significance level, test the claim that the mean waiting time is less than 10
minutes. Use the P-value method of testing hypotheses.
Unlock Deck
Unlock for access to all 57 flashcards in this deck.
Unlock Deck
k this deck
57
Identify the null hypothesis, alternative hypothesis, test statistic, P -value, conclusion about
the null hypothesis, and final conclusion that addresses the original claim. An article in a
journal reports that 34% of American fathers take no responsibility for child care. A
researcher claims that the figure is higher for fathers in the town of Littleton. A random
sample of 234 fathers from Littleton yielded 96 who did not help with child care. Test the
researcher's claim at the 0.05 significance level.
Unlock Deck
Unlock for access to all 57 flashcards in this deck.
Unlock Deck
k this deck
Unlock Deck
Unlock for access to all 57 flashcards in this deck.


