Deck 2: Organizing and Summarizing Data
Full screen (f)
Question
Student Council President 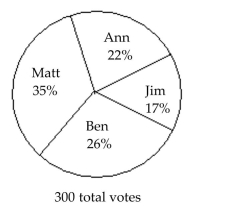 What percent of the votes did Jim and Ann receive together?
A) 39%
B) 61%
C) 17%
D) 22%
What percent of the votes did Jim and Ann receive together?A) 39%
B) 61%
C) 17%
D) 22%
Question
The Excel frequency bar graph below describes the employment status of a random sample of U.S. adults.What is the percentage of those having no job? 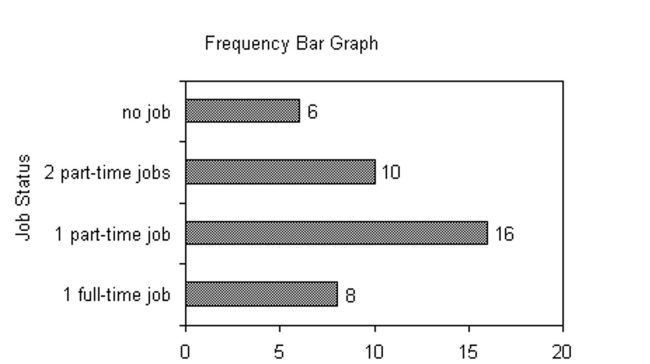
A) 15%
B) 20%
C) 40%
D) cannot determine
A) 15%
B) 20%
C) 40%
D) cannot determine
Question
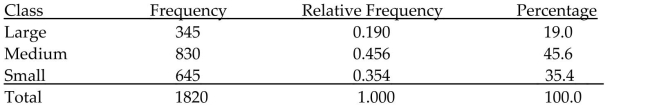
Scott Tarnowski owns a pet grooming shop. His prices for grooming dogs are based on the size of the dog. Hisrecords from last year are summarized below. Construct a frequency distribution and a relative frequencydistribution. Show the percentage represented by each relative frequency. 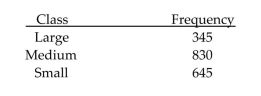
Question
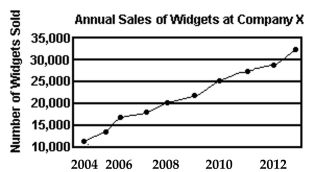
The bar graph below shows the political party affiliation of 1000 registered U.S. voters. What percentage of the1000 registered U.S. voters belonged to one of the traditional two parties (Democratic and Republican)? 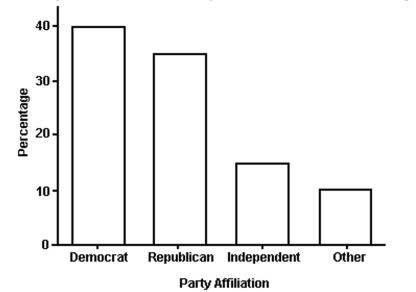
A) 75%
B) 40%
C) 35%
D) 25%
A) 75%
B) 40%
C) 35%
D) 25%
Question
The results of a survey about a recent judicial appointment are given in the table below. Construct a relativefrequency distribution. 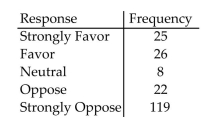
Question
The preschool children at Elmwood Elementary School were asked to name their favorite color. The results arelisted below. Construct a frequency distribution and a relative frequency distribution. 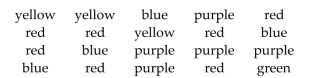
Question
Question
The grade point averages for 40 evening students are listed below. Construct a frequency bar graph and arelative frequency bar graph. 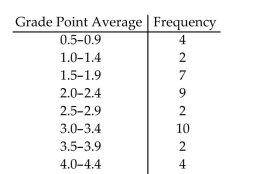
Question
The local police, using radar, checked the speeds (in mph) of 30 motorists in a construction area. The results arelisted below. Construct a frequency bar graph and a relative frequency bar graph. 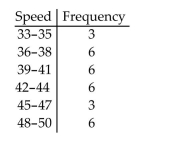
Question
Question
Question
Question
Question
Retailers are always interested in determining why a customer selected their store to make a purchase. Asporting goods retailer conducted a customer survey to determine why its customers shopped at the store. Theresults are shown below. What percentage of the customers responded that the merchandise was the reasonthey shopped at the store? Round to the nearest whole percent 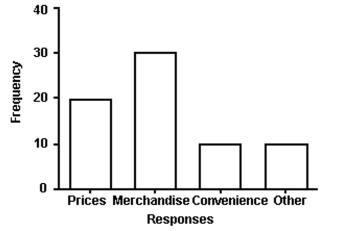
A) 43%
B) 30%
C) 50%
D) 29%
A) 43%
B) 30%
C) 50%
D) 29%
Question
Student Council President 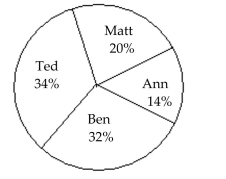 400 total votesWho got the fewest votes?
A) Ann
B) Ben
C) Matt
D) Ted
400 total votesWho got the fewest votes?A) Ann
B) Ben
C) Matt
D) Ted
Question
Question
The payroll amounts for 26 major-league baseball teams are shown below. Aprroximately what percentage ofthe payrolls were in the $30-$40 million range? Round to the nearest whole percent. 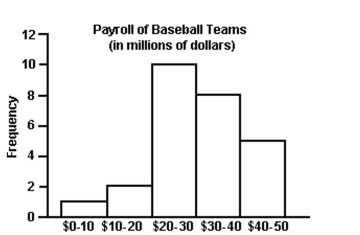
A) 31%
B) 8%
C) 42%
D) 19%
A) 31%
B) 8%
C) 42%
D) 19%
Question
Question
Student Council President 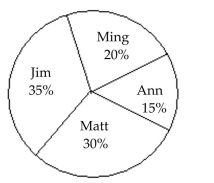 700 total votesWho got the most votes?
A) Jim
B) Matt
C) Ming
D) Ann
700 total votesWho got the most votes?A) Jim
B) Matt
C) Ming
D) Ann
Question
Question
A random sample of 30 high school students is selected. Each student is asked how much time he or she spenton the Internet during the previous week. The following times (in hours) are recorded: 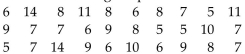 Construct a frequency histogram for this data.
Construct a frequency histogram for this data. Question
Question
The June precipitation amounts (in inches) for 40 cites are listed below. Construct a frequency distribution anda relative frequency distribution using eight classes. 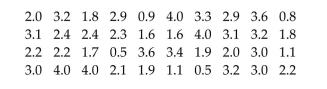
Question
A sample of 25 community service projects is obtained and the scores are recorded. The results are shownbelow. Construct a frequency histogram for this data. 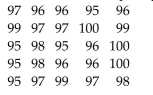 3 Organize continuous data in tables.
3 Organize continuous data in tables. Question
Scott Tarnowski owns a pet grooming shop. His prices for grooming dogs are based on the size of the dog. Hisrecords from last year are summarized below. Round percents to whole numbers. 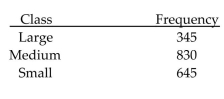
Question
Question
The March utility bills (in dollars) of 30 homeowners are listed below. Construct a frequency distribution and arelative frequency distribution using six classes. 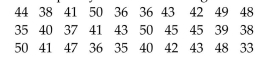 Provide an appropriate response.
Provide an appropriate response. Question
A study was conducted to determine how people get jobs. Four hundred subjects were randomly selected andthe results are listed below. Round percents to whole numbers. 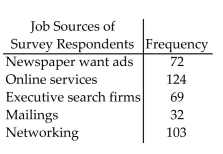
Question
A random sample of 30 high school students is selected. Each student is asked how much time he or she spenton the Internet during the previous week. The following times (in hours) are obtained: 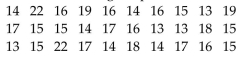 Construct a frequency distribution for the data.
Construct a frequency distribution for the data. Question
Use the following frequency distribution to determine the class limits of the third class. 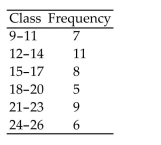
A) lower limit: 15; upper limit: 17
B) lower limit: 14.5; upper limit: 17.5
C) lower limit: 15; upper limit: 18
D) lower limit: 14; upper limit: 18
A) lower limit: 15; upper limit: 17
B) lower limit: 14.5; upper limit: 17.5
C) lower limit: 15; upper limit: 18
D) lower limit: 14; upper limit: 18
Question
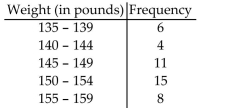
The weights (in pounds) of babies born at St Maryʹs hospital last month are summarized in the table. 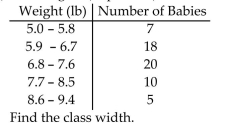
A) 0.9 lb
B) 0.8 lb
C) 0.95 lb
D) 0.85 lb
A) 0.9 lb
B) 0.8 lb
C) 0.95 lb
D) 0.85 lb
Question
Question
Question
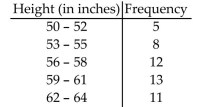
The weights (in pounds) of babies born at St Maryʹs hospital last month are summarized in the table. 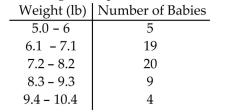 Find the class limits for the second class.
A) lower limit: 6.1; upper limit: 7.1
B) lower limit: 6.1; upper limit: 7.2
C) lower limit: 6.05; upper limit:7.15
D) lower limit: 6; upper limit: 7.2
Find the class limits for the second class.A) lower limit: 6.1; upper limit: 7.1
B) lower limit: 6.1; upper limit: 7.2
C) lower limit: 6.05; upper limit:7.15
D) lower limit: 6; upper limit: 7.2
Question
The commute times (in minutes) of 30 executives are listed below. Construct a frequency distribution and arelative frequency distribution using five classes. Round relative frequency values to three decimal places. 
Question
A researcher records the number of employees of each of the IT companies in the town of Westmoore. Theresults are summarized in the table. 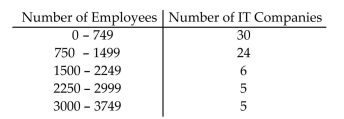 Find the class width.
A) 750
B) 3749
C) 749.5
D) 5
Find the class width.A) 750
B) 3749
C) 749.5
D) 5
Question
The table below summarizes the weights of the almonds (in grams) in a one-pound bag. What is the classwidth? 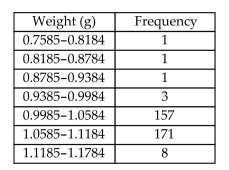
A) 0.06
B) 0.059
C) 0.408
D) 0.4
A) 0.06
B) 0.059
C) 0.408
D) 0.4
Question
A researcher records the number of employees of each of the IT companies in the town of Westmoore. Theresults are summarized in the table. 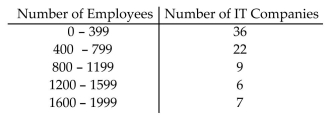 Find the class limits of the third class.
A) lower limit: 800; upper limit: 1199
B) lower limit: 800; upper limit: 1200
C) lower limit: 799.5; upper limit: 1199.5
D) lower limit: 799; upper limit: 1200
Find the class limits of the third class.A) lower limit: 800; upper limit: 1199
B) lower limit: 800; upper limit: 1200
C) lower limit: 799.5; upper limit: 1199.5
D) lower limit: 799; upper limit: 1200
Question
For the data below, construct a frequency distribution and a relative frequency distribution. 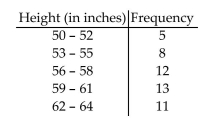
Question
A sample of 25 service project scores is taken and is recorded below. Construct a frequency distribution for thisdata.  2 Construct histograms of discrete data.
2 Construct histograms of discrete data. Question
Question
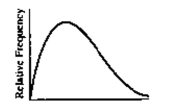
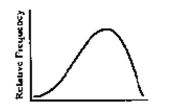
A) skewed to the right
B) skewed to the left
C) uniform
D) bell shaped
Question
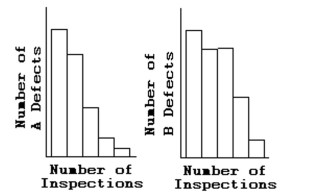 Is either histogram symmetric?
A) Neither is symmetric.
B) The first is symmetric, but the second is not symmetric.
C) The second is symmetric, but the first is not symmetric.
D) Both are symmetric.
Question
The heights (in inches) of 30 mechanics are listed below. Construct a stem-and-leaf plot for the data. 
Question
For the data below, construct a frequency histogram and a relative frequency histogram. 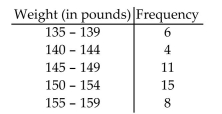
Question
The local police, using radar, checked the speeds (in mph) of 30 motorists at a busy intersection. The results arelisted below. Construct a dot plot for the data. 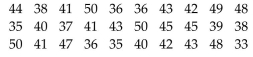
Question
The data set: weekly grocery bills (in dollars) for 20 randomly selected households 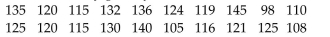
A) bell shaped
B) uniform
C) skewed to the left
D) skewed to the right
A) bell shaped
B) uniform
C) skewed to the left
D) skewed to the right
Question
For the stem-and-leaf plot below, what are the maximum and minimum entries? 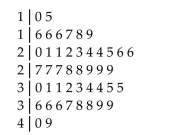
A) max: 49; min: 10
B) max: 38; min: 7
C) max: 47; min: 15
D) max: 40; min: 10
A) max: 49; min: 10
B) max: 38; min: 7
C) max: 47; min: 15
D) max: 40; min: 10
Question
The 30 students in Mrs Harrisonʹs literature class were asked how many cousins they had. The results areshown below. Create a frequency histogram for the data using a class width of 2. 
Question
A sample of 15 Girl Scouts was selected and their weights (in pounds) were recorded. The results are listedbelow. Construct a frequency histogram for the data using a class width of 10 and using 95 as the lower limitof the first class. 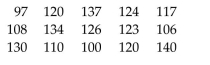
Question
The number of home runs that Mark McGwire hit in the first 13 years of his major league baseball career arelisted below. (Source: Major League Handbook) Construct a stem-and-leaf plot for this data. 
Question
A) skewed to the left
B) skewed to the right
C) uniform
D) bell shaped
Question
The numbers of runs batted in by Mark McLemore in the first 13 years of his major league baseball career arelisted below. (Source: Major League Handbook) Construct a stem-and-leaf plot for this data. 
Question
The 30 students in Mrs Harrisonʹs literature class were asked how many cousins they had. The results areshown below. Construct a relative-frequency histogram using a class width of 2. 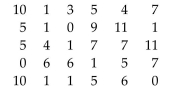
Question
Question
The scores for an economics test are listed below. Create a stem-and-leaf plot for the data. 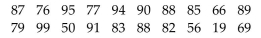 6 Draw dot plots.
6 Draw dot plots. Question
The data set: ages of dishwashers (in years) in 20 randomly selected households 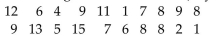
A) bell shaped
B) uniform
C) skewed to the left
D) skewed to the right
A) bell shaped
B) uniform
C) skewed to the left
D) skewed to the right
Question
The heights (in inches) of 30 mechanics are listed below. Construct a dot plot for the data. 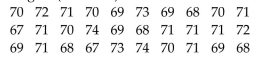 7 Identify the shape of a distribution.
7 Identify the shape of a distribution. Question
The data set: Pick Three Lottery Outcomes for 10 Consecutive Weeks 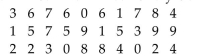
A) uniform
B) bell shaped
C) skewed to the left
D) skewed to the right
A) uniform
B) bell shaped
C) skewed to the left
D) skewed to the right
Question
The March utility bills (in dollars) of 30 homeowners are listed below. Construct a stem-and-leaf plot for thedata. 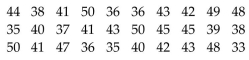
Question
The grade point averages for 40 evening students are listed below. Construct a frequency polygon using eightclasses. 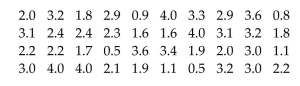
Question
Question
Women were allowed to enter the Boston Marathon for the first time in 1972. Listed below are the winningwomenʹs times (in minutes) for the first 10 years.  2.4 Graphical Misrepresentations of Data1 Describe what can make a graph misleading or deceptive.
2.4 Graphical Misrepresentations of Data1 Describe what can make a graph misleading or deceptive. Question
The local police, using radar, checked the speeds (in mph) of 30 motorists on a rural road. The results are listedbelow. Construct a relative frequency ogive using six classes. 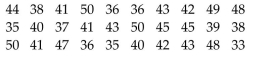
Question
A transportation engineer wishes to use the following data to illustrate the number of deaths from the collisionof passenger cars with motorcycles on a particular highway. 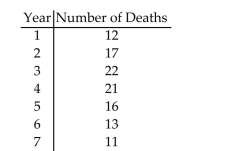
Question
The grade point averages for 40 evening students are listed below. Construct a frequency ogive usingeight classes. 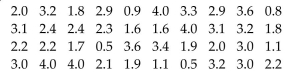
Question
Question
Question
The local police, using radar, checked the speeds (in mph) of 30 motorists in a construction area. The results arelisted below. Construct a frequency polygon using six classes and a class width of 3. 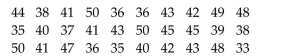
Question
The heights (in inches) of 30 lawyers are listed below. Construct a frequency ogive using five classes. 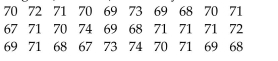
Question
The commute time (in minutes) of 30 executives are listed below. Construct a frequency distribution, a relativefrequency distribution, a cumulative frequency distribution, and a relative cumulative frequency distributionusing five classes. 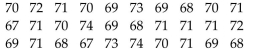
Question
A) The vertical scale does not begin at zero.
B) The horizontal label is incomplete.
C) The trend is depicted in the wrong direction.
D) The graphic is not misleading.
Question
The grade point averages for 40 evening students are listed below. Construct a relative frequency ogive usingeight classes. 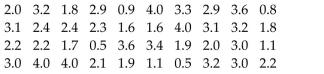
Question
The local police, using radar, checked the speeds (in mph) of 30 motorists on a rural road. The results are listedbelow. Construct a frequency ogive using six classes. 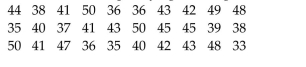
Question
The heights (in inches) of 30 lawyers are listed below. Construct a relative frequency ogive using five classes. 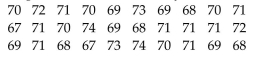
Question
The data below represent the consumption of high-energy drinks (in gallons) by adult Americans over anine-year period. 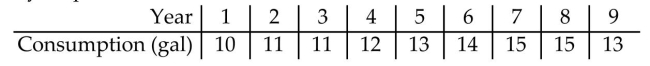
Question
The April precipitation amounts (in inches) for 40 cities are listed below. Construct a frequency distribution, arelative frequency distribution, a cumulative frequency distribution, and a relative cumulative frequencydistribution using eight classes. 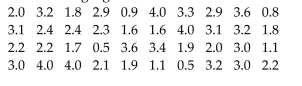
Question
Question
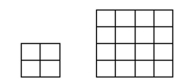 The volume of our sales has doubled!!!
A) The length of a side has doubled, but the area has been multiplied by 4.
B) The length of a side has doubled, but the area has been multiplied by 8.
C) The length of a side has doubled, but the area has been unchanged.
D) The graphic is not misleading.
Question
The local police, using radar, checked the speeds (in mph) of 30 motorists in a construction area. The results arelisted below. Construct a frequency distribution, a relative frequency distribution, a cumulative frequencydistribution, and a relative cumulative frequency distribution using six classes. 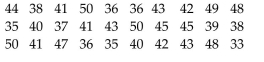 3 Construct frequency and relative frequency ogives.
3 Construct frequency and relative frequency ogives.
Unlock Deck
Sign up to unlock the cards in this deck!
Unlock Deck
Unlock Deck
1/82
Play
Full screen (f)
Deck 2: Organizing and Summarizing Data
1
Student Council President What percent of the votes did Jim and Ann receive together?
A) 39%
B) 61%
C) 17%
D) 22%
What percent of the votes did Jim and Ann receive together?A) 39%
B) 61%
C) 17%
D) 22%
A
2
The Excel frequency bar graph below describes the employment status of a random sample of U.S. adults.What is the percentage of those having no job?
A) 15%
B) 20%
C) 40%
D) cannot determine
A) 15%
B) 20%
C) 40%
D) cannot determine
A
3
Scott Tarnowski owns a pet grooming shop. His prices for grooming dogs are based on the size of the dog. Hisrecords from last year are summarized below. Construct a frequency distribution and a relative frequencydistribution. Show the percentage represented by each relative frequency.
4
The bar graph below shows the political party affiliation of 1000 registered U.S. voters. What percentage of the1000 registered U.S. voters belonged to one of the traditional two parties (Democratic and Republican)?
A) 75%
B) 40%
C) 35%
D) 25%
A) 75%
B) 40%
C) 35%
D) 25%
Unlock Deck
Unlock for access to all 82 flashcards in this deck.
Unlock Deck
k this deck
5
The results of a survey about a recent judicial appointment are given in the table below. Construct a relativefrequency distribution.
Unlock Deck
Unlock for access to all 82 flashcards in this deck.
Unlock Deck
k this deck
6
The preschool children at Elmwood Elementary School were asked to name their favorite color. The results arelisted below. Construct a frequency distribution and a relative frequency distribution.
Unlock Deck
Unlock for access to all 82 flashcards in this deck.
Unlock Deck
k this deck
7
During which week was the fewest number of tickets sold?
A) week 2
B) week 4
C) week 6
D) week 5
A) week 2
B) week 4
C) week 6
D) week 5
Unlock Deck
Unlock for access to all 82 flashcards in this deck.
Unlock Deck
k this deck
8
The grade point averages for 40 evening students are listed below. Construct a frequency bar graph and arelative frequency bar graph.
Unlock Deck
Unlock for access to all 82 flashcards in this deck.
Unlock Deck
k this deck
9
The local police, using radar, checked the speeds (in mph) of 30 motorists in a construction area. The results arelisted below. Construct a frequency bar graph and a relative frequency bar graph.
Unlock Deck
Unlock for access to all 82 flashcards in this deck.
Unlock Deck
k this deck
10
True or False: Relative frequency is the proportion (or percent) of observations within a category and is foundusing the formula: relative frequency =
Unlock Deck
Unlock for access to all 82 flashcards in this deck.
Unlock Deck
k this deck
11
Approximately how many tickets were sold during week 5?
A) 40 tickets
B) 19 tickets
C) 46 tickets
D) 11 tickets
A) 40 tickets
B) 19 tickets
C) 46 tickets
D) 11 tickets
Unlock Deck
Unlock for access to all 82 flashcards in this deck.
Unlock Deck
k this deck
12
In what quarter was the revenue the greatest for Year 2?
A) fourth quarter
B) first quarter
C) second quarter
D) third quarter
A) fourth quarter
B) first quarter
C) second quarter
D) third quarter
Unlock Deck
Unlock for access to all 82 flashcards in this deck.
Unlock Deck
k this deck
13
In what quarter was the revenue the least for Year 2?
A) second quarter
B) first quarter
C) fourth quarter
D) third quarter
A) second quarter
B) first quarter
C) fourth quarter
D) third quarter
Unlock Deck
Unlock for access to all 82 flashcards in this deck.
Unlock Deck
k this deck
14
Retailers are always interested in determining why a customer selected their store to make a purchase. Asporting goods retailer conducted a customer survey to determine why its customers shopped at the store. Theresults are shown below. What percentage of the customers responded that the merchandise was the reasonthey shopped at the store? Round to the nearest whole percent
A) 43%
B) 30%
C) 50%
D) 29%
A) 43%
B) 30%
C) 50%
D) 29%
Unlock Deck
Unlock for access to all 82 flashcards in this deck.
Unlock Deck
k this deck
15
Student Council President 400 total votesWho got the fewest votes?
A) Ann
B) Ben
C) Matt
D) Ted
400 total votesWho got the fewest votes?A) Ann
B) Ben
C) Matt
D) Ted
Unlock Deck
Unlock for access to all 82 flashcards in this deck.
Unlock Deck
k this deck
16
True or False: The sum of all the relative frequencies of a distribution will always add up to 1.
Unlock Deck
Unlock for access to all 82 flashcards in this deck.
Unlock Deck
k this deck
17
The payroll amounts for 26 major-league baseball teams are shown below. Aprroximately what percentage ofthe payrolls were in the $30-$40 million range? Round to the nearest whole percent.
A) 31%
B) 8%
C) 42%
D) 19%
A) 31%
B) 8%
C) 42%
D) 19%
Unlock Deck
Unlock for access to all 82 flashcards in this deck.
Unlock Deck
k this deck
18
During which week was the most number of tickets sold?
A) week 4
B) week 5
C) week 2
D) week 1
A) week 4
B) week 5
C) week 2
D) week 1
Unlock Deck
Unlock for access to all 82 flashcards in this deck.
Unlock Deck
k this deck
19
Student Council President 700 total votesWho got the most votes?
A) Jim
B) Matt
C) Ming
D) Ann
700 total votesWho got the most votes?A) Jim
B) Matt
C) Ming
D) Ann
Unlock Deck
Unlock for access to all 82 flashcards in this deck.
Unlock Deck
k this deck
20
What was the revenue for the first quarter of Year 1?
A) $35 million
B) $7 million
C) $20 million
D) $4 million
A) $35 million
B) $7 million
C) $20 million
D) $4 million
Unlock Deck
Unlock for access to all 82 flashcards in this deck.
Unlock Deck
k this deck
21
A random sample of 30 high school students is selected. Each student is asked how much time he or she spenton the Internet during the previous week. The following times (in hours) are recorded: Construct a frequency histogram for this data.
Construct a frequency histogram for this data. Unlock Deck
Unlock for access to all 82 flashcards in this deck.
Unlock Deck
k this deck
22
Find the class width for the frequency table below.
A) 2
B) 1
C) 1.5
D) 2.5
A) 2
B) 1
C) 1.5
D) 2.5
Unlock Deck
Unlock for access to all 82 flashcards in this deck.
Unlock Deck
k this deck
23
The June precipitation amounts (in inches) for 40 cites are listed below. Construct a frequency distribution anda relative frequency distribution using eight classes.
Unlock Deck
Unlock for access to all 82 flashcards in this deck.
Unlock Deck
k this deck
24
A sample of 25 community service projects is obtained and the scores are recorded. The results are shownbelow. Construct a frequency histogram for this data. 3 Organize continuous data in tables.
3 Organize continuous data in tables. Unlock Deck
Unlock for access to all 82 flashcards in this deck.
Unlock Deck
k this deck
25
Scott Tarnowski owns a pet grooming shop. His prices for grooming dogs are based on the size of the dog. Hisrecords from last year are summarized below. Round percents to whole numbers.
Unlock Deck
Unlock for access to all 82 flashcards in this deck.
Unlock Deck
k this deck
26
The class width is the difference between
A) Two successive lower class limits
B) The high and the low data values
C) The upper class limit and the lower class limit of a class
D) The largest frequency and the smallest frequency
A) Two successive lower class limits
B) The high and the low data values
C) The upper class limit and the lower class limit of a class
D) The largest frequency and the smallest frequency
Unlock Deck
Unlock for access to all 82 flashcards in this deck.
Unlock Deck
k this deck
27
The March utility bills (in dollars) of 30 homeowners are listed below. Construct a frequency distribution and arelative frequency distribution using six classes. Provide an appropriate response.
Provide an appropriate response. Unlock Deck
Unlock for access to all 82 flashcards in this deck.
Unlock Deck
k this deck
28
A study was conducted to determine how people get jobs. Four hundred subjects were randomly selected andthe results are listed below. Round percents to whole numbers.
Unlock Deck
Unlock for access to all 82 flashcards in this deck.
Unlock Deck
k this deck
29
A random sample of 30 high school students is selected. Each student is asked how much time he or she spenton the Internet during the previous week. The following times (in hours) are obtained: Construct a frequency distribution for the data.
Construct a frequency distribution for the data. Unlock Deck
Unlock for access to all 82 flashcards in this deck.
Unlock Deck
k this deck
30
Use the following frequency distribution to determine the class limits of the third class.
A) lower limit: 15; upper limit: 17
B) lower limit: 14.5; upper limit: 17.5
C) lower limit: 15; upper limit: 18
D) lower limit: 14; upper limit: 18
A) lower limit: 15; upper limit: 17
B) lower limit: 14.5; upper limit: 17.5
C) lower limit: 15; upper limit: 18
D) lower limit: 14; upper limit: 18
Unlock Deck
Unlock for access to all 82 flashcards in this deck.
Unlock Deck
k this deck
31
The weights (in pounds) of babies born at St Maryʹs hospital last month are summarized in the table.
A) 0.9 lb
B) 0.8 lb
C) 0.95 lb
D) 0.85 lb
A) 0.9 lb
B) 0.8 lb
C) 0.95 lb
D) 0.85 lb
Unlock Deck
Unlock for access to all 82 flashcards in this deck.
Unlock Deck
k this deck
32
A two-pound bag of assorted candy contained 100 caramels, 83 mint patties, 93 chocolate squares, 80 nutclusters, and 79 peanut butter taffy pieces. To create a pie chart of this data, the angle for the slice representingeach candy type must be computed. What is the degree measure of the slice representing the mint pattiesrounded to the nearest degree?
A) 69°
B) 19°
C) 5°
D) 52°
A) 69°
B) 19°
C) 5°
D) 52°
Unlock Deck
Unlock for access to all 82 flashcards in this deck.
Unlock Deck
k this deck
33
Determine the number of classes in the frequency table below.
A) 5
B) 6
C) 20
D) 2
A) 5
B) 6
C) 20
D) 2
Unlock Deck
Unlock for access to all 82 flashcards in this deck.
Unlock Deck
k this deck
34
The weights (in pounds) of babies born at St Maryʹs hospital last month are summarized in the table. Find the class limits for the second class.
A) lower limit: 6.1; upper limit: 7.1
B) lower limit: 6.1; upper limit: 7.2
C) lower limit: 6.05; upper limit:7.15
D) lower limit: 6; upper limit: 7.2
Find the class limits for the second class.A) lower limit: 6.1; upper limit: 7.1
B) lower limit: 6.1; upper limit: 7.2
C) lower limit: 6.05; upper limit:7.15
D) lower limit: 6; upper limit: 7.2
Unlock Deck
Unlock for access to all 82 flashcards in this deck.
Unlock Deck
k this deck
35
The commute times (in minutes) of 30 executives are listed below. Construct a frequency distribution and arelative frequency distribution using five classes. Round relative frequency values to three decimal places.
Unlock Deck
Unlock for access to all 82 flashcards in this deck.
Unlock Deck
k this deck
36
A researcher records the number of employees of each of the IT companies in the town of Westmoore. Theresults are summarized in the table. Find the class width.
A) 750
B) 3749
C) 749.5
D) 5
Find the class width.A) 750
B) 3749
C) 749.5
D) 5
Unlock Deck
Unlock for access to all 82 flashcards in this deck.
Unlock Deck
k this deck
37
The table below summarizes the weights of the almonds (in grams) in a one-pound bag. What is the classwidth?
A) 0.06
B) 0.059
C) 0.408
D) 0.4
A) 0.06
B) 0.059
C) 0.408
D) 0.4
Unlock Deck
Unlock for access to all 82 flashcards in this deck.
Unlock Deck
k this deck
38
A researcher records the number of employees of each of the IT companies in the town of Westmoore. Theresults are summarized in the table. Find the class limits of the third class.
A) lower limit: 800; upper limit: 1199
B) lower limit: 800; upper limit: 1200
C) lower limit: 799.5; upper limit: 1199.5
D) lower limit: 799; upper limit: 1200
Find the class limits of the third class.A) lower limit: 800; upper limit: 1199
B) lower limit: 800; upper limit: 1200
C) lower limit: 799.5; upper limit: 1199.5
D) lower limit: 799; upper limit: 1200
Unlock Deck
Unlock for access to all 82 flashcards in this deck.
Unlock Deck
k this deck
39
For the data below, construct a frequency distribution and a relative frequency distribution.
Unlock Deck
Unlock for access to all 82 flashcards in this deck.
Unlock Deck
k this deck
40
A sample of 25 service project scores is taken and is recorded below. Construct a frequency distribution for thisdata. 2 Construct histograms of discrete data.
2 Construct histograms of discrete data. Unlock Deck
Unlock for access to all 82 flashcards in this deck.
Unlock Deck
k this deck
41
What is the difference between a bar chart and a histogram?
A) The bars on a bar chart do not touch while the bars of a histogram do touch.
B) The bars in a bar chart may be of various widths while the bars of a histogram are all the same width.
C) The bars in a bar chart are all the same width while the bars of a histogram may be of various widths.
D) There is no difference between these two graphical displays.
Unlock Deck
Unlock for access to all 82 flashcards in this deck.
Unlock Deck
k this deck
42
A) skewed to the right
B) skewed to the left
C) uniform
D) bell shaped
Unlock Deck
Unlock for access to all 82 flashcards in this deck.
Unlock Deck
k this deck
43
Is either histogram symmetric?A) Neither is symmetric.
B) The first is symmetric, but the second is not symmetric.
C) The second is symmetric, but the first is not symmetric.
D) Both are symmetric.
Unlock Deck
Unlock for access to all 82 flashcards in this deck.
Unlock Deck
k this deck
44
The heights (in inches) of 30 mechanics are listed below. Construct a stem-and-leaf plot for the data.
Unlock Deck
Unlock for access to all 82 flashcards in this deck.
Unlock Deck
k this deck
45
For the data below, construct a frequency histogram and a relative frequency histogram.
Unlock Deck
Unlock for access to all 82 flashcards in this deck.
Unlock Deck
k this deck
46
The local police, using radar, checked the speeds (in mph) of 30 motorists at a busy intersection. The results arelisted below. Construct a dot plot for the data.
Unlock Deck
Unlock for access to all 82 flashcards in this deck.
Unlock Deck
k this deck
47
The data set: weekly grocery bills (in dollars) for 20 randomly selected households
A) bell shaped
B) uniform
C) skewed to the left
D) skewed to the right
A) bell shaped
B) uniform
C) skewed to the left
D) skewed to the right
Unlock Deck
Unlock for access to all 82 flashcards in this deck.
Unlock Deck
k this deck
48
For the stem-and-leaf plot below, what are the maximum and minimum entries?
A) max: 49; min: 10
B) max: 38; min: 7
C) max: 47; min: 15
D) max: 40; min: 10
A) max: 49; min: 10
B) max: 38; min: 7
C) max: 47; min: 15
D) max: 40; min: 10
Unlock Deck
Unlock for access to all 82 flashcards in this deck.
Unlock Deck
k this deck
49
The 30 students in Mrs Harrisonʹs literature class were asked how many cousins they had. The results areshown below. Create a frequency histogram for the data using a class width of 2.
Unlock Deck
Unlock for access to all 82 flashcards in this deck.
Unlock Deck
k this deck
50
A sample of 15 Girl Scouts was selected and their weights (in pounds) were recorded. The results are listedbelow. Construct a frequency histogram for the data using a class width of 10 and using 95 as the lower limitof the first class.
Unlock Deck
Unlock for access to all 82 flashcards in this deck.
Unlock Deck
k this deck
51
The number of home runs that Mark McGwire hit in the first 13 years of his major league baseball career arelisted below. (Source: Major League Handbook) Construct a stem-and-leaf plot for this data.
Unlock Deck
Unlock for access to all 82 flashcards in this deck.
Unlock Deck
k this deck
52
A) skewed to the left
B) skewed to the right
C) uniform
D) bell shaped
Unlock Deck
Unlock for access to all 82 flashcards in this deck.
Unlock Deck
k this deck
53
The numbers of runs batted in by Mark McLemore in the first 13 years of his major league baseball career arelisted below. (Source: Major League Handbook) Construct a stem-and-leaf plot for this data.
Unlock Deck
Unlock for access to all 82 flashcards in this deck.
Unlock Deck
k this deck
54
The 30 students in Mrs Harrisonʹs literature class were asked how many cousins they had. The results areshown below. Construct a relative-frequency histogram using a class width of 2.
Unlock Deck
Unlock for access to all 82 flashcards in this deck.
Unlock Deck
k this deck
55
Unlock Deck
Unlock for access to all 82 flashcards in this deck.
Unlock Deck
k this deck
56
The scores for an economics test are listed below. Create a stem-and-leaf plot for the data. 6 Draw dot plots.
6 Draw dot plots. Unlock Deck
Unlock for access to all 82 flashcards in this deck.
Unlock Deck
k this deck
57
The data set: ages of dishwashers (in years) in 20 randomly selected households
A) bell shaped
B) uniform
C) skewed to the left
D) skewed to the right
A) bell shaped
B) uniform
C) skewed to the left
D) skewed to the right
Unlock Deck
Unlock for access to all 82 flashcards in this deck.
Unlock Deck
k this deck
58
The heights (in inches) of 30 mechanics are listed below. Construct a dot plot for the data. 7 Identify the shape of a distribution.
7 Identify the shape of a distribution. Unlock Deck
Unlock for access to all 82 flashcards in this deck.
Unlock Deck
k this deck
59
The data set: Pick Three Lottery Outcomes for 10 Consecutive Weeks
A) uniform
B) bell shaped
C) skewed to the left
D) skewed to the right
A) uniform
B) bell shaped
C) skewed to the left
D) skewed to the right
Unlock Deck
Unlock for access to all 82 flashcards in this deck.
Unlock Deck
k this deck
60
The March utility bills (in dollars) of 30 homeowners are listed below. Construct a stem-and-leaf plot for thedata.
Unlock Deck
Unlock for access to all 82 flashcards in this deck.
Unlock Deck
k this deck
61
The grade point averages for 40 evening students are listed below. Construct a frequency polygon using eightclasses.
Unlock Deck
Unlock for access to all 82 flashcards in this deck.
Unlock Deck
k this deck
62
The class midpoint can be determined by adding to the lower class limit one-half of the class width.
Unlock Deck
Unlock for access to all 82 flashcards in this deck.
Unlock Deck
k this deck
63
Women were allowed to enter the Boston Marathon for the first time in 1972. Listed below are the winningwomenʹs times (in minutes) for the first 10 years. 2.4 Graphical Misrepresentations of Data1 Describe what can make a graph misleading or deceptive.
2.4 Graphical Misrepresentations of Data1 Describe what can make a graph misleading or deceptive. Unlock Deck
Unlock for access to all 82 flashcards in this deck.
Unlock Deck
k this deck
64
The local police, using radar, checked the speeds (in mph) of 30 motorists on a rural road. The results are listedbelow. Construct a relative frequency ogive using six classes.
Unlock Deck
Unlock for access to all 82 flashcards in this deck.
Unlock Deck
k this deck
65
A transportation engineer wishes to use the following data to illustrate the number of deaths from the collisionof passenger cars with motorcycles on a particular highway.
Unlock Deck
Unlock for access to all 82 flashcards in this deck.
Unlock Deck
k this deck
66
The grade point averages for 40 evening students are listed below. Construct a frequency ogive usingeight classes.
Unlock Deck
Unlock for access to all 82 flashcards in this deck.
Unlock Deck
k this deck
67
Unlock Deck
Unlock for access to all 82 flashcards in this deck.
Unlock Deck
k this deck
68
An ogive is a graph that represents cumulative frequencies or cumulative relative frequencies. The pointslabeled on the horizontal axis are the
A) Upper class limits
B) Lower class limits
C) Midpoints
D) Frequencies
A) Upper class limits
B) Lower class limits
C) Midpoints
D) Frequencies
Unlock Deck
Unlock for access to all 82 flashcards in this deck.
Unlock Deck
k this deck
69
The local police, using radar, checked the speeds (in mph) of 30 motorists in a construction area. The results arelisted below. Construct a frequency polygon using six classes and a class width of 3.
Unlock Deck
Unlock for access to all 82 flashcards in this deck.
Unlock Deck
k this deck
70
The heights (in inches) of 30 lawyers are listed below. Construct a frequency ogive using five classes.
Unlock Deck
Unlock for access to all 82 flashcards in this deck.
Unlock Deck
k this deck
71
The commute time (in minutes) of 30 executives are listed below. Construct a frequency distribution, a relativefrequency distribution, a cumulative frequency distribution, and a relative cumulative frequency distributionusing five classes.
Unlock Deck
Unlock for access to all 82 flashcards in this deck.
Unlock Deck
k this deck
72
A) The vertical scale does not begin at zero.
B) The horizontal label is incomplete.
C) The trend is depicted in the wrong direction.
D) The graphic is not misleading.
Unlock Deck
Unlock for access to all 82 flashcards in this deck.
Unlock Deck
k this deck
73
The grade point averages for 40 evening students are listed below. Construct a relative frequency ogive usingeight classes.
Unlock Deck
Unlock for access to all 82 flashcards in this deck.
Unlock Deck
k this deck
74
The local police, using radar, checked the speeds (in mph) of 30 motorists on a rural road. The results are listedbelow. Construct a frequency ogive using six classes.
Unlock Deck
Unlock for access to all 82 flashcards in this deck.
Unlock Deck
k this deck
75
The heights (in inches) of 30 lawyers are listed below. Construct a relative frequency ogive using five classes.
Unlock Deck
Unlock for access to all 82 flashcards in this deck.
Unlock Deck
k this deck
76
The data below represent the consumption of high-energy drinks (in gallons) by adult Americans over anine-year period.
Unlock Deck
Unlock for access to all 82 flashcards in this deck.
Unlock Deck
k this deck
77
The April precipitation amounts (in inches) for 40 cities are listed below. Construct a frequency distribution, arelative frequency distribution, a cumulative frequency distribution, and a relative cumulative frequencydistribution using eight classes.
Unlock Deck
Unlock for access to all 82 flashcards in this deck.
Unlock Deck
k this deck
78
A frequency polygon always begins and ends with a frequency of zero.
Unlock Deck
Unlock for access to all 82 flashcards in this deck.
Unlock Deck
k this deck
79
The volume of our sales has doubled!!!A) The length of a side has doubled, but the area has been multiplied by 4.
B) The length of a side has doubled, but the area has been multiplied by 8.
C) The length of a side has doubled, but the area has been unchanged.
D) The graphic is not misleading.
Unlock Deck
Unlock for access to all 82 flashcards in this deck.
Unlock Deck
k this deck
80
The local police, using radar, checked the speeds (in mph) of 30 motorists in a construction area. The results arelisted below. Construct a frequency distribution, a relative frequency distribution, a cumulative frequencydistribution, and a relative cumulative frequency distribution using six classes. 3 Construct frequency and relative frequency ogives.
3 Construct frequency and relative frequency ogives. Unlock Deck
Unlock for access to all 82 flashcards in this deck.
Unlock Deck
k this deck
Unlock Deck
Unlock for access to all 82 flashcards in this deck.


