Deck 7: Inferences Based on a Single Sample: 355 Tests of Hypotheses
Full screen (f)
Question
Question
A consumer product magazine recently ran a story concerning the increasing prices of digital cameras. The story stated that digital camera prices dipped a couple of years ago, but now are beginning to increase in price because of added features. According to the story, the average price of all digital cameras a couple of years ago was $215.00. A random sample of cameras was recently taken and entered into a spreadsheet. It was desired to test to determine if that average price of all digital cameras is now more than $215.00. The information was entered into a spreadsheet and the following printout was obtained:
One-Sample T Test
Null Hypothesis:
Alternative Hyp:
Cases Included 22
Is a sample size large enough to utilize the central limit theorem in this inferential procedure?
A) Yes, since the central limit theorem works whenever means are used
B) , since
C) Yes, since both np and nq are greater than or equal to 15
D) No, since either np or is less than 15
Question
Question
Question
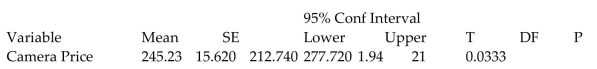
A consumer product magazine recently ran a story concerning the increasing prices of digital cameras. The story stated that digital camera prices dipped a couple of years ago, but now are beginning to increase in price because of added features. According to the story, the average price of all digital cameras a couple of years ago was $215.00. A random sample of cameras was recently taken and entered into a spreadsheet. It was desired to test to determine if that average price of all digital cameras is now more than $215.00. The information was entered into a spreadsheet and the following printout was obtained:
One-Sample T Test
Null Hypothesis:
Alternative Hyp:
Cases Included 22
Use the p-value given above to determine which of the following conclusions is correct.
A) At , there is insufficient evidence to indicate that the mean price of all digital cameras exceeds \$215.00
B) At , there is sufficient evidence to indicate that the mean price of all digital cameras exceeds
C) At , there is insufficient evidence to indicate that the mean price of all digital cameras exceeds
D) At , there is insufficient evidence to indicate that the mean price of all digital cameras exceeds
Question
Question
Question
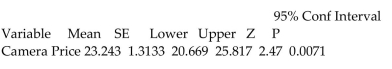
A large university is interested in learning about the average time it takes students to drive to campus. The university sampled 238 students and asked each to provide the amount of time they spent traveling to campus. This variable, travel time, was then used to create a confidence interval and to conduct a test of hypothesis, both of which are shown in the printout below.
One-Sample Z Test
Null Hypothesis:
Alternative Hyp:
Cases Included 238
What conclusion can be made from the test of hypothesis conducted in this printout? Begin each answer with, "When testing at ...
A) ...there is insufficient evidence to indicate that the average travel time of all students is equal to 20 minutes.
B) ...there is sufficient evidence to indicate that the average travel time of all students is equal to 20 minutes.
C) ...there is insufficient evidence to indicate that the average travel time of all students exceeds 20 minutes.
D) ...there is sufficient evidence to indicate that the average travel time of all students exceeds 20 minutes.
Question
Question
Question
Question
Question
Question
Question
Question
Question
Question
Question
Question
Question
Question
Question
Question
Question
Question
Question
Question
Question
Question
Question
Question
Question
Question
Question
Question
Question
Question
Question
Question
Question
Question
Question
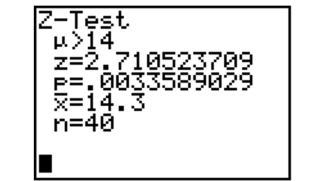
Based on the information in the screen below, what would you conclude in the test of
Question
Question
Question
Question
Question
Question
Question
Question
Question
Question
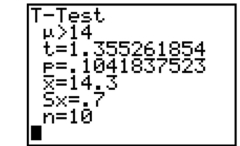
Based on the information in the screen below, what would you conclude in the test of . Use .
Question
Identify the observed level of significance for the test summarized on the screen below and interpret its value.
Question
Question
Question
Question
Question
Question
Question
Question
Question
Question
Question
Question
Question
Question
Question
Question
Question
Question
Question
Question
Question
Question
Question
Question
Question
Question

Unlock Deck
Sign up to unlock the cards in this deck!
Unlock Deck
Unlock Deck
1/144
Play
Full screen (f)
Deck 7: Inferences Based on a Single Sample: 355 Tests of Hypotheses
1
A random sample of observations, selected from a normal population, is used to test the null hypothesis . Specify the appropriate rejection region.
A)
B)
C)
D)
A)
B)
C)
D)
2
A consumer product magazine recently ran a story concerning the increasing prices of digital cameras. The story stated that digital camera prices dipped a couple of years ago, but now are beginning to increase in price because of added features. According to the story, the average price of all digital cameras a couple of years ago was $215.00. A random sample of cameras was recently taken and entered into a spreadsheet. It was desired to test to determine if that average price of all digital cameras is now more than $215.00. The information was entered into a spreadsheet and the following printout was obtained:
One-Sample T Test
Null Hypothesis:
Alternative Hyp:
Cases Included 22
Is a sample size large enough to utilize the central limit theorem in this inferential procedure?
A) Yes, since the central limit theorem works whenever means are used
B) , since
C) Yes, since both np and nq are greater than or equal to 15
D) No, since either np or is less than 15
, since
3
A large university is interested in learning about the average time it takes students to drive to campus. The university sampled 238 students and asked each to provide the amount of time they spent traveling to campus. This variable, travel time, was then used conduct a test of hypothesis.
The goal was to determine if the average travel time of all the university's students differed from 20 minutes. Suppose the sample mean and sample standard deviation were calculated to be 23.2 and 20.26 minutes, respectively. Calculate the value of the test statistic to be used in the test.
A)
B)
C)
D)
4
A consumer product magazine recently ran a story concerning the increasing prices of digital cameras. The story stated that digital camera prices dipped a couple of years ago, but now are beginning to increase in price because of added features. According to the story, the average price of all digital cameras a couple of years ago was . A random sample of cameras was recently taken and entered into a spreadsheet. It was desired to test to determine if that average price of all digital cameras is now more than . Find a rejection region appropriate for this test if we are using .
A) Reject if
B) Reject if
C) Reject if or
D) Reject if
A) Reject if
B) Reject if
C) Reject if or
D) Reject if
Unlock Deck
Unlock for access to all 144 flashcards in this deck.
Unlock Deck
k this deck
5
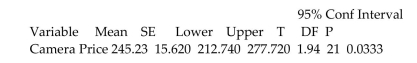
A consumer product magazine recently ran a story concerning the increasing prices of digital cameras. The story stated that digital camera prices dipped a couple of years ago, but now are beginning to increase in price because of added features. According to the story, the average price of all digital cameras a couple of years ago was $215.00. A random sample of cameras was recently taken and entered into a spreadsheet. It was desired to test to determine if that average price of all digital cameras is now more than $215.00. The information was entered into a spreadsheet and the following printout was obtained:
One-Sample T Test
Null Hypothesis:
Alternative Hyp:
Cases Included 22
Use the p-value given above to determine which of the following conclusions is correct.
A) At , there is insufficient evidence to indicate that the mean price of all digital cameras exceeds \$215.00
B) At , there is sufficient evidence to indicate that the mean price of all digital cameras exceeds
C) At , there is insufficient evidence to indicate that the mean price of all digital cameras exceeds
D) At , there is insufficient evidence to indicate that the mean price of all digital cameras exceeds
Unlock Deck
Unlock for access to all 144 flashcards in this deck.
Unlock Deck
k this deck
6
If a hypothesis test were conducted using ? = 0.05, to which of the following p-values would cause the null hypothesis to be rejected.
A) 0.060
B) 0.100
C) 0.040
D) 0.055
A) 0.060
B) 0.100
C) 0.040
D) 0.055
Unlock Deck
Unlock for access to all 144 flashcards in this deck.
Unlock Deck
k this deck
7
A small private college is interested in determining the percentage of its students who live off campus and drive to class. Specifically, it was desired to determine if less than 20% of their current
Students live off campus and drive to class. A sample of 108 students was randomly selected and the following printout was obtained:
Hypothesis Test - One Proportion
Null Hypothesis:
Alternative Hyp:
Based on the information contained in the printout, what conclusion would be correct when testing at .
A) Accept
B) Fail to reject
C) Accept
D) Reject
Unlock Deck
Unlock for access to all 144 flashcards in this deck.
Unlock Deck
k this deck
8
A large university is interested in learning about the average time it takes students to drive to campus. The university sampled 238 students and asked each to provide the amount of time they spent traveling to campus. This variable, travel time, was then used to create a confidence interval and to conduct a test of hypothesis, both of which are shown in the printout below.
One-Sample Z Test
Null Hypothesis:
Alternative Hyp:
Cases Included 238
What conclusion can be made from the test of hypothesis conducted in this printout? Begin each answer with, "When testing at ...
A) ...there is insufficient evidence to indicate that the average travel time of all students is equal to 20 minutes.
B) ...there is sufficient evidence to indicate that the average travel time of all students is equal to 20 minutes.
C) ...there is insufficient evidence to indicate that the average travel time of all students exceeds 20 minutes.
D) ...there is sufficient evidence to indicate that the average travel time of all students exceeds 20 minutes.
One-Sample Z Test
Null Hypothesis:
Alternative Hyp:
Cases Included 238
What conclusion can be made from the test of hypothesis conducted in this printout? Begin each answer with, "When testing at ...
A) ...there is insufficient evidence to indicate that the average travel time of all students is equal to 20 minutes.
B) ...there is sufficient evidence to indicate that the average travel time of all students is equal to 20 minutes.
C) ...there is insufficient evidence to indicate that the average travel time of all students exceeds 20 minutes.
D) ...there is sufficient evidence to indicate that the average travel time of all students exceeds 20 minutes.
Unlock Deck
Unlock for access to all 144 flashcards in this deck.
Unlock Deck
k this deck
9
The State Association of Retired Teachers has recently taken flak from some of its members regarding the poor choice of the association's name. The association's by-laws require that more than 60 percent of the association must approve a name change. Rather than convene a meeting, it is first desired to use a sample to determine if meeting is necessary. Identify the null and alternative hypothesis that should be tested to determine if a name change is warranted.
A) vs.
B) vs.
C) vs.
D) vs.
A) vs.
B) vs.
C) vs.
D) vs.
Unlock Deck
Unlock for access to all 144 flashcards in this deck.
Unlock Deck
k this deck
10
It is desired to test against using . The population in question is uniformly distributed with a standard deviation of 15 . A random sample of 49 will be drawn from this population. If is really equal to 45 , what is the power of the test?
A) 0.8959
B) 0.7544
C) 0.2456
D) 0.1041
A) 0.8959
B) 0.7544
C) 0.2456
D) 0.1041
Unlock Deck
Unlock for access to all 144 flashcards in this deck.
Unlock Deck
k this deck
11
The State Association of Retired Teachers has recently taken flak from some of its members regarding the poor choice of the association's name. The association's by-laws require that more than 60 percent of the association must approve a name change. Rather than convene a meeting, it is first desired to use a sample to determine if meeting is necessary. Suppose the association decided to conduct a test of hypothesis using the following null and alternative hypotheses: Define a Type II Error in the context of this problem.
A) They conclude that more than 60% of the association wants a name change when, in fact, that is not true.
B) They conclude that more than 60% of the association wants a name change when that is, in fact, true.
C) They conclude that exactly 60% of the association wants a name change when, in fact, that is not true.
D) They conclude that exactly 60% of the association wants a name change when that is, in fact, true.
Unlock Deck
Unlock for access to all 144 flashcards in this deck.
Unlock Deck
k this deck
12
A random sample of observations, selected from a normal population, is used to test the null hypothesis . Specify the appropriate rejection region.
A)
B)
C)
D)
A)
B)
C)
D)
Unlock Deck
Unlock for access to all 144 flashcards in this deck.
Unlock Deck
k this deck
13
The State Association of Retired Teachers has recently taken flak from some of its members regarding the poor choice of the association's name. The association's by-laws require that more than 60 percent of the association must approve a name change. Rather than convene a meeting, it
Is first desired to use a sample to determine if meeting is necessary. Suppose the association decided to conduct a test of hypothesis using the following null and alternative hypotheses:
Define a Type I Error in the context of this problem.
A) They conclude that exactly of the association wants a name change when, in fact, that is not true.
B) They conclude that exactly of the association wants a name change when that is, in fact, true.
C) They conclude that more than of the association wants a name change when that is, in fact, true.
D) They conclude that more than of the association wants a name change when, in fact, that is not true.
Unlock Deck
Unlock for access to all 144 flashcards in this deck.
Unlock Deck
k this deck
14
A random sample of observations, selected from a normal population, is used to test the null hypothesis . Specify the appropriate rejection region.
A) or
B) or
C)
D) or
A) or
B) or
C)
D) or
Unlock Deck
Unlock for access to all 144 flashcards in this deck.
Unlock Deck
k this deck
15
It is desired to test H0: µ = 50 against HA: µ ? 50 using ? = 0.10. The population in question is uniformly distributed with a standard deviation of 15. A random sample of 49 will be drawn from this population. If µ is really equal to 48, what is the probability that the hypothesis test would lead the investigator to commit a Type II error?
A) 0.2433
B) 0.8994
C) 0.1006
D) 0.7567
A) 0.2433
B) 0.8994
C) 0.1006
D) 0.7567
Unlock Deck
Unlock for access to all 144 flashcards in this deck.
Unlock Deck
k this deck
16
The business college computing center wants to determine the proportion of business students who have laptop computers. If the proportion exceeds 35%, then the lab will scale back a proposed enlargement of its facilities. Suppose 300 business students were randomly sampled and 75 have laptops. What assumptions are necessary for this test to be satisfied?
A) The sample size satisfies both and .
B) The sample size satisfies .
C) The population has an approximately normal distribution.
D) The sample proportion is close to .
A) The sample size satisfies both and .
B) The sample size satisfies .
C) The population has an approximately normal distribution.
D) The sample proportion is close to .
Unlock Deck
Unlock for access to all 144 flashcards in this deck.
Unlock Deck
k this deck
17
A bottling company produces bottles that hold 12 ounces of liquid. Periodically, the company gets complaints that their bottles are not holding enough liquid. To test this claim, the bottling company randomly samples 64 bottles and finds the average amount of liquid held by the bottles is 11.9155 ounces with a standard deviation of 0.40 ounce. Suppose the p-value of this test is 0.0455. State the proper conclusion.
A) At , fail to reject the null hypothesis.
B) At , reject the null hypothesis.
C) At , accept the null hypothesis.
D) At , reject the null hypothesis.
A) At , fail to reject the null hypothesis.
B) At , reject the null hypothesis.
C) At , accept the null hypothesis.
D) At , reject the null hypothesis.
Unlock Deck
Unlock for access to all 144 flashcards in this deck.
Unlock Deck
k this deck
18
A large university is interested in learning about the average time it takes students to drive to campus. The university sampled 51 students and asked each to provide the amount of time they spent traveling to campus. The sample results found that the sample mean was minutes and the sample standard deviation was minutes. Find the rejection region for determining if the population standard deviation exceeds 20 minutes. Use .
A) Reject if
B) Reject if
C) Reject if
D) Reject if
A) Reject if
B) Reject if
C) Reject if
D) Reject if
Unlock Deck
Unlock for access to all 144 flashcards in this deck.
Unlock Deck
k this deck
19
A consumer product magazine recently ran a story concerning the increasing prices of digital cameras. The story stated that digital camera prices dipped a couple of years ago, but are now beginning to increase in price because of added features. According to the story, the average price of all digital cameras a couple of years ago was $215.00. A random sample of cameras was recently taken and entered into a spreadsheet. It was desired to test to determine if that average price of all digital cameras is now more than $215.00. What null and alternative hypothesis should be tested?
A) vs.
B) vs.
C) vs.
D) vs.
A) vs.
B) vs.
C) vs.
D) vs.
Unlock Deck
Unlock for access to all 144 flashcards in this deck.
Unlock Deck
k this deck
20
A small private college is interested in determining the percentage of its students who live off campus and drive to class. Specifically, it was desired to determine if less than of their curren students live off campus and drive to class. Suppose a sample of 108 students produced a test statistic of . Find the -value for the test of interest to the college.
A)
B)
C)
D)
A)
B)
C)
D)
Unlock Deck
Unlock for access to all 144 flashcards in this deck.
Unlock Deck
k this deck
21
A small private college is interested in determining the percentage of its students who live off campus and drive to class. Specifically, it was desired to determine if less than of their current students live off campus and drive to class. The college decided to take a random sample of 108 of their current students to use in the analysis. Is the sample size of large enough to use this inferential procedure?
A) Yes, since the central limit theorem works whenever proportions are used
B) Yes, since
C) Yes, since both and are greater than or equal to 15
D)
A) Yes, since the central limit theorem works whenever proportions are used
B) Yes, since
C) Yes, since both and are greater than or equal to 15
D)
Unlock Deck
Unlock for access to all 144 flashcards in this deck.
Unlock Deck
k this deck
22
According to an advertisement, a strain of soybeans planted on soil prepared with a specified fertilizer treatment has a mean yield of 556 bushels per acre. Twenty-five farmers who belong to a cooperative plant the soybeans in soil prepared as specified. Each uses a 40-acre plot and records the mean yield per acre. The mean and variance for the sample of 25 farms are 9580. Specify the null and alternative hypotheses used to determine if the mean yield for the soybeans is different than advertised.
Unlock Deck
Unlock for access to all 144 flashcards in this deck.
Unlock Deck
k this deck
23
An educational testing service designed an achievement test so that the range in student
scores would be greater than 420 points. To determine whether the objective was achieved, the testing service gave the test to a random sample of 30 students and found that the sample mean and variance were 759 and 1943, respectively. Conduct the test for
scores would be greater than 420 points. To determine whether the objective was achieved, the testing service gave the test to a random sample of 30 students and found that the sample mean and variance were 759 and 1943, respectively. Conduct the test for
Unlock Deck
Unlock for access to all 144 flashcards in this deck.
Unlock Deck
k this deck
24
For the given rejection region, sketch the sampling distribution for z and indicate the location of the rejection region.
-
-
Unlock Deck
Unlock for access to all 144 flashcards in this deck.
Unlock Deck
k this deck
25
A consumer product magazine recently ran a story concerning the increasing prices of digital cameras. The story stated that digital camera prices dipped a couple of years ago, but now are beginning to increase in price because of added features. According to the story, the average price of all digital cameras a couple of years ago was . A random sample of cameras was recently taken and entered into a spreadsheet. It was desired to test to determine if that average price of all digital cameras is now more than . Find the large-sample rejection region appropriate for this test if we are using .
A) Reject if .
B) Reject if .
C) Reject if or .
D) Reject if or .
A) Reject if .
B) Reject if .
C) Reject if or .
D) Reject if or .
Unlock Deck
Unlock for access to all 144 flashcards in this deck.
Unlock Deck
k this deck
26
A revenue department is under orders to reduce the time small business owners spend filling out pension form ABC-5500. Previously the average time spent on the form was 53 hours. In order to test whether the time to fill out the form has been reduced, a sample of 82 small business owners who annually complete the form was randomly chosen and their completion times recorded. The mean completion time for the sample was 52.8 hours with
a standard deviation of 28 hours. State the rejection region for the desired test at ? = .05.
a standard deviation of 28 hours. State the rejection region for the desired test at ? = .05.
Unlock Deck
Unlock for access to all 144 flashcards in this deck.
Unlock Deck
k this deck
27
A new apparatus has been devised to replace the needle in administering vaccines. The apparatus, which is connected to a large supply of vaccine, can be set to inject different amounts of the serum, but the variance in the amount of serum injected to a given person must not be greater than .08 to ensure proper inoculation. A random sample of 49 injections resulted in a variance of .118. Calculate the test statistic for the test of interest.
Unlock Deck
Unlock for access to all 144 flashcards in this deck.
Unlock Deck
k this deck
28
A large university is interested in learning about the average time it takes students to drive to campus. The university sampled 238 students and asked each to provide the amount of time they spent traveling to campus. This variable, travel time, was then used conduct a test of hypothesis.
The goal was to determine if the average travel time of all the university's students differed from 20 minutes. Suppose the large-sample test statistic was calculated to be z 4. Find the p-value for this test of hypothesis.
A)
B)
C)
D)
The goal was to determine if the average travel time of all the university's students differed from 20 minutes. Suppose the large-sample test statistic was calculated to be z 4. Find the p-value for this test of hypothesis.
A)
B)
C)
D)
Unlock Deck
Unlock for access to all 144 flashcards in this deck.
Unlock Deck
k this deck
29
A small private college is interested in determining the percentage of its students who live off campus and drive to class. Specifically, it was desired to determine if less than 20% of their current students live off campus and drive to class. Find the large-sample rejection region for the test of interest to the college when using a level of significance of 0.01.
A) Reject if .
B) Reject if .
C) Reject if or .
D) Reject if .
A) Reject if .
B) Reject if .
C) Reject if or .
D) Reject if .
Unlock Deck
Unlock for access to all 144 flashcards in this deck.
Unlock Deck
k this deck
30
A random sample of observations is selected from a normal population to test against at . Specify the rejection region.
Unlock Deck
Unlock for access to all 144 flashcards in this deck.
Unlock Deck
k this deck
31
It has been estimated that the -car obtains a mean of 40 miles per gallon on the highway, and the company that manufactures the car claims that it exceeds this estimate in highway driving. To support its assertion, the company randomly selects -cars and records the mileage obtained for each car over a driving course similar to that used to obtain the estimate. The following data resulted: miles per gallon, miles per gallon. Calculate the power of the test if the true value of the mean is 41 miles per gallon. Use a value of .
Unlock Deck
Unlock for access to all 144 flashcards in this deck.
Unlock Deck
k this deck
32
According to an advertisement, a strain of soybeans planted on soil prepared with a specified fertilizer treatment has a mean yield of 103 bushels per acre. Fifteen farmers who belong to a cooperative plant the soybeans in soil prepared as specified. Each uses a 40 -acre plot and records the mean yield per acre. The mean and variance for the sample of the 15 farms are and . Find the rejection region used for determining if the mean yield for the soybeans is not equal to 103 bushels per acre. Use .
Answer: The rejection region requires in both tails of the distribution with . The rejection region is or .
Answer: The rejection region requires in both tails of the distribution with . The rejection region is or .
Unlock Deck
Unlock for access to all 144 flashcards in this deck.
Unlock Deck
k this deck
33
A large university is interested in learning about the average time it takes students to drive to campus. The university sampled 51 students and asked each to provide the amount of time they spent traveling to campus. The sample results found that the sample mean was minutes and the sample standard deviation was minutes. It is desired to determine if the population standard deviation exceeds 20 minutes. Calculate the test statistic for this test of hypothesis.
A)
B)
C)
D)
A)
B)
C)
D)
Unlock Deck
Unlock for access to all 144 flashcards in this deck.
Unlock Deck
k this deck
34
A new apparatus has been devised to replace the needle in administering vaccines. The apparatus, which is connected to a large supply of vaccine, can be set to inject different amounts of the serum, but the variance in the amount of serum injected to a given person must not be greater than to ensure proper inoculation. A random sample of 25 injections was measured. Suppose the -value for the test is . State the proper conclusion using .
Unlock Deck
Unlock for access to all 144 flashcards in this deck.
Unlock Deck
k this deck
35
A company reports that 80% of its employees participate in the company's stock purchase plan. A random sample of 50 employees was asked the question, "Do you participate in the stock purchase plan?" The answers are shown below.
Perform the appropriate test of hypothesis to investigate your suspicion that fewer than 80% of the company's employees participate in the plan. Use
Perform the appropriate test of hypothesis to investigate your suspicion that fewer than 80% of the company's employees participate in the plan. Use
Unlock Deck
Unlock for access to all 144 flashcards in this deck.
Unlock Deck
k this deck
36
It has been estimated that the -car obtains a mean of 30 miles per gallon on the highway, and the company that manufactures the car claims that it exceeds this estimate in highway driving. To support its assertion, the company randomly selects -cars and records the mileage obtained for each car over a driving course similar to that used to obtain the estimate. The following data resulted: miles per gallon, miles per gallon. Calculate the value of if the true value of the mean is 32 miles per gallon. Use .
Unlock Deck
Unlock for access to all 144 flashcards in this deck.
Unlock Deck
k this deck
37
In a test of against , a sample of observations possessed mean and standard deviation . Find and interpret the -value for the test.
Unlock Deck
Unlock for access to all 144 flashcards in this deck.
Unlock Deck
k this deck
38
A random sample of observations is selected from a normal population to test against at . Specify the rejection region.
Unlock Deck
Unlock for access to all 144 flashcards in this deck.
Unlock Deck
k this deck
39
A recipe submitted to a magazine by one of its subscribers states that the mean baking time for a cheesecake is 55 minutes. A test kitchen preparing the recipe before it is published in the magazine makes the cheesecake 10 times at different times of the day in different ovens. The following baking times (in minutes) are observed.
Assume that the baking times belong to a normal population. Test the null hypothesis that the mean baking time is 55 minutes against the alternative hypothesis . Use .
Assume that the baking times belong to a normal population. Test the null hypothesis that the mean baking time is 55 minutes against the alternative hypothesis . Use .
Unlock Deck
Unlock for access to all 144 flashcards in this deck.
Unlock Deck
k this deck
40
A large university is interested in learning about the average time it takes students to drive to campus. The university sampled 238 students and asked each to provide the amount of time they spent traveling to campus. This variable, travel time, was then used conduct a test of hypothesis.
The goal was to determine if the average travel time of all the university's students differed from 20 minutes. Find the large-sample rejection region for the test of interest to the college when using a level of significance of 0.05.
A) Reject if or .
B) Reject if .
C) Reject if .
D) Reject if or .
Unlock Deck
Unlock for access to all 144 flashcards in this deck.
Unlock Deck
k this deck
41
The hypotheses for H0: .05. Sketch the appropriate rejection region.
Unlock Deck
Unlock for access to all 144 flashcards in this deck.
Unlock Deck
k this deck
42
The hypotheses for appropriate rejection region.
Unlock Deck
Unlock for access to all 144 flashcards in this deck.
Unlock Deck
k this deck
43
Based on the information in the screen below, what would you conclude in the test of
Unlock Deck
Unlock for access to all 144 flashcards in this deck.
Unlock Deck
k this deck
44
A new apparatus has been devised to replace the needle in administering vaccines. The apparatus, which is connected to a large supply of vaccine, can be set to inject different amounts of the serum, but the variance in the amount of serum injected to a given person must not be greater than .05 to ensure proper inoculation. A random sample of 25 injections resulted in a variance of .118. Specify the rejection region for the test. Use
Unlock Deck
Unlock for access to all 144 flashcards in this deck.
Unlock Deck
k this deck
45
A random sample of observations is selected from a normal population to test against at . Specify the rejection region.
Unlock Deck
Unlock for access to all 144 flashcards in this deck.
Unlock Deck
k this deck
46
An educational testing service designed an achievement test so that the range in student scores would be greater than 300 points. To determine whether the objective was achieved, the testing service gave the test to a random sample of 42 students and found that the sample mean and variance were 703 and 2574, respectively. Specify the null and alternative hypotheses for determining whether the test achieved the desired dispersion in scores.
Assume that range
Assume that range
Unlock Deck
Unlock for access to all 144 flashcards in this deck.
Unlock Deck
k this deck
47
In a test of against , a sample of observations possessed mean and standard deviation . Find and interpret the -value for the test.
Unlock Deck
Unlock for access to all 144 flashcards in this deck.
Unlock Deck
k this deck
48
Increasing numbers of businesses are offering child-care benefits for their workers.
However, one union claims that more than 85% of firms in the manufacturing sector still do not offer any child-care benefits. A random sample of 350 manufacturing firms is selected, and only 34 of them offer child-care benefits. Specify the rejection region that the union will use when testing at
However, one union claims that more than 85% of firms in the manufacturing sector still do not offer any child-care benefits. A random sample of 350 manufacturing firms is selected, and only 34 of them offer child-care benefits. Specify the rejection region that the union will use when testing at
Unlock Deck
Unlock for access to all 144 flashcards in this deck.
Unlock Deck
k this deck
49
A supermarket sells rotisserie chicken at a fixed price per chicken rather than by the weight of the chicken. The store advertises that the average weight of their chickens is 4.6 pounds.
A random sample of 30 of the store's chickens yielded the weights (in pounds) shown
below.
Find and interpret the -value in a test of against .
A random sample of 30 of the store's chickens yielded the weights (in pounds) shown
below.
Find and interpret the -value in a test of against .
Unlock Deck
Unlock for access to all 144 flashcards in this deck.
Unlock Deck
k this deck
50
A method currently used by doctors to screen women for possible breast cancer fails to detect cancer in 15% of women who actually have the disease. A new method has been developed that researchers hope will be able to detect cancer more accurately. A random sample of 70 women known to have breast cancer were screened using the new method.
Of these, the new method failed to detect cancer in 8. Calculate the test statistic used by the researchers for the corresponding test of hypothesis.
Of these, the new method failed to detect cancer in 8. Calculate the test statistic used by the researchers for the corresponding test of hypothesis.
Unlock Deck
Unlock for access to all 144 flashcards in this deck.
Unlock Deck
k this deck
51
For the given rejection region, sketch the sampling distribution for z and indicate the location of the rejection region.
-A sample of 6 measurements, randomly selected from a normally distributed population, resulted in the following summary statistics: . Test the null hypothesis that the mean of the population is 10 against the alternative hypothesis . Use .
-A sample of 6 measurements, randomly selected from a normally distributed population, resulted in the following summary statistics: . Test the null hypothesis that the mean of the population is 10 against the alternative hypothesis . Use .
Unlock Deck
Unlock for access to all 144 flashcards in this deck.
Unlock Deck
k this deck
52
A random sample of 100 observations is selected from a binomial population with unknown probability of success, . The computed value of is equal to . Find the observed levels of significance in a test of against . Interpret the result.
Unlock Deck
Unlock for access to all 144 flashcards in this deck.
Unlock Deck
k this deck
53
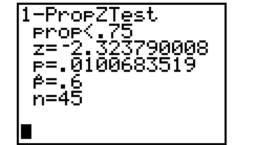
Based on the information in the screen below, what would you conclude in the test of . Use .
Unlock Deck
Unlock for access to all 144 flashcards in this deck.
Unlock Deck
k this deck
54
Identify the observed level of significance for the test summarized on the screen below and interpret its value.
Unlock Deck
Unlock for access to all 144 flashcards in this deck.
Unlock Deck
k this deck
55
For the given rejection region, sketch the sampling distribution for z and indicate the location of the rejection region.
-
-
Unlock Deck
Unlock for access to all 144 flashcards in this deck.
Unlock Deck
k this deck
56
For the given rejection region, sketch the sampling distribution for z and indicate the location of the rejection region.
-
-
Unlock Deck
Unlock for access to all 144 flashcards in this deck.
Unlock Deck
k this deck
57
State University uses thousands of fluorescent light bulbs each year. The brand of bulb it currently uses has a mean life of 800 hours. A competitor claims that its bulbs, which cost the same as the brand the university currently uses, have a mean life of more than 800 hours. The university has decided to purchase the new brand if, when tested, the evidence supports the manufacturer's claim at the significance level. Suppose 121 bulbs were tested with the following results: hours, hours. Conduct the test using .
Unlock Deck
Unlock for access to all 144 flashcards in this deck.
Unlock Deck
k this deck
58
A method currently used by doctors to screen women for possible breast cancer fails to detect cancer in 17% of women who actually have the disease. A new method has beendeveloped that researchers hope will be able to detect cancer more accurately. A random sample of 57 women known to have breast cancer were screened using the new method. Of these, the new method failed to detect cancer in eleven. Specify the null and alternative hypotheses that the researchers wish to test.
Unlock Deck
Unlock for access to all 144 flashcards in this deck.
Unlock Deck
k this deck
59
The scores on a standardized test are reported by the testing agency to have a mean of 70.
Based on his personal observations, a school guidance counselor believes the mean score is much higher. He collects the following scores from a sample of 50 randomly chosen students who took the test.
Use the data to conduct a test of hypotheses at .05 to determine whether there is any evidence to support the counselor's suspicions.
Unlock Deck
Unlock for access to all 144 flashcards in this deck.
Unlock Deck
k this deck
60
In a test of against , the sample data yielded the test statistic . Find and interpret the -value for the test.
Unlock Deck
Unlock for access to all 144 flashcards in this deck.
Unlock Deck
k this deck
61
It is desired to test against using . The population in question is uniformly distributed with a standard deviation of 10 . A random sample of 36 will be drawn from this population. If is really equal to 35 , what is the probability that the hypothesis test would lead the investigator to commit a Type II error?
A)
B)
C)
D)
A)
B)
C)
D)
Unlock Deck
Unlock for access to all 144 flashcards in this deck.
Unlock Deck
k this deck
62
The scores on a standardized test are reported by the testing agency to have a mean of 75.
Based on his personal observations, a school guidance counselor believes the mean score is much higher. He collects the following scores from a sample of 50 randomly chosen students who took the test.
Based on his personal observations, a school guidance counselor believes the mean score is much higher. He collects the following scores from a sample of 50 randomly chosen students who took the test.
Unlock Deck
Unlock for access to all 144 flashcards in this deck.
Unlock Deck
k this deck
63
The null distribution is the distribution of the test statistic assuming the null hypothesis is true; it mound shaped and symmetric about the null mean .
Unlock Deck
Unlock for access to all 144 flashcards in this deck.
Unlock Deck
k this deck
64
Increasing numbers of businesses are offering child-care benefits for their workers.
However, one union claims that more than 90% of firms in the manufacturing sector still do not offer any child-care benefits. A random sample of 250 manufacturing firms is selected and asked if they offer child-care benefits. Suppose the p-value for this test was reported to be State the conclusion of interest to the union.
However, one union claims that more than 90% of firms in the manufacturing sector still do not offer any child-care benefits. A random sample of 250 manufacturing firms is selected and asked if they offer child-care benefits. Suppose the p-value for this test was reported to be State the conclusion of interest to the union.
Unlock Deck
Unlock for access to all 144 flashcards in this deck.
Unlock Deck
k this deck
65
An industrial supplier has shipped a truckload of teflon lubricant cartridges to an aerospace customer. The customer has been assured that the mean weight of these cartridges is in excess of the 13 ounces printed on each cartridge. To check this claim, a sample of cartridges are randomly selected from the shipment and carefully weighed. Summary statistics for the sample are: ounces, ounce. To determine whether the supplier's claim is true, consider the test, vs. , where is the true mean weight of the cartridges. Calculate the value of the test statistic.
A) 0.524
B) 1.100
C) 11.000
D) 2.400
A) 0.524
B) 1.100
C) 11.000
D) 2.400
Unlock Deck
Unlock for access to all 144 flashcards in this deck.
Unlock Deck
k this deck
66
In a test of against , the sample data yielded the test statistic . Find and interpret the -value for the test.
Unlock Deck
Unlock for access to all 144 flashcards in this deck.
Unlock Deck
k this deck
67
A supermarket sells rotisserie chicken at a fixed price per chicken rather than by the weight of the chicken. The store advertises that the average weight of their chickens is 4.6 pounds.
A random sample of 30 of the store's chickens yielded the weights (in pounds) shown below.
Test whether the population mean weight of the chickens is less than 4.6 pounds. Use
A random sample of 30 of the store's chickens yielded the weights (in pounds) shown below.
Test whether the population mean weight of the chickens is less than 4.6 pounds. Use
Unlock Deck
Unlock for access to all 144 flashcards in this deck.
Unlock Deck
k this deck
68
A sample of 8 measurements, randomly selected from a normally distributed population, resulted in the following summary statistics: . Test the null hypothesis that the mean of the population is 4 against the alternative hypothesis
Unlock Deck
Unlock for access to all 144 flashcards in this deck.
Unlock Deck
k this deck
69
State University uses thousands of fluorescent light bulbs each year. The brand of bulb it currently uses has a mean life of 760 hours. A competitor claims that its bulbs, which cost the same as the brand the university currently uses, have a mean life of more than 760 hours. The university has decided to purchase the new brand if, when tested, the evidence supports the manufacturer's claim at the .01 significance level. Suppose 92 bulbs were tested with the following results: hours, hours. Find the rejection region for the test of interest to the State University.
Unlock Deck
Unlock for access to all 144 flashcards in this deck.
Unlock Deck
k this deck
70
An industrial supplier has shipped a truckload of teflon lubricant cartridges to an aerospace customer. The customer has been assured that the mean weight of these cartridges is in excess of the 10 ounces printed on each cartridge. To check this claim, a sample of cartridges are randomly selected from the shipment and carefully weighed. Summary statistics for the sample are: ounces, ounce. To determine whether the supplier's claim is true, consider the test, vs. , where is the true mean weight of the cartridges. Find the rejection region for the test using .
A)
B)
C) , where depends on
D) , where depends on
A)
B)
C) , where depends on
D) , where depends on
Unlock Deck
Unlock for access to all 144 flashcards in this deck.
Unlock Deck
k this deck
71
Data were collected from the sale of 25 properties by a local real estate agent. The following printout concentrated on the land value variable from the sampled properties.
HYPOTHESIS: MEAN X
Find the -value for testing whether the mean land value differs from .
A)
B)
C)
D)
HYPOTHESIS: MEAN X
Find the -value for testing whether the mean land value differs from .
A)
B)
C)
D)
Unlock Deck
Unlock for access to all 144 flashcards in this deck.
Unlock Deck
k this deck
72
A method currently used by doctors to screen women for possible breast cancer fails to detect cancer in 20% of women who actually have the disease. A new method has been developed that researchers hope will be able to detect cancer more accurately. A random sample of 80 women known to have breast cancer were screened using the new method.
Of these, the new method failed to detect cancer in 9. Is the sample size sufficiently large to conduct this test of hypothesis? Explain.
Of these, the new method failed to detect cancer in 9. Is the sample size sufficiently large to conduct this test of hypothesis? Explain.
Unlock Deck
Unlock for access to all 144 flashcards in this deck.
Unlock Deck
k this deck
73
For the given rejection region, sketch the sampling distribution for z and indicate the location of the rejection region.
-
-
Unlock Deck
Unlock for access to all 144 flashcards in this deck.
Unlock Deck
k this deck
74
A random sample of 8 observations from an approximately normal distribution is shown below.
Find the observed level of significance for the test of against . Interpret the result.
Find the observed level of significance for the test of against . Interpret the result.
Unlock Deck
Unlock for access to all 144 flashcards in this deck.
Unlock Deck
k this deck
75
Consider the following printout.
HYPOTHESIS: VARIANCE
SAMPLE MEAN OF
SAMPLE VARIANCE OF X
SAMPLE SIZE OF
HYPOTHESIZED VALUE
VARIANCE
Is this a large enough sample for this analysis to work?
A) Yes, since the and .
B) Yes, since , which is greater than 30 .
C) No.
D) Yes, since the population of GPA scores is approximately normally distributed.
Unlock Deck
Unlock for access to all 144 flashcards in this deck.
Unlock Deck
k this deck
76
The rejection region refers to the values of the test statistic for which we will reject the alternative
hypothesis.
hypothesis.
Unlock Deck
Unlock for access to all 144 flashcards in this deck.
Unlock Deck
k this deck
77
For the given binomial sample size and null-hypothesized value of p0, determine whether the sample size is large enough to use the normal approximation methodology to conduct a test of the null hypothesis
-
A) Yes
B) No
-
A) Yes
B) No
Unlock Deck
Unlock for access to all 144 flashcards in this deck.
Unlock Deck
k this deck
78
For the given rejection region, sketch the sampling distribution for z and indicate the location of the rejection region.
-
-
Unlock Deck
Unlock for access to all 144 flashcards in this deck.
Unlock Deck
k this deck
79
For the given value of ? and observed significance level (p-value), indicate whether the null hypothesis would be rejected.
-
A) Reject
B) Fail to reject
-
A) Reject
B) Fail to reject
Unlock Deck
Unlock for access to all 144 flashcards in this deck.
Unlock Deck
k this deck
80
An ink cartridge for a laser printer is advertised to print an average of 10,000 pages. A random sample of eight businesses that have recently bought this cartridge are asked to report the number of pages printed by a single cartridge. The results are shown.
Assume that the data belong to a normal population. Test the null hypothesis that the mean number of pages is 10,000 against the alternative hypothesis
Assume that the data belong to a normal population. Test the null hypothesis that the mean number of pages is 10,000 against the alternative hypothesis
Unlock Deck
Unlock for access to all 144 flashcards in this deck.
Unlock Deck
k this deck
Unlock Deck
Unlock for access to all 144 flashcards in this deck.


