Deck 2: Methods for Describing Sets of Data
Full screen (f)
Question
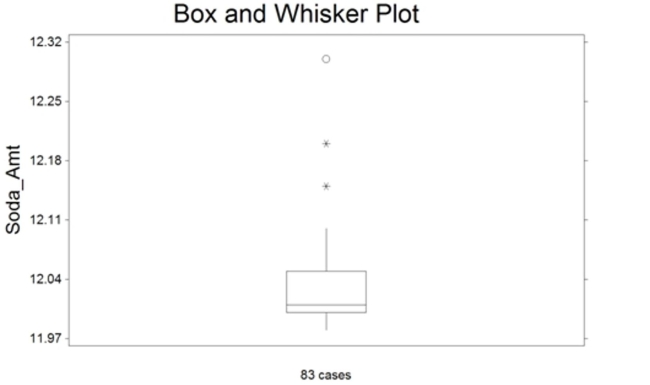
The box plot shown below was constructed for the amount of soda that was poured by a filling machine into 12-ounce soda cans at a local soda bottling company.
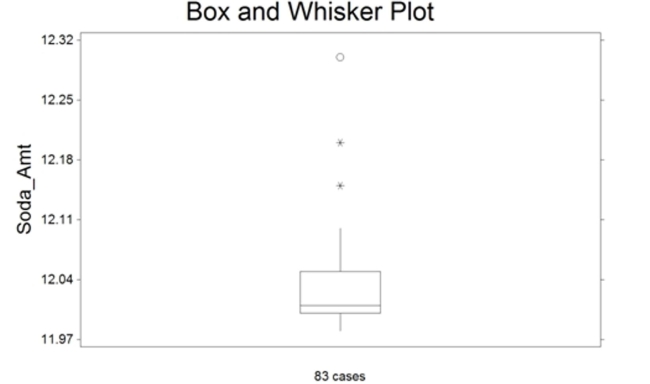
We see that one soda can received 12.15 ounces of soda on the plot above. Based on the box plot presented, how would you classify this observation?
A) it has a lot of soda
B) suspect outlier
C) highly suspect outlier
D) expected observation
We see that one soda can received 12.15 ounces of soda on the plot above. Based on the box plot presented, how would you classify this observation?
A) it has a lot of soda
B) suspect outlier
C) highly suspect outlier
D) expected observation
Question
Question
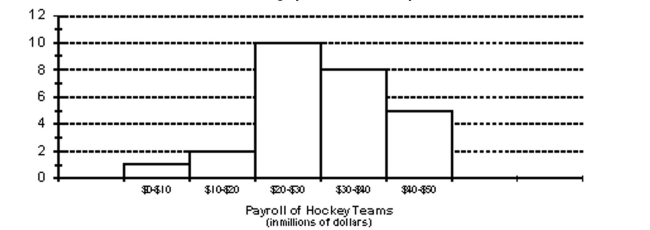
The payroll amounts for all teams in an international hockey league are shown below using a graphical technique from chapter 2 of the text. How many of the hockey team payrolls exceeded $20 million (Note: Assume that no payroll was exactly $20 million)?
A) 18 teams
B) 23 teams
C) 10 teams
D) 8 teams
A) 18 teams
B) 23 teams
C) 10 teams
D) 8 teams
Question
Question
Question
Question
Question
The total points scored by a basketball team for each game during its last season have been summarized in the table below. Which statement following the table must be true? 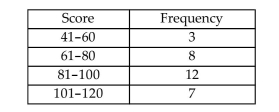
A) The range is at least 41 but at most 120.
B) The range is at least 81 but at most 100.
C) The range is 79.
D) The range is at least 41 but at most 79.
A) The range is at least 41 but at most 120.
B) The range is at least 81 but at most 100.
C) The range is 79.
D) The range is at least 41 but at most 79.
Question
Question
Question
Question
A sample of professional golfers was taken and their driving distance (measured as the average distance as their drive off the tee) and driving accuracy (measured as the percentage of fairways that their drives landed in) were recorded. A scatterplot of the variables is shown below. 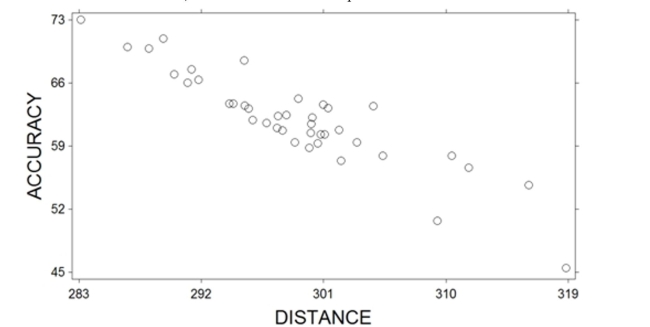
What relationship do these two variables exhibit?
A) They exhibit a positive linear relationship
B) They exhibit a curvillinear relationship
C) They exhibit a negative linear relationship
D) They exhibit no relationship
What relationship do these two variables exhibit?
A) They exhibit a positive linear relationship
B) They exhibit a curvillinear relationship
C) They exhibit a negative linear relationship
D) They exhibit no relationship
Question
Question
Which number on the screen below is the sample standard deviation of the data? 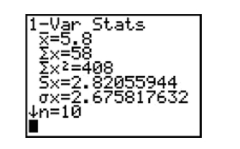
A) 2.82
B) 5.8
C) 408
D) 2.67
A) 2.82
B) 5.8
C) 408
D) 2.67
Question
260 randomly sampled college students were asked, among other things, to state their year in school (freshman, sophomore, junior, or senior). The responses are shown in the bar graph below.
How many of the students who responded would be classified as upperclassmen (e.g., juniors or seniors)?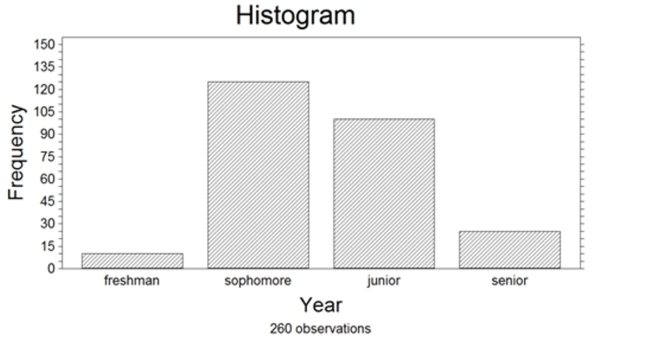
A) Approximately 100
B) Approximately 10
C) Approximately 25
D) Approximately 125
How many of the students who responded would be classified as upperclassmen (e.g., juniors or seniors)?
A) Approximately 100
B) Approximately 10
C) Approximately 25
D) Approximately 125
Question
Question
One of the questions posed to a sample of 286 incoming freshmen at a large public university was, "Do you have any tattoos?" Their responses are shown below in the pie chart. Please note that the values shown represent the number of responses in each category. 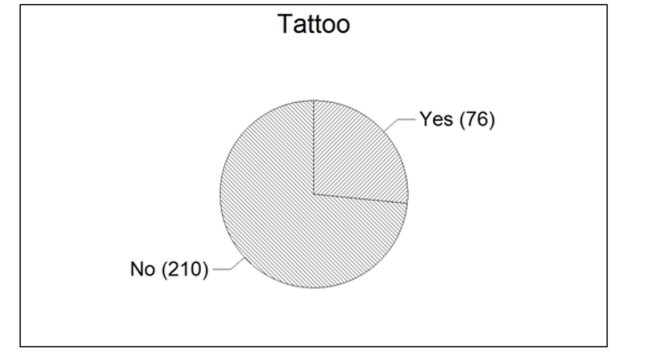 Based on the responses shown in the pie chart, what percentage of the freshmen responded with
"Yes?"
A) 76
B) 26.6%
C) 76%
D) 73.4%
Based on the responses shown in the pie chart, what percentage of the freshmen responded with"Yes?"
A) 76
B) 26.6%
C) 76%
D) 73.4%
Question
The box plot shown below was constructed for the amount of soda that was poured by a filling machine into 12-ounce soda cans at a local soda bottling company.
We see that one soda can received 12.30 ounces of soda on the plot above. Based on the box plot
Presented, how would you classify this observation?
A) it has a lot of soda
B) highly suspect outlier
C) expected observation
D) suspect outlier
We see that one soda can received 12.30 ounces of soda on the plot above. Based on the box plot
Presented, how would you classify this observation?
A) it has a lot of soda
B) highly suspect outlier
C) expected observation
D) suspect outlier
Question
Question
Calculate the standard deviation of a sample for which 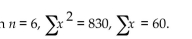
A) 46.00
B) 6.19
C) 164.00
D) 6.78
A) 46.00
B) 6.19
C) 164.00
D) 6.78
Question
Question
Question
Question
Question
Question
Question
Question
Question
Question
Question
Question
Question
Question
Question
A dot plot of the speeds of a sample of 50 cars passing a policeman with a radar gun is shown below. 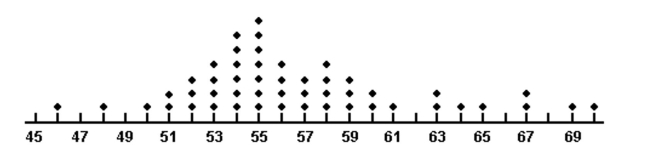
What proportion of the motorists were driving above the posted speed limit of 55 miles per hour?
A) 0.64
B) 0.50
C) 0.14
D) 7
What proportion of the motorists were driving above the posted speed limit of 55 miles per hour?
A) 0.64
B) 0.50
C) 0.14
D) 7
Question
Question
Question
Question
Question
Question
Question
Question
Question
Question
Question
Question
Question
Question
Question
Question
Question
Question
Question
Question
Question
Question
Question
Question
Question
Use a graphing calculator or software to construct a box plot for the following data set. 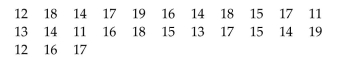
Question
The calculator screens summarize a data set. 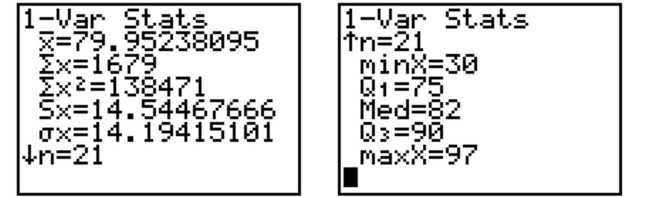
a. Identify the smallest measurement in the data set.
b. Identify the largest measurement in the data set.
c. Calculate the range of the data set.
a. Identify the smallest measurement in the data set.
b. Identify the largest measurement in the data set.
c. Calculate the range of the data set.
Question
Question
Question
Question
Question
Question
Question
The calculator screens summarize a data set. 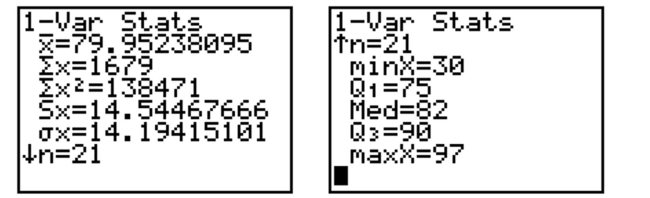
a. How many data items are in the set?
b. What is the sum of the data?
c. Identify the mean, median, and mode, if possible.
a. How many data items are in the set?
b. What is the sum of the data?
c. Identify the mean, median, and mode, if possible.
Question
Question
Question
Question
Question
Question
Question
Question
Question
Question
Question
Question

Unlock Deck
Sign up to unlock the cards in this deck!
Unlock Deck
Unlock Deck
1/188
Play
Full screen (f)
Deck 2: Methods for Describing Sets of Data
1
The box plot shown below was constructed for the amount of soda that was poured by a filling machine into 12-ounce soda cans at a local soda bottling company.
We see that one soda can received 12.15 ounces of soda on the plot above. Based on the box plot presented, how would you classify this observation?
A) it has a lot of soda
B) suspect outlier
C) highly suspect outlier
D) expected observation
We see that one soda can received 12.15 ounces of soda on the plot above. Based on the box plot presented, how would you classify this observation?
A) it has a lot of soda
B) suspect outlier
C) highly suspect outlier
D) expected observation
suspect outlier
2
The amount spent on textbooks for the fall term was recorded for a sample of five university students - $400, $350, $600, $525, and $450. Calculate the value of the sample mean for the data.
A) $450
B) $400
C) $600
D) $465
A) $450
B) $400
C) $600
D) $465
D
3
The payroll amounts for all teams in an international hockey league are shown below using a graphical technique from chapter 2 of the text. How many of the hockey team payrolls exceeded $20 million (Note: Assume that no payroll was exactly $20 million)?
A) 18 teams
B) 23 teams
C) 10 teams
D) 8 teams
A) 18 teams
B) 23 teams
C) 10 teams
D) 8 teams
23 teams
4
The amount spent on textbooks for the fall term was recorded for a sample of five university students - $400, $350, $600, $525, and $450. Calculate the value of the sample median for the data.
A) $600
B) $450
C) $465
D) $400
A) $600
B) $450
C) $465
D) $400
Unlock Deck
Unlock for access to all 188 flashcards in this deck.
Unlock Deck
k this deck
5
252 randomly sampled college students were asked, among other things, to estimate their college grade point average (GPA). The responses are shown in the stem-and-leaf plot shown below.
Notice that a GPA of 3.65 would be indicated with a stem of 36 and a leaf of 5 in the plot. How many of the students who responded had GPA's that exceeded 3.55?
Stem and Leaf Plot of GPA
A) 39
B) 31
C) 19
D) 49
Notice that a GPA of 3.65 would be indicated with a stem of 36 and a leaf of 5 in the plot. How many of the students who responded had GPA's that exceeded 3.55?
Stem and Leaf Plot of GPA
A) 39
B) 31
C) 19
D) 49
Unlock Deck
Unlock for access to all 188 flashcards in this deck.
Unlock Deck
k this deck
6
What class percentage corresponds to a class relative frequency of .37?
A) 63%
B) 37%
C) .63%
D) .37%
A) 63%
B) 37%
C) .63%
D) .37%
Unlock Deck
Unlock for access to all 188 flashcards in this deck.
Unlock Deck
k this deck
7
At the U.S. Open Tennis Championship a statistician keeps track of every serve that a player hits during the tournament. The statistician reported that the mean serve speed was 100 miles per hour (mph) and the standard deviation of the serve speeds was 15 mph. If nothing is known about the shape of the distribution, what percentage of the player's serve speeds are less than 70 mph?
A) at most 11%
B) approximately 2.5%
C) approximately 5%
D) at most 12.5%
E) at most 25%
A) at most 11%
B) approximately 2.5%
C) approximately 5%
D) at most 12.5%
E) at most 25%
Unlock Deck
Unlock for access to all 188 flashcards in this deck.
Unlock Deck
k this deck
8
The total points scored by a basketball team for each game during its last season have been summarized in the table below. Which statement following the table must be true?
A) The range is at least 41 but at most 120.
B) The range is at least 81 but at most 100.
C) The range is 79.
D) The range is at least 41 but at most 79.
A) The range is at least 41 but at most 120.
B) The range is at least 81 but at most 100.
C) The range is 79.
D) The range is at least 41 but at most 79.
Unlock Deck
Unlock for access to all 188 flashcards in this deck.
Unlock Deck
k this deck
9
A recent survey was conducted to compare the cost of solar energy to the cost of gas or electric energy. Results of the survey revealed that the distribution of the amount of the monthly utility bill of a 3-bedroom house using gas or electric energy had a mean of $100 and a standard deviation of $14. Three solar homes reported monthly utility bills of $51, $48, and $56. Which of the following statements is true?
A) The utility bills for homes using solar power are about the same as those for homes using only gas and electricity.
B) Homes using solar power may have lower utility bills than homes using only gas and electricity.
C) Homes using solar power may actually have higher utility bills than homes using only gas and electricity.
D) Homes using solar power always have lower utility bills than homes using only gas and electricity.
Unlock Deck
Unlock for access to all 188 flashcards in this deck.
Unlock Deck
k this deck
10
The amount spent on textbooks for the fall term was recorded for a sample of five hundred university students. The mean expenditure was calculated to be $500 and the median expenditure was calculated to be $425. Which of the following interpretations of the mean is correct?
A) 50% of the students sampled had textbook costs that were less than $500
B) The average of the textbook costs sampled was $500
C) 50% of the students sampled had textbook costs equal to $500
D) The most frequently occurring textbook cost in the sample was $500
A) 50% of the students sampled had textbook costs that were less than $500
B) The average of the textbook costs sampled was $500
C) 50% of the students sampled had textbook costs equal to $500
D) The most frequently occurring textbook cost in the sample was $500
Unlock Deck
Unlock for access to all 188 flashcards in this deck.
Unlock Deck
k this deck
11
The amount of time workers spend commuting to their jobs each day in a large metropolitan city has a mean of 70 minutes and a standard deviation of 20 minutes. Assuming the distribution of commuting times is known to be moundshaped and symmetric, what percentage of these commuting times are between 50 and 110 minutes?
A) approximately 95%
B) approximately 68%
C) approximately 97.5%
D) approximately 81.5%
A) approximately 95%
B) approximately 68%
C) approximately 97.5%
D) approximately 81.5%
Unlock Deck
Unlock for access to all 188 flashcards in this deck.
Unlock Deck
k this deck
12
A sample of professional golfers was taken and their driving distance (measured as the average distance as their drive off the tee) and driving accuracy (measured as the percentage of fairways that their drives landed in) were recorded. A scatterplot of the variables is shown below.
What relationship do these two variables exhibit?
A) They exhibit a positive linear relationship
B) They exhibit a curvillinear relationship
C) They exhibit a negative linear relationship
D) They exhibit no relationship
What relationship do these two variables exhibit?
A) They exhibit a positive linear relationship
B) They exhibit a curvillinear relationship
C) They exhibit a negative linear relationship
D) They exhibit no relationship
Unlock Deck
Unlock for access to all 188 flashcards in this deck.
Unlock Deck
k this deck
13
In an eye color study, 25 out of 50 people in the sample had brown eyes. In this situation, what does the number .50 represent?
A) a class relative frequency
B) a class percentage
C) a class frequency
D) a class
A) a class relative frequency
B) a class percentage
C) a class frequency
D) a class
Unlock Deck
Unlock for access to all 188 flashcards in this deck.
Unlock Deck
k this deck
14
Which number on the screen below is the sample standard deviation of the data?
A) 2.82
B) 5.8
C) 408
D) 2.67
A) 2.82
B) 5.8
C) 408
D) 2.67
Unlock Deck
Unlock for access to all 188 flashcards in this deck.
Unlock Deck
k this deck
15
260 randomly sampled college students were asked, among other things, to state their year in school (freshman, sophomore, junior, or senior). The responses are shown in the bar graph below.
How many of the students who responded would be classified as upperclassmen (e.g., juniors or seniors)?
A) Approximately 100
B) Approximately 10
C) Approximately 25
D) Approximately 125
How many of the students who responded would be classified as upperclassmen (e.g., juniors or seniors)?
A) Approximately 100
B) Approximately 10
C) Approximately 25
D) Approximately 125
Unlock Deck
Unlock for access to all 188 flashcards in this deck.
Unlock Deck
k this deck
16
Calculate the variance of a sample for which
A) 8.00
B) 326.00
C)
D) 10.00
A) 8.00
B) 326.00
C)
D) 10.00
Unlock Deck
Unlock for access to all 188 flashcards in this deck.
Unlock Deck
k this deck
17
One of the questions posed to a sample of 286 incoming freshmen at a large public university was, "Do you have any tattoos?" Their responses are shown below in the pie chart. Please note that the values shown represent the number of responses in each category. Based on the responses shown in the pie chart, what percentage of the freshmen responded with
"Yes?"
A) 76
B) 26.6%
C) 76%
D) 73.4%
Based on the responses shown in the pie chart, what percentage of the freshmen responded with"Yes?"
A) 76
B) 26.6%
C) 76%
D) 73.4%
Unlock Deck
Unlock for access to all 188 flashcards in this deck.
Unlock Deck
k this deck
18
The box plot shown below was constructed for the amount of soda that was poured by a filling machine into 12-ounce soda cans at a local soda bottling company.
We see that one soda can received 12.30 ounces of soda on the plot above. Based on the box plot
Presented, how would you classify this observation?
A) it has a lot of soda
B) highly suspect outlier
C) expected observation
D) suspect outlier
We see that one soda can received 12.30 ounces of soda on the plot above. Based on the box plot
Presented, how would you classify this observation?
A) it has a lot of soda
B) highly suspect outlier
C) expected observation
D) suspect outlier
Unlock Deck
Unlock for access to all 188 flashcards in this deck.
Unlock Deck
k this deck
19
At the U.S. Open Tennis Championship a statistician keeps track of every serve that a player hits during the tournament. The statistician reported that the mean serve speed of a particular player was 96 miles per hour. Suppose that the statistician indicated that the serve speed distribution was skewed to the left. Which of the following values is most likely the value of the median serve speed?
A) 86 mph
B) 96 mph
C) 101 mph
D) 91 mph
A) 86 mph
B) 96 mph
C) 101 mph
D) 91 mph
Unlock Deck
Unlock for access to all 188 flashcards in this deck.
Unlock Deck
k this deck
20
Calculate the standard deviation of a sample for which
A) 46.00
B) 6.19
C) 164.00
D) 6.78
A) 46.00
B) 6.19
C) 164.00
D) 6.78
Unlock Deck
Unlock for access to all 188 flashcards in this deck.
Unlock Deck
k this deck
21
The range of scores on a statistics test was 42. The lowest score was 57. What was the highest score?
A) 70.5
B) cannot be determined
C) 78
D) 99
A) 70.5
B) cannot be determined
C) 78
D) 99
Unlock Deck
Unlock for access to all 188 flashcards in this deck.
Unlock Deck
k this deck
22
At the U.S. Open Tennis Championship a statistician keeps track of every serve that a player hits during the tournament. The statistician reported that the mean serve speed was 100 miles per hour (mph) and the standard deviation of the serve speeds was 15 mph. Assume that the statistician also gave us the information that the distribution of serve speeds was mound-shaped and symmetric.
What percentage of the player's serves were between 115 mph and 145 mph?
A) at most 13.5%
B) approximately 16%
C) at most 2.5%
D) at most 34%
What percentage of the player's serves were between 115 mph and 145 mph?
A) at most 13.5%
B) approximately 16%
C) at most 2.5%
D) at most 34%
Unlock Deck
Unlock for access to all 188 flashcards in this deck.
Unlock Deck
k this deck
23
The amount spent on textbooks for the fall term was recorded for a sample of five hundred university students. The mean expenditure was calculated to be $500 and the median expenditure was calculated to be $425. Which of the following interpretations of the median is correct?
A) 50% of the students sampled had textbook costs equal to $425
B) 50% of the students sampled had textbook costs that were less than $425
C) The average of the textbook costs sampled was $425
D) The most frequently occurring textbook cost in the sample was $425
A) 50% of the students sampled had textbook costs equal to $425
B) 50% of the students sampled had textbook costs that were less than $425
C) The average of the textbook costs sampled was $425
D) The most frequently occurring textbook cost in the sample was $425
Unlock Deck
Unlock for access to all 188 flashcards in this deck.
Unlock Deck
k this deck
24
The amount spent on textbooks for the fall term was recorded for a sample of five hundred university students. It was determined that the 75th percentile was the value $500. Which of the following interpretations of the 75th percentile is correct?
A) 75% of the students sampled had textbook costs that exceeded $500.
B) 75% of the students sampled had textbook costs equal to $500.
C) 25% of the students sampled had textbook costs that exceeded $500.
D) The average of the 500 textbook costs was $500.
A) 75% of the students sampled had textbook costs that exceeded $500.
B) 75% of the students sampled had textbook costs equal to $500.
C) 25% of the students sampled had textbook costs that exceeded $500.
D) The average of the 500 textbook costs was $500.
Unlock Deck
Unlock for access to all 188 flashcards in this deck.
Unlock Deck
k this deck
25
A survey was conducted to determine how people feel about the quality of programming available on television. Respondents were asked to rate the overall quality from 0 (no quality at all) to 100 (extremely good quality). The stem-and-leaf display of the data is shown below. What percentage of the respondents rated overall television quality as very good (regarded as ratings of 80 and above)?
A) 1%
B) 5%
C) 4%
D) 20%
A) 1%
B) 5%
C) 4%
D) 20%
Unlock Deck
Unlock for access to all 188 flashcards in this deck.
Unlock Deck
k this deck
26
By law, a box of cereal labeled as containing 24 ounces must contain at least 24 ounces of cereal. The machine filling the boxes produces a distribution of fill weights that is mound-shaped and symmetric, with a mean equal to the setting on the machine and with a standard deviation equal to 0.02 ounce. To ensure that most of the boxes contain at least 24 ounces, the machine is set so that the mean fill per box is 24.06 ounces. What percentage of the boxes do, in fact, contain at least 24 ounces?
Unlock Deck
Unlock for access to all 188 flashcards in this deck.
Unlock Deck
k this deck
27
The amount spent on textbooks for the fall term was recorded for a sample of five university students - $400, $350, $600, $525, and $450. Calculate the value of the sample range for the data.
A) $98.75
B) $450
C) $99.37
D) $250
A) $98.75
B) $450
C) $99.37
D) $250
Unlock Deck
Unlock for access to all 188 flashcards in this deck.
Unlock Deck
k this deck
28
A recent survey was conducted to compare the cost of solar energy to the cost of gas or
electric energy. Results of the survey revealed that the distribution of the amount of the monthly utility bill of a 3-bedroom house using gas or electric energy had a mean of $124.00 and a standard deviation of $15.00. Assuming the distribution is mound-shaped and symmetric, would you expect to see a 3-bedroom house using gas or electric energy with a monthly utility bill of $236.50? Explain.
electric energy. Results of the survey revealed that the distribution of the amount of the monthly utility bill of a 3-bedroom house using gas or electric energy had a mean of $124.00 and a standard deviation of $15.00. Assuming the distribution is mound-shaped and symmetric, would you expect to see a 3-bedroom house using gas or electric energy with a monthly utility bill of $236.50? Explain.
Unlock Deck
Unlock for access to all 188 flashcards in this deck.
Unlock Deck
k this deck
29
The output below displays the mean and median for the state high school dropout rates in
year 1 and in year 5. Use the information to determine the shape of the distributions of the high school dropout rates in year 1 and year 5.
year 1 and in year 5. Use the information to determine the shape of the distributions of the high school dropout rates in year 1 and year 5.
Unlock Deck
Unlock for access to all 188 flashcards in this deck.
Unlock Deck
k this deck
30
The table shows the number of each type of book found at an online auction site during arecent search.
a. Construct a relative frequency table for the book data.
b. Construct a pie chart for the book data.
a. Construct a relative frequency table for the book data.
b. Construct a pie chart for the book data.
Unlock Deck
Unlock for access to all 188 flashcards in this deck.
Unlock Deck
k this deck
31
The amount spent on textbooks for the fall term was recorded for a sample of five university students - $400, $350, $600, $525, and $450. Calculate the value of the sample standard deviation for the data.
A) $450
B) $250
C) $98.75
D) $99.37
A) $450
B) $250
C) $98.75
D) $99.37
Unlock Deck
Unlock for access to all 188 flashcards in this deck.
Unlock Deck
k this deck
32
Which of the following is a measure of the variability of a distribution?
A) skewness
B) range
C) sample size
D) median
A) skewness
B) range
C) sample size
D) median
Unlock Deck
Unlock for access to all 188 flashcards in this deck.
Unlock Deck
k this deck
33
The amount spent on textbooks for the fall term was recorded for a sample of five hundred university students. The mean expenditure was calculated to be $500 and the standard deviation of the expenditures was calculated to be $100. Suppose a randomly selected student reported that their textbook expenditure was $700. Calculate the z-score for this student's textbook expenditure.
A) -2
B) -3
C) +2
D) +3
A) -2
B) -3
C) +2
D) +3
Unlock Deck
Unlock for access to all 188 flashcards in this deck.
Unlock Deck
k this deck
34
Parking at a university has become a problem. University administrators are interested in determining the average time it takes a student to find a parking spot. An administrator inconspicuously followed 90 students and recorded how long it took each of them to find a parking spot. Which of the following types of graphs should not be used to display information concerning
The students parking times?
A) box plot
B) stem-and-leaf display
C) pie chart
D) histogram
The students parking times?
A) box plot
B) stem-and-leaf display
C) pie chart
D) histogram
Unlock Deck
Unlock for access to all 188 flashcards in this deck.
Unlock Deck
k this deck
35
A dot plot of the speeds of a sample of 50 cars passing a policeman with a radar gun is shown below.
What proportion of the motorists were driving above the posted speed limit of 55 miles per hour?
A) 0.64
B) 0.50
C) 0.14
D) 7
What proportion of the motorists were driving above the posted speed limit of 55 miles per hour?
A) 0.64
B) 0.50
C) 0.14
D) 7
Unlock Deck
Unlock for access to all 188 flashcards in this deck.
Unlock Deck
k this deck
36
Explain how using a scale break on the vertical axis of a histogram can be misleading.
Unlock Deck
Unlock for access to all 188 flashcards in this deck.
Unlock Deck
k this deck
37
At the U.S. Open Tennis Championship a statistician keeps track of every serve that a player hits during the tournament. The statistician reported that the mean serve speed of a particular player was 100 miles per hour (mph) and the standard deviation of the serve speeds was 15 mph. Using the z-score approach for detecting outliers, which of the following serve speeds would represent outliers in the distribution of the player's serve speeds?
Speeds: 50 mph, 80 mph, and 105 mph
A) 50 is the only outlier.
B) 50, 80, and 105 are all outliers.
C) 50 and 80 are both outliers, 105 is not.
D) None of the three speeds are outliers.
Speeds: 50 mph, 80 mph, and 105 mph
A) 50 is the only outlier.
B) 50, 80, and 105 are all outliers.
C) 50 and 80 are both outliers, 105 is not.
D) None of the three speeds are outliers.
Unlock Deck
Unlock for access to all 188 flashcards in this deck.
Unlock Deck
k this deck
38
The z-score for a value x is -2.5. State whether the value of x lies above or below the mean and by how many standard deviations.
Unlock Deck
Unlock for access to all 188 flashcards in this deck.
Unlock Deck
k this deck
39
The temperature fluctuated between a low of 73°F and a high of 89°F. Which of the following could be calculated using just this information?
A) variance
B) median
C) standard deviation
D) range
A) variance
B) median
C) standard deviation
D) range
Unlock Deck
Unlock for access to all 188 flashcards in this deck.
Unlock Deck
k this deck
40
The amount of time workers spend commuting to their jobs each day in a large metropolitan city has a mean of 70 minutes and a standard deviation of 20 minutes. Assuming nothing is known about the shape of the distribution of commuting times, what percentage of these commuting times are between 30 and 110 minutes?
A) at least 75%
B) at least 89%
C) at least 0%
D) at least 95%
A) at least 75%
B) at least 89%
C) at least 0%
D) at least 95%
Unlock Deck
Unlock for access to all 188 flashcards in this deck.
Unlock Deck
k this deck
41
The data show the total number of medals (gold, silver, and bronze) won by each country winning at least one gold medal in the Winter Olympics. Find the range, sample variance, and sample standard deviation of the numbers of medals won by these countries.
Unlock Deck
Unlock for access to all 188 flashcards in this deck.
Unlock Deck
k this deck
42
Explain how it can be misleading to draw the bars in a histogram so that the width of each bar is proportional to its height rather than have all bars the same width.
Unlock Deck
Unlock for access to all 188 flashcards in this deck.
Unlock Deck
k this deck
43
A study was designed to investigate the effects of two variables - (1) a student's level of mathematical anxiety and (2) teaching method - on a student's achievement in a mathematics course. Students who had a low level of mathematical anxiety were taught using the traditional expository method. These students obtained a mean score of 310 and a standard deviation of 50 on a standardized test. Find and interpret the z-score of a student who scored 490 on the standardized test.
Unlock Deck
Unlock for access to all 188 flashcards in this deck.
Unlock Deck
k this deck
44
Complete the frequency table for the data shown below.
Unlock Deck
Unlock for access to all 188 flashcards in this deck.
Unlock Deck
k this deck
45
The amount of television viewed by today's youth is of primary concern to Parents Against Watching Television (PAWT). Three hundred parents of elementary school-aged children were asked to estimate the number of hours per week that their child watches television.
The upper quartile for the distribution was given as 20 hours. Interpret this value.
The upper quartile for the distribution was given as 20 hours. Interpret this value.
Unlock Deck
Unlock for access to all 188 flashcards in this deck.
Unlock Deck
k this deck
46
The data show the total number of medals (gold, silver, and bronze) won by each country winning at least one gold medal in the Winter Olympics.
a. Complete the class frequency table for the data.
b. Using the classes from the frequency table, construct a histogram for the data.
a. Complete the class frequency table for the data.
b. Using the classes from the frequency table, construct a histogram for the data.
Unlock Deck
Unlock for access to all 188 flashcards in this deck.
Unlock Deck
k this deck
47
The following data represent the scores of 50 students on a statistics exam.
a. Find the lower quartile, the upper quartile, and the median of the scores.
b. Find the interquartile range of the data and use it to identify potential outliers.
c. In a box plot for the data, which scores, if any, would be outside the outer fences?
Which scores, if any, would be outside the inner fences but inside the outer fences?
Unlock Deck
Unlock for access to all 188 flashcards in this deck.
Unlock Deck
k this deck
48
The total points scored by a basketball team for each game during its last season have been
summarized in the table below.
a. Explain why you cannot use the information in the table to construct a stem-and-leaf display for the data.
b. Construct a histogram for the scores.
summarized in the table below.
a. Explain why you cannot use the information in the table to construct a stem-and-leaf display for the data.
b. Construct a histogram for the scores.
Unlock Deck
Unlock for access to all 188 flashcards in this deck.
Unlock Deck
k this deck
49
In a summary of recent real estate sales, the median home price is given as $325,000. What percentile corresponds to a home price of $325,000?
Unlock Deck
Unlock for access to all 188 flashcards in this deck.
Unlock Deck
k this deck
50
Suppose that 50 and 75 are two elements of a population data set and their z-scores are -3 and 2, respectively. Find the mean and standard deviation.
Unlock Deck
Unlock for access to all 188 flashcards in this deck.
Unlock Deck
k this deck
51
The table shows the number of each type of car sold in June.
a. Construct a relative frequency table for the car sales.
b. Construct a Pareto diagram for the car sales using the class percentages as the heights
of the bars.
a. Construct a relative frequency table for the car sales.
b. Construct a Pareto diagram for the car sales using the class percentages as the heights
of the bars.
Unlock Deck
Unlock for access to all 188 flashcards in this deck.
Unlock Deck
k this deck
52
A small computing center has found that the number of jobs submitted per day to its computers has a distribution that is approximately mound-shaped and symmetric, with a mean of 93 jobs and a standard deviation of 8. On what percentage of days do the number of jobs submitted exceed 101?
Unlock Deck
Unlock for access to all 188 flashcards in this deck.
Unlock Deck
k this deck
53
The data below show the types of medals won by athletes representing the United States in the Winter Olympics.
a. Construct a frequency table for the data.
b. Construct a relative frequency table for the data.
c. Construct a frequency bar graph for the data.
a. Construct a frequency table for the data.
b. Construct a relative frequency table for the data.
c. Construct a frequency bar graph for the data.
Unlock Deck
Unlock for access to all 188 flashcards in this deck.
Unlock Deck
k this deck
54
An annual survey sent to retail store managers contained the question "Did your store suffer any losses due to employee theft?" The responses are summarized in the table for two years. Compare the responses for the two years using side-by-side bar charts. What inferences can be made from the charts?
Unlock Deck
Unlock for access to all 188 flashcards in this deck.
Unlock Deck
k this deck
55
The scores for a statistics test are as follows:
Create a stem-and-leaf display for the data.
Create a stem-and-leaf display for the data.
Unlock Deck
Unlock for access to all 188 flashcards in this deck.
Unlock Deck
k this deck
56
The data below represent the numbers of absences and the final grades of 15 randomly
selected students from a statistics class. Construct a scattergram for the data. Do you detect
a trend?
selected students from a statistics class. Construct a scattergram for the data. Do you detect
a trend?
Unlock Deck
Unlock for access to all 188 flashcards in this deck.
Unlock Deck
k this deck
57
Many firms use on-the-job training to teach their employees computer programming. Suppose you work in the personnel department of a firm that just finished training a group of its employees to program, and you have been requested to review the performance of one of the trainees on the final test that was given to all trainees. The mean and standard deviation of the test scores are 76 and 4, respectively, and the distribution of scores is mound-shaped and symmetric. If a firm wanted to give the best 2.5% of the trainees a big promotion, what test score would be used to identify the trainees in question?
Unlock Deck
Unlock for access to all 188 flashcards in this deck.
Unlock Deck
k this deck
58
The data show the total number of medals (gold, silver, and bronze) won by each country winning at least one gold medal in the Winter Olympics. Find the mean, median, and mode of the numbers of medals won by these countries.
Unlock Deck
Unlock for access to all 188 flashcards in this deck.
Unlock Deck
k this deck
59
Explain how it can be misleading to report only the mean of a distribution without any measure of the variability.
Unlock Deck
Unlock for access to all 188 flashcards in this deck.
Unlock Deck
k this deck
60
Use a graphing calculator or software to construct a box plot for the following data set.
Unlock Deck
Unlock for access to all 188 flashcards in this deck.
Unlock Deck
k this deck
61
The calculator screens summarize a data set.
a. Identify the smallest measurement in the data set.
b. Identify the largest measurement in the data set.
c. Calculate the range of the data set.
a. Identify the smallest measurement in the data set.
b. Identify the largest measurement in the data set.
c. Calculate the range of the data set.
Unlock Deck
Unlock for access to all 188 flashcards in this deck.
Unlock Deck
k this deck
62
The scores of nine members of a women's golf team in two rounds of tournament play are listed below.
Construct a scattergram for the data.
Construct a scattergram for the data.
Unlock Deck
Unlock for access to all 188 flashcards in this deck.
Unlock Deck
k this deck
63
For a given data set, which is typically greater, the range or the standard deviation?
Unlock Deck
Unlock for access to all 188 flashcards in this deck.
Unlock Deck
k this deck
64
The following data represent the scores of 50 students on a statistics exam. The mean score is 80.02, and the standard deviation is 11.9. Find the z-scores for the highest and lowest exam scores.
Unlock Deck
Unlock for access to all 188 flashcards in this deck.
Unlock Deck
k this deck
65
Each year advertisers spend billions of dollars purchasing commercial time on network television. In the first 6 months of one year, advertisers spent $1.1 billion. Who were the largest spenders? In a recent article, the top 10 leading spenders and how much each spent (in million of dollars) were listed:
Calculate the mean and median for the data.
Calculate the mean and median for the data.
Unlock Deck
Unlock for access to all 188 flashcards in this deck.
Unlock Deck
k this deck
66
Given the sample variance of a distribution, explain how to find the standard deviation.
Unlock Deck
Unlock for access to all 188 flashcards in this deck.
Unlock Deck
k this deck
67
Explain how stretching the vertical axis of a histogram can be misleading.
Unlock Deck
Unlock for access to all 188 flashcards in this deck.
Unlock Deck
k this deck
68
The calculator screens summarize a data set.
a. How many data items are in the set?
b. What is the sum of the data?
c. Identify the mean, median, and mode, if possible.
a. How many data items are in the set?
b. What is the sum of the data?
c. Identify the mean, median, and mode, if possible.
Unlock Deck
Unlock for access to all 188 flashcards in this deck.
Unlock Deck
k this deck
69
Calculate the mean of a sample for which
Unlock Deck
Unlock for access to all 188 flashcards in this deck.
Unlock Deck
k this deck
70
The mean x of a data set is 18, and the sample standard deviation s is 2. Explain what the interval (12, 24) represents.
Unlock Deck
Unlock for access to all 188 flashcards in this deck.
Unlock Deck
k this deck
71
A radio station claims that the amount of advertising each hour has an a mean of 17 minutes and a standard deviation of 2.5 minutes. You listen to the radio station for 1 hour and observe that the amount of advertising time is 11.75 minutes. Based on your observation, what would you infer about the radio station's claim?
Unlock Deck
Unlock for access to all 188 flashcards in this deck.
Unlock Deck
k this deck
72
For a given data set, the lower quartile is 45, the median is 50, and the upper quartile is 57.
The minimum value in the data set is 32, and the maximum is 81.
a. Find the interquartile range.
b. Find the inner fences.
c. Find the outer fences.
d. Is either of the minimum or maximum values considered an outlier? Explain.
The minimum value in the data set is 32, and the maximum is 81.
a. Find the interquartile range.
b. Find the inner fences.
c. Find the outer fences.
d. Is either of the minimum or maximum values considered an outlier? Explain.
Unlock Deck
Unlock for access to all 188 flashcards in this deck.
Unlock Deck
k this deck
73
What is the primary advantage of a time series plot?
Unlock Deck
Unlock for access to all 188 flashcards in this deck.
Unlock Deck
k this deck
74
A retail store's customer satisfaction rating is at the 88th percentile. What percentage of retail stores has higher customer satisfaction ratings than this store?
Unlock Deck
Unlock for access to all 188 flashcards in this deck.
Unlock Deck
k this deck
75
The ages of five randomly chosen professors are 58, 61, 62, 69, and 44. Calculate the sample variance of these ages.
Unlock Deck
Unlock for access to all 188 flashcards in this deck.
Unlock Deck
k this deck
76
The total points scored by a basketball team for each game during its last season have been summarized in the table below. Identify the modal class of the distribution of scores.
Unlock Deck
Unlock for access to all 188 flashcards in this deck.
Unlock Deck
k this deck
77
The following data represent the scores of 50 students on a statistics exam. The mean score is 80.02, and the standard deviation is 11.9. What percentage of the scores lies within one standard deviation of the mean? two standard deviations of the mean? three standard deviations of the mean? Based on these percentages, do you believe that the distribution of scores is mound-shaped and symmetric? Explain.
Unlock Deck
Unlock for access to all 188 flashcards in this deck.
Unlock Deck
k this deck
78
The following data represent the scores of 50 students on a statistics exam. The mean score is 80.02, and the standard deviation is 11.9. Use the z-score method to identify potential outliers among the scores.
Unlock Deck
Unlock for access to all 188 flashcards in this deck.
Unlock Deck
k this deck
79
A sample of 100 e-mail users were asked whether their primary e-mail account was a free account, an institutional (school or work) account, or an account that they pay for personally. Identify the classes for the resulting data.
Unlock Deck
Unlock for access to all 188 flashcards in this deck.
Unlock Deck
k this deck
80
Parking at a university has become a problem. University administrators are interested in determining the average time it takes a student to find a parking spot. An administrator inconspicuously followed 190 students and recorded how long it took each of them to find a parking spot. The times had a distribution that was skewed to the left. Based on this information, discuss the relationship between the mean and the median for the 190 times collected.
Unlock Deck
Unlock for access to all 188 flashcards in this deck.
Unlock Deck
k this deck
Unlock Deck
Unlock for access to all 188 flashcards in this deck.


