Deck 10: Analysis of Variance: Comparing More Than Two Means
Full screen (f)
Question
Question
Question
Question
Question
Question
Question
Question
Question
Question
Question
Question
Question
Question
Question
Question
Question
Question
Question
Question
Question
Complete the ANOVA table. 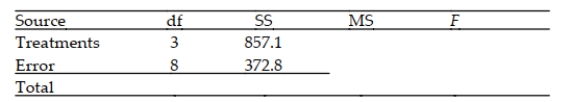
Question
Question
Question
A multiple-comparison procedure for comparing four treatment means produced the confidence intervals shown below. For each pair of means, indicate which mean is larger or indicate that there is no significant difference. 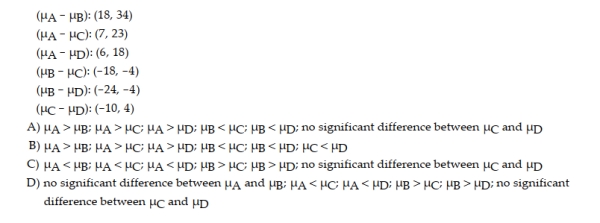
Question
Question
307 diamonds were sampled and randomly sorted into three groups of diamonds. These diamonds were randomly assigned to one of the three organizations, or groups (HRD, GIA, or IGI), that certify the appraisal of diamonds. A study was conducted to determine if the average size of diamonds reported by these three certification groups differ. A completely randomized design was used and the resulting ANOVA table is shown below. 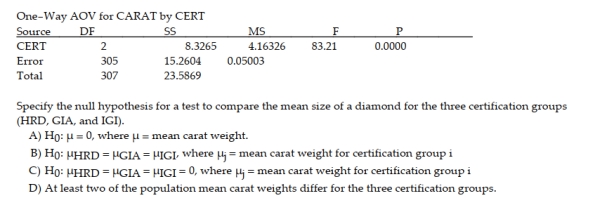
Question
Question
An industrial psychologist is investigating the effects of work environment on employee attitudes. A group of 20 recently hired sales trainees were randomly assigned to one of four different "home rooms"- five trainees per room. Each room is identical except for wall color. The four colors used were light green, light blue, gray, and red. The psychologist wants to know whether room color has an effect on attitude, and, if so, wants to compare the mean attitudes of the trainees assigned to the four room colors. At the end of the training program, the attitude of each trainee was measured on a 60-pt. scale (the lower the score, the poorer the attitude). The data was subjected to a one-way analysis of variance. 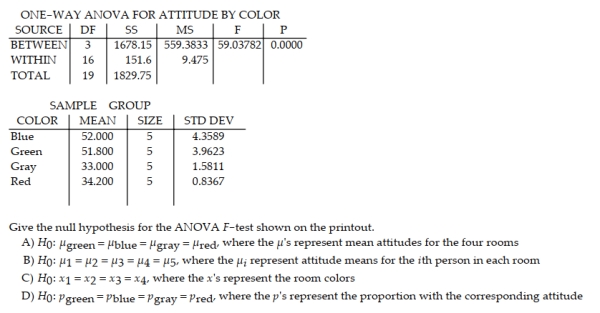
Question
A partially completed ANOVA table for a completely randomized design is shown here. 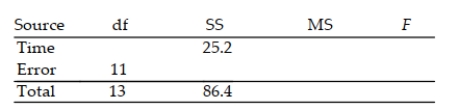 a. Complete the ANOVA table. b. How many treatments are involved in the experiment? c. Do the data provide sufficient evidence to indicate a difference among the population means? Test using α = .05.
a. Complete the ANOVA table. b. How many treatments are involved in the experiment? c. Do the data provide sufficient evidence to indicate a difference among the population means? Test using α = .05. Question
Question
Question
Question
In a completely randomized design experiment, 10 experimental units were randomly chosen for each of three treatment groups and a quantity was measured for each unit within each group. In the first steps of testing whether the means of the three groups are the same, the sum of squares for treatments was calculated to be 3,110 and the sum of squares for error was calculated to be 27,000. Complete the ANOVA table. 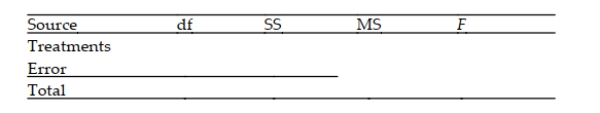
Question
Question
Question
Question
A company that employs a large number of salespeople is interested in learning which of the salespeople sell the most: those strictly on commission, those with a fixed salary, or those with a reduced fixed salary plus a commission. The previous month's records for a sample of salespeople are inspected and the amount of sales (in dollars) is recorded for each, as shown in the table. 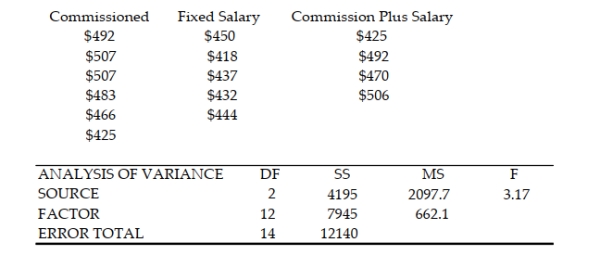 Test to determine if a difference exists in the mean sale amounts among the three compensation systems. Test using α = .025. 10.3 Multiple Comparisons of Means
Test to determine if a difference exists in the mean sale amounts among the three compensation systems. Test using α = .025. 10.3 Multiple Comparisons of Means Question
Four different leadership styles used by Big-Six accountants were investigated. As part of a designed study, 15 accountants were randomly selected from each of the four leadership style groups (a total of 60 accountants). Each accountant was asked to rate the degree to which their subordinates performed substandard field work on a 10-point scale-called the "substandard work scale". The objective is to compare the mean substandard work scales of the four leadership styles. The data on substandard work scales for all 60 observations were subjected to an analysis of variance. 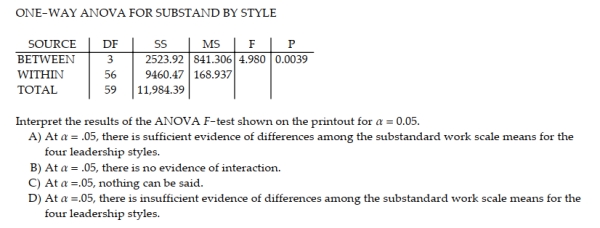
Question
A multiple-comparison procedure for comparing four treatment means produced the confidence intervals shown below. Rank the means from smallest to largest. Use solid lines to connect those means which are not significantly different. 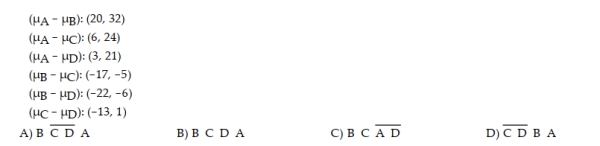
Question
Question
307 diamonds were sampled and randomly sorted into three groups of diamonds. These diamonds were randomly assigned to one of the three organizations, or groups (HRD, GIA, or IGI), that certify the appraisal of diamonds. A study was conducted to determine if the average size of diamonds reported by these three certification groups differ. A completely randomized design was used and the Bonferroni multiple comparison results are shown below. 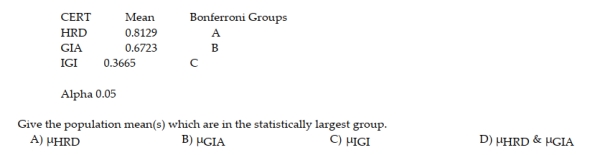
Question
Question
Question
Question
A multiple-comparison procedure for comparing four treatment means produced the confidence intervals shown below. For each pair of means, indicate which mean is larger or indicate that there is no significant difference. 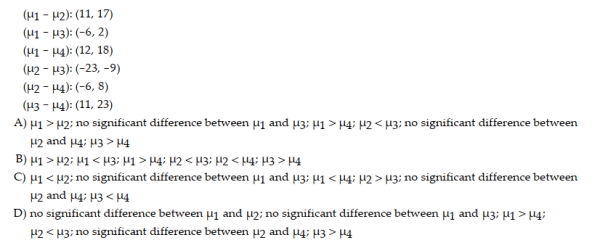
Question
Question
Question
A multiple-comparison procedure for comparing four treatment means produced the confidence intervals shown below. Rank the means from smallest to largest. Use solid lines to connect those means which are not significantly different. 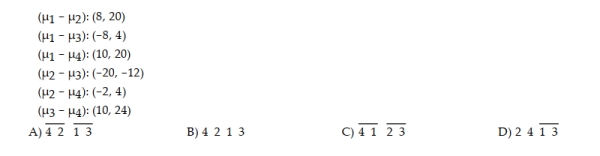
Question
Question
Question
Question
An economist is investigating the impact of today's economy on workers in the manufacturing industry who have been laid off. A sample of 50 workers was randomly selected from all workers in manufacturing that have been laid off in the past year. The following variables were measured for each laid off worker: length of time jobless (number of weeks) and tax status (single, married, or married/head of household). The data for the 50 workers were entered into the computer and analyzed to determine if the mean number of weeks jobless differed for the three tax status groups. The Tukey multiple comparison printout is shown below: 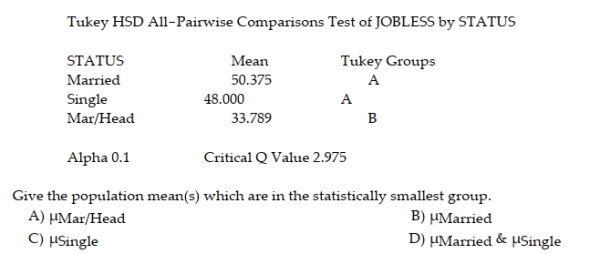
Question
Question
An appliance manufacturer is interested in determining whether the brand of laundry detergent used affects the average amount of dirt removed from standard household laundry loads. An experiment is set up in which 10 laundry loads are randomly assigned to each of four laundry detergents-Brands A, B, C, and D (a total of 40 loads in the experiment). The amount of dirt removed, y, (measured in milligrams) for each load is recorded and subjected to an ANOVA analysis, including a follow-up Tukey analysis. Which of the following inferences concerning the Tukey results below is incorrect? 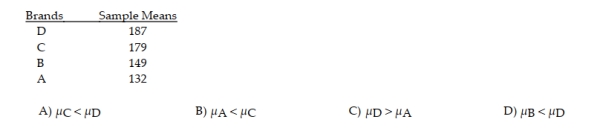
Question
Question
Question
The results of a Tukey multiple comparison are summarized below. 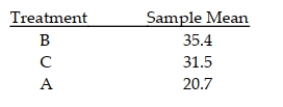 a. How many pairwise comparisons of the three treatments are there? b. Which treatments are significantly different from each other? c. Which treatments are not significantly different from each other? 10.4 The Randomized Block Design
a. How many pairwise comparisons of the three treatments are there? b. Which treatments are significantly different from each other? c. Which treatments are not significantly different from each other? 10.4 The Randomized Block Design Question
Question
Question
Question
Question
A market research firm is interested in the possible success of new flavors of ice cream. A study was conducted with three different flavorsꟷpeach, almond, and coconut. Three participants were given a sample of each ice cream, in random order, and asked to rate the flavors on a 100-point scale. The results are given in the table below. 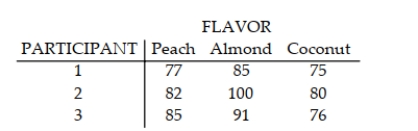 a. What is the purpose of blocking on participants in this study? b. Construct an ANOVA summary table using the information given. c. Is there sufficient evidence of a difference in the mean ratings for the three flavors? Use α = 0.05.
a. What is the purpose of blocking on participants in this study? b. Construct an ANOVA summary table using the information given. c. Is there sufficient evidence of a difference in the mean ratings for the three flavors? Use α = 0.05. Question
Question
Question
Question
Question
A study was conducted to test the effectiveness of supermarket sales strategies. At one supermarket, the price level (regular, reduced price, and at cost to supermarket) and display level (normal display space, normal display space plus end-of-aisle display, and twice the normal display space) were tested to determine if they had any effect on the weekly sales of a particular supermarket product. Each of the combinations of price level and display level were put in place for a randomly selected week and the weekly sales of the product was recorded. Each combination was used three times over the course of the experiment. The results of the study are shown here: 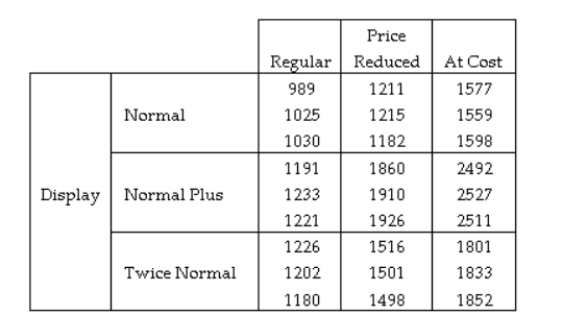 Identify the response variable used in this experiment.
A) The three price levels used by the supermarket.
B) The three display levels used by the supermarket.
C) The nine combinations of price level and display level used by the supermarket.
D) The weekly sales collected for each of the weeks. SHORT ANSWER. Write the word or phrase that best completes each statement or answers the question.
Identify the response variable used in this experiment.A) The three price levels used by the supermarket.
B) The three display levels used by the supermarket.
C) The nine combinations of price level and display level used by the supermarket.
D) The weekly sales collected for each of the weeks. SHORT ANSWER. Write the word or phrase that best completes each statement or answers the question.
Question
Question
Question
A beverage distributor wanted to determine the combination of advertising agency (two levels) and advertising medium (three levels) that would produce the largest increase in sales per advertising dollar. Each of the advertising agencies prepared ads as required for each of the media-- newspaper, radio, and television. Twelve small towns of roughly the same size were selected for the experiment, and two each were randomly assigned to receive an advertisement prepared and transmitted by each of the six agency-medium combinations. The dollar increases in sales per advertising dollar, based on a 1-month sales period, are shown in the table. 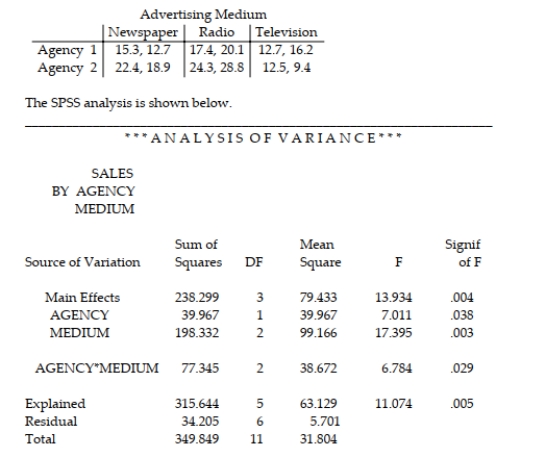 (Note: SPSS uses "Explained" instead of "Treatment" in the factorial analysis. Also, SPSS uses "Residual" instead of "Error.") Would you test the main effects factors, agency and medium, in this example? Explain why or why not.
(Note: SPSS uses "Explained" instead of "Treatment" in the factorial analysis. Also, SPSS uses "Residual" instead of "Error.") Would you test the main effects factors, agency and medium, in this example? Explain why or why not. Question
Question
A local consumer reporter wants to compare the average costs of grocery items purchased at three different supermarkets, A, B, and C. Prices (in dollars) were recorded for a sample of 60 randomly selected grocery items at each of the three supermarkets. In order to reduce item-to-item variation, the prices were recorded for each item on the same day at each supermarket. The results of the Bonferroni analysis are summarized below. ___________________ 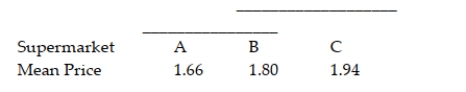 Fully interpret the Bonferroni analysis.
Fully interpret the Bonferroni analysis. Question
Question
Question
Question
Question
Question
A study was conducted to test the effectiveness of supermarket sales strategies. At one supermarket, the price level (regular, reduced price, and at cost to supermarket) and display level (normal display space, normal display space plus end-of-aisle display, and twice the normal display space) were tested to determine if they had any effect on the weekly sales of a particular supermarket product. Each of the combinations of price level and display level were put in place for a randomly selected week and the weekly sales of the product was recorded. Each combination was used three times over the course of the experiment. The results of the study are shown here: 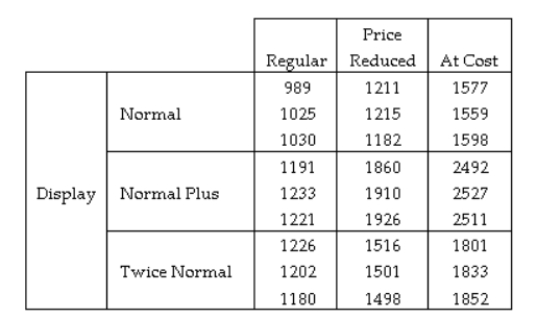 Identify the treatments used in this experiment.
A) The three price levels used by the supermarket.
B) The three display levels used by the supermarket.
C) The nine combinations of price level and display level used by the supermarket.
D) The weekly sales collected for each of the weeks.
Identify the treatments used in this experiment.A) The three price levels used by the supermarket.
B) The three display levels used by the supermarket.
C) The nine combinations of price level and display level used by the supermarket.
D) The weekly sales collected for each of the weeks.
Question
An experiment was conducted using a randomized block design. The data from the experiment are displayed in the following table. 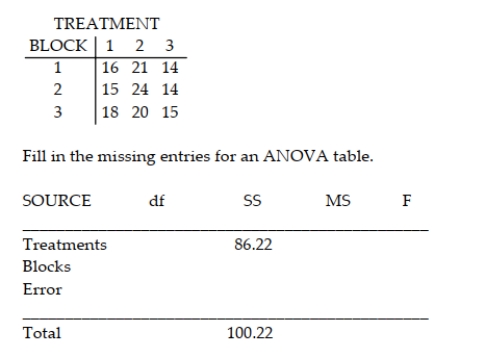
Question

Unlock Deck
Sign up to unlock the cards in this deck!
Unlock Deck
Unlock Deck
1/90
Play
Full screen (f)
Deck 10: Analysis of Variance: Comparing More Than Two Means
1
In a study to determine the least amount of time necessary to clean an SUV while maintaining a high quality standard, the owner of a chain of car washes designed an experiment where 20 employees were divided into four groups, each with five members. Each member of each group was assigned an SUV to clean within a certain time limit. The time limits for the groups were 20 minutes, 25 minutes, 30 minutes, and 35 minutes. After the time limits for each group had expired, the owner inspected each SUV and rated the quality of the cleaning job on a scale of 1 to 10. What are the possible values of the response variable?
A) the quality ratings: 1, 2, 3, 4, 5, 6, 7, 8, 9, 10
B) the time limits: 20 min, 25 min, 30 min, 35 min
C) the number of employees in each group: 5
D) the number of groups: 4
A) the quality ratings: 1, 2, 3, 4, 5, 6, 7, 8, 9, 10
B) the time limits: 20 min, 25 min, 30 min, 35 min
C) the number of employees in each group: 5
D) the number of groups: 4
A
2
A certain HMO is attempting to show the benefits of managed care to an insurance company. The HMO believes that certain types of doctors are more cost-effective than others. One theory is that certification level is an important factor in measuring the cost-effectiveness of physicians. To investigate this, the HMO obtained independent random samples of 30 physicians from each of the three certification levels- Board certified (C); Uncertified, board eligible (E); and Uncertified, board ineligible (I)- and recorded the total per-member, per-month charges for each (a total of 90 physicians). Identify the dependent (response) variable for this study.
A) the total per-member, per-month charge
B) the three certifications groups- C, E, and I
C) the 90 physicians
D) the HMO
A) the total per-member, per-month charge
B) the three certifications groups- C, E, and I
C) the 90 physicians
D) the HMO
A
3
A certain HMO is attempting to show the benefits of managed health care to an insurance company. The HMO believes that certain types of doctors are more cost-effective than others. One theory is that primary specialty is an important factor in measuring the cost-effectiveness of physicians. To investigate this, the HMO obtained independent random samples of 26 HMO physicians from each of four primary specialties-- General Practice (GP), Internal Medicine (IM), Pediatrics (PED), and Family Physician (FP)-- and recorded the total per-member, per-month charges for each. Identify the treatments for this group.
A) the four specialty groups-GP, IM, PED, and FP
B) the total per-member, per-month charges
C) the 104 physicians
D) the HMO
A) the four specialty groups-GP, IM, PED, and FP
B) the total per-member, per-month charges
C) the 104 physicians
D) the HMO
A
4
An advertising firm conducts 7 different campaigns, each in 14 different cities, to promote a certain product, and tracks the product sales attributable to each campaign in each city. Determine whether the study is observational or designed.
A) designed
B) observational
A) designed
B) observational
Unlock Deck
Unlock for access to all 90 flashcards in this deck.
Unlock Deck
k this deck
5
The variable measured in the study is called __________.
A) the response variable
B) a sampling unit
C) the treatment
D) the factor level
A) the response variable
B) a sampling unit
C) the treatment
D) the factor level
Unlock Deck
Unlock for access to all 90 flashcards in this deck.
Unlock Deck
k this deck
6
In a study to determine the least amount of time necessary to clean an SUV while maintaining a high quality standard, the owner of a chain of car washes designed an experiment where 20 employees were divided into four groups, each with five members. Each member of each group was assigned an SUV to clean within a certain time limit. The time limits for the groups were 20 minutes, 25 minutes, 30 minutes, and 35 minutes. After the time limits for each group had expired, the owner inspected each SUV and rated the quality of the cleaning job on a scale of 1 to 10. What are the factor levels for this study?
A) the time limits: 20 min, 25 min, 30 min, 35 min
B) the quality ratings: 1, 2, 3, 4, 5, 6, 7, 8, 9, 10
C) the number of employees in each group: 5
D) the number of groups: 4
A) the time limits: 20 min, 25 min, 30 min, 35 min
B) the quality ratings: 1, 2, 3, 4, 5, 6, 7, 8, 9, 10
C) the number of employees in each group: 5
D) the number of groups: 4
Unlock Deck
Unlock for access to all 90 flashcards in this deck.
Unlock Deck
k this deck
7
Define the statistical term "treatments."
A) combinations of factor-levels employed in a designed study
B) correlations among the factors used in an analysis of variance
C) objects on which the responses are measured
D) assumptions that are satisfied exactly
A) combinations of factor-levels employed in a designed study
B) correlations among the factors used in an analysis of variance
C) objects on which the responses are measured
D) assumptions that are satisfied exactly
Unlock Deck
Unlock for access to all 90 flashcards in this deck.
Unlock Deck
k this deck
8
__________ is a particular combination of levels of the factors involved in a study.
A) A treatment
B) The sampling design
C) The factor level
D) An analysis of variance
A) A treatment
B) The sampling design
C) The factor level
D) An analysis of variance
Unlock Deck
Unlock for access to all 90 flashcards in this deck.
Unlock Deck
k this deck
9
Find the following: P(F > 2.52), for v1 = 3, v2 = 14
A) 0.1
B) 0.90
C) 0.85
D) 0.05
A) 0.1
B) 0.90
C) 0.85
D) 0.05
Unlock Deck
Unlock for access to all 90 flashcards in this deck.
Unlock Deck
k this deck
10
A certain HMO is attempting to show the benefits of managed care to an insurance company. The HMO believes that certain types of doctors are more cost-effective than others. One theory is that certification level is an important factor in measuring the cost-effectiveness of physicians. To investigate this, the HMO obtained independent random samples of 21 physicians from each of the three certification levels-Board certified (C); Uncertified, board eligible (E); and Uncertified, board ineligible (I)- and recorded the total per member per month charges for each (a total of 63 physicians). How many factors are present in this study?
A) 1
B) 3
C) 63
D) 21
A) 1
B) 3
C) 63
D) 21
Unlock Deck
Unlock for access to all 90 flashcards in this deck.
Unlock Deck
k this deck
11
A scientist is hoping to compare the mean levels of DDT toxin found in three species of fish in a local river. He randomly samples 50 of each species to use in the analysis. For each fish, he measures the amount of DDT toxin present. Ideally he will be able to rank the species based on the mean level of toxin found in each of the three species. How many factors are present in this study?
A) 50
B) 3
C) 1
D) 6
A) 50
B) 3
C) 1
D) 6
Unlock Deck
Unlock for access to all 90 flashcards in this deck.
Unlock Deck
k this deck
12
A scientist is hoping to compare the mean levels of DDT toxin found in three species of fish in a local river. He randomly samples 50 of each species to use in the analysis. For each fish, he measures the amount of DDT toxin present. Ideally he will be able to rank the species based on the mean level of toxin found in each of the three species. Identify the treatments for this study.
A) The 50 fish
B) The amount of DDT in a fish
C) The scientist
D) The three fish species
A) The 50 fish
B) The amount of DDT in a fish
C) The scientist
D) The three fish species
Unlock Deck
Unlock for access to all 90 flashcards in this deck.
Unlock Deck
k this deck
13
Use the appropriate table to find the following F value: F0.025,
A) 3.89
B) 8.66
C) 3.80
D) 4.15
A) 3.89
B) 8.66
C) 3.80
D) 4.15
Unlock Deck
Unlock for access to all 90 flashcards in this deck.
Unlock Deck
k this deck
14
An industrial psychologist is investigating the effects of work environment on employee attitudes. A group of 12 recently hired sales trainees were randomly assigned to one of 3 different "home rooms" - four trainees per room. Each room is identical except for wall color, with 3 different colors used. The psychologist wants to know whether room color has an effect on attitude, and, if so, wants to compare the mean attitudes of the trainees assigned to the 3 room colors. At the end of the training program, the attitude of each trainee was measured on a 100-pt. scale (the lower the score, the poorer the attitude). How many treatments are in this study?
A) 3
B) 12
C) 4
D) 100
A) 3
B) 12
C) 4
D) 100
Unlock Deck
Unlock for access to all 90 flashcards in this deck.
Unlock Deck
k this deck
15
A city monitors ozone levels monthly over a 7 year period in order to relate the ozone levels to the seasons. Determine whether the study is observational or designed.
A) observational
B) designed
A) observational
B) designed
Unlock Deck
Unlock for access to all 90 flashcards in this deck.
Unlock Deck
k this deck
16
The intensity of a factor is called __________.
A) a factor level
B) the experimental unit
C) the design
D) the treatment
A) a factor level
B) the experimental unit
C) the design
D) the treatment
Unlock Deck
Unlock for access to all 90 flashcards in this deck.
Unlock Deck
k this deck
17
A scientist is hoping to compare the mean levels of DDT toxin found in three species of fish in a local river. He randomly samples 50 of each species to use in the analysis. For each fish, he measures the amount of DDT toxin present. Ideally he will be able to rank the species based on the mean level of toxin found in each of the three species. Identify the response variable in this study.
A) The three fish species
B) The amount of DDT in a fish
C) The scientist
D) The number of fish
A) The three fish species
B) The amount of DDT in a fish
C) The scientist
D) The number of fish
Unlock Deck
Unlock for access to all 90 flashcards in this deck.
Unlock Deck
k this deck
18
The variables, quantitative or qualitative, whose effect on a response variable is of interest are called __________.
A) factors
B) the factor level
C) the treatments
D) the experimental units
A) factors
B) the factor level
C) the treatments
D) the experimental units
Unlock Deck
Unlock for access to all 90 flashcards in this deck.
Unlock Deck
k this deck
19
A counselor obtains SAT averages for incoming freshmen each year for a period covering 19 years, with the objective of determining the relationship between the SAT score and the year the test was given. The averages are then subjected to analysis for the purpose of drawing a conclusion regarding a trend. Determine whether the study is observational or designed.
A) observational
B) designed
A) observational
B) designed
Unlock Deck
Unlock for access to all 90 flashcards in this deck.
Unlock Deck
k this deck
20
Find the following:
A) 0.975
B) 0.025
C) 0.9875
D) 0.0125
A) 0.975
B) 0.025
C) 0.9875
D) 0.0125
Unlock Deck
Unlock for access to all 90 flashcards in this deck.
Unlock Deck
k this deck
21
Complete the ANOVA table.
Unlock Deck
Unlock for access to all 90 flashcards in this deck.
Unlock Deck
k this deck
22
A certain HMO is attempting to show the benefits of managed care to an insurance company. The HMO believes that certain types of doctors are more cost-effective than others. One theory is that certification level is an important factor in measuring the cost-effectiveness of physicians. To investigate this, the HMO obtained independent random samples of 25 physicians from each of the three certification levels-Board certified (C); Uncertified, board eligible (E); and Uncertified, board ineligible (I)-and recorded the total per-member, per-month charges for each (a total of 25 physicians). In order to compare the mean charges for the three groups, the data will be subjected to an analysis of variance. Write the null hypothesis tested by the ANOVA.
A) H0: μC = μE = μI
B) H0: β1 = β2 = β3 = 0
C) H0: μC = μE = μI = 0
D)H0: p1 = p2 = p3
A) H0: μC = μE = μI
B) H0: β1 = β2 = β3 = 0
C) H0: μC = μE = μI = 0
D)H0: p1 = p2 = p3
Unlock Deck
Unlock for access to all 90 flashcards in this deck.
Unlock Deck
k this deck
23
A certain HMO is attempting to show the benefits of managed care to an insurance company. The HMO believes that certain types of doctors are more cost-effective than others. One theory is that certification level is an important factor in measuring the cost-effectiveness of physicians. To investigate this, the HMO obtained independent random samples of 29 physicians from each of the three certification levels-Board certified (C); Uncertified, board eligible (E); and Uncertified, board ineligible (I)-and recorded the total per-member, per-month charges for each (a total of 87 physicians). In order to compare the mean charges for the three groups, the data will be subjected to an analysis of variance. Give the degrees of freedom appropriate for conducting the ANOVA F-test.
A) numerator df = 2, denominator df = 84
B) numerator df = 3, denominator df = 84
C) numerator df = 85, denominator df = 2
D) numerator df = 85, denominator df = 3
A) numerator df = 2, denominator df = 84
B) numerator df = 3, denominator df = 84
C) numerator df = 85, denominator df = 2
D) numerator df = 85, denominator df = 3
Unlock Deck
Unlock for access to all 90 flashcards in this deck.
Unlock Deck
k this deck
24
A multiple-comparison procedure for comparing four treatment means produced the confidence intervals shown below. For each pair of means, indicate which mean is larger or indicate that there is no significant difference.
Unlock Deck
Unlock for access to all 90 flashcards in this deck.
Unlock Deck
k this deck
25
Given that the sum of squares for treatments (SST) for an ANOVA F-test is 9,000 and there are four total treatments, find the mean square for treatments (MST).
A) 3,000
B) 2,250
C) 1,800
D) 1,500
A) 3,000
B) 2,250
C) 1,800
D) 1,500
Unlock Deck
Unlock for access to all 90 flashcards in this deck.
Unlock Deck
k this deck
26
307 diamonds were sampled and randomly sorted into three groups of diamonds. These diamonds were randomly assigned to one of the three organizations, or groups (HRD, GIA, or IGI), that certify the appraisal of diamonds. A study was conducted to determine if the average size of diamonds reported by these three certification groups differ. A completely randomized design was used and the resulting ANOVA table is shown below.
Unlock Deck
Unlock for access to all 90 flashcards in this deck.
Unlock Deck
k this deck
27
Find the critical value F0 for a one-tailed test using α = 0.05, with 8 numerator degrees of freedom and 15 denominator degrees of freedom
A) 4.10
B) 3.20
C) 2.64
D) 3.22
A) 4.10
B) 3.20
C) 2.64
D) 3.22
Unlock Deck
Unlock for access to all 90 flashcards in this deck.
Unlock Deck
k this deck
28
An industrial psychologist is investigating the effects of work environment on employee attitudes. A group of 20 recently hired sales trainees were randomly assigned to one of four different "home rooms"- five trainees per room. Each room is identical except for wall color. The four colors used were light green, light blue, gray, and red. The psychologist wants to know whether room color has an effect on attitude, and, if so, wants to compare the mean attitudes of the trainees assigned to the four room colors. At the end of the training program, the attitude of each trainee was measured on a 60-pt. scale (the lower the score, the poorer the attitude). The data was subjected to a one-way analysis of variance.
Unlock Deck
Unlock for access to all 90 flashcards in this deck.
Unlock Deck
k this deck
29
A partially completed ANOVA table for a completely randomized design is shown here. a. Complete the ANOVA table. b. How many treatments are involved in the experiment? c. Do the data provide sufficient evidence to indicate a difference among the population means? Test using α = .05.
a. Complete the ANOVA table. b. How many treatments are involved in the experiment? c. Do the data provide sufficient evidence to indicate a difference among the population means? Test using α = .05. Unlock Deck
Unlock for access to all 90 flashcards in this deck.
Unlock Deck
k this deck
30
Given that the mean square for treatments (MST) for an ANOVA F-test is 5,000 and the mean square for error (MSE) is 3,750, find the value of the test statistic F.
A) 1.33
B) 1.25
C) .800
D) .750
A) 1.33
B) 1.25
C) .800
D) .750
Unlock Deck
Unlock for access to all 90 flashcards in this deck.
Unlock Deck
k this deck
31
307 diamonds were sampled and randomly sorted into three groups of diamonds. These diamonds were randomly assigned to one of the three organizations, or groups (HRD, GIA, or IGI), that certify the appraisal of diamonds. A study was conducted to determine if the average size of diamonds reported by these three certification groups differ. A completely randomized design was used and the resulting ANOVA table is shown below. Give a practical conclusion for the test in the words of the problem. Use ? = 0.10 to make your conclusion.
A) There is sufficient evidence to indicate that the mean carat weight for the HRD group equals the mean carat weight for the IGI group.
B) There is insufficient evidence to indicate that differences exist among the mean carat weights for the three certification groups.
C) There is sufficient evidence to indicate that differences exist among the mean carat weights for the three certification groups.
D) There is sufficient evidence to indicate that the mean carat weight for the GIA group is lower than the other two groups.
Unlock Deck
Unlock for access to all 90 flashcards in this deck.
Unlock Deck
k this deck
32
Which of the following is not a condition required for a valid ANOVA F-test for a completely randomized experiment?
A) The sample chosen from each of the populations is sufficiently large.
B) The variances of all the sampled populations are equal.
C) The sampled populations all have distributions that are approximately normal.
D) The samples are chosen from each population in an independent manner.
A) The sample chosen from each of the populations is sufficiently large.
B) The variances of all the sampled populations are equal.
C) The sampled populations all have distributions that are approximately normal.
D) The samples are chosen from each population in an independent manner.
Unlock Deck
Unlock for access to all 90 flashcards in this deck.
Unlock Deck
k this deck
33
In a completely randomized design experiment, 10 experimental units were randomly chosen for each of three treatment groups and a quantity was measured for each unit within each group. In the first steps of testing whether the means of the three groups are the same, the sum of squares for treatments was calculated to be 3,110 and the sum of squares for error was calculated to be 27,000. Complete the ANOVA table.
Unlock Deck
Unlock for access to all 90 flashcards in this deck.
Unlock Deck
k this deck
34
Find the critical value F0 for a one-tailed test using α = 0.05, d.f.N = 6, and d.f.D = 16.
A) 2.74
B) 3.94
C) 2.66
D) 2.19
A) 2.74
B) 3.94
C) 2.66
D) 2.19
Unlock Deck
Unlock for access to all 90 flashcards in this deck.
Unlock Deck
k this deck
35
307 diamonds were sampled and randomly sorted into three groups of diamonds. These diamonds were randomly assigned to one of the three organizations, or groups (HRD, GIA, or IGI), that certify the appraisal of diamonds. A study was conducted to determine if the average size of diamonds reported by these three certification groups differ. A completely randomized design was used and the resulting ANOVA table is shown below. Find the F-value that is missing in the ANOVA table.
A) 83.215
B) 0.0120
C) 0.5000
D) 0.5242
A) 83.215
B) 0.0120
C) 0.5000
D) 0.5242
Unlock Deck
Unlock for access to all 90 flashcards in this deck.
Unlock Deck
k this deck
36
A certain HMO is attempting to show the benefits of managed care to an insurance company. The HMO believes that certain types of doctors are more cost-effective than others. One theory is that certification level is an important factor in measuring the cost-effectiveness of physicians. To investigate this, the HMO obtained independent random samples of 20 physicians from each of the three certification levels- Board certified (C); Uncertified, board eligible (E); and Uncertified, board ineligible (I)-and recorded the total per member per month charges for each (a total of 60 physicians). In order to compare the mean charges for the three groups, the data were subjected to an analysis of variance. The results of the ANOVA are summarized in the following table. Take ? = 0.01 Interpret the p-value of the ANOVA F-test.
A) The means of the total per member per month charges for the three groups of physicians differ at ? = .01.
B) The model is not statistically useful (at ? = .01) for prediction purposes.
C) The variances of the total per number per month charges for the three groups of physicians differ at ? = .01.
D) The means of the total per member per month charges for the three groups of physicians are equal at ? = .01.
Unlock Deck
Unlock for access to all 90 flashcards in this deck.
Unlock Deck
k this deck
37
A company that employs a large number of salespeople is interested in learning which of the salespeople sell the most: those strictly on commission, those with a fixed salary, or those with a reduced fixed salary plus a commission. The previous month's records for a sample of salespeople are inspected and the amount of sales (in dollars) is recorded for each, as shown in the table. Test to determine if a difference exists in the mean sale amounts among the three compensation systems. Test using α = .025. 10.3 Multiple Comparisons of Means
Test to determine if a difference exists in the mean sale amounts among the three compensation systems. Test using α = .025. 10.3 Multiple Comparisons of Means Unlock Deck
Unlock for access to all 90 flashcards in this deck.
Unlock Deck
k this deck
38
Four different leadership styles used by Big-Six accountants were investigated. As part of a designed study, 15 accountants were randomly selected from each of the four leadership style groups (a total of 60 accountants). Each accountant was asked to rate the degree to which their subordinates performed substandard field work on a 10-point scale-called the "substandard work scale". The objective is to compare the mean substandard work scales of the four leadership styles. The data on substandard work scales for all 60 observations were subjected to an analysis of variance.
Unlock Deck
Unlock for access to all 90 flashcards in this deck.
Unlock Deck
k this deck
39
A multiple-comparison procedure for comparing four treatment means produced the confidence intervals shown below. Rank the means from smallest to largest. Use solid lines to connect those means which are not significantly different.
Unlock Deck
Unlock for access to all 90 flashcards in this deck.
Unlock Deck
k this deck
40
Given that the sum of squares for error (SSE) for an ANOVA F-test is 12,000 and there are 40 total experimental units with eight total treatments, find the mean square for error (MSE).
A) 375
B) 300
C) 308
D) 400
A) 375
B) 300
C) 308
D) 400
Unlock Deck
Unlock for access to all 90 flashcards in this deck.
Unlock Deck
k this deck
41
307 diamonds were sampled and randomly sorted into three groups of diamonds. These diamonds were randomly assigned to one of the three organizations, or groups (HRD, GIA, or IGI), that certify the appraisal of diamonds. A study was conducted to determine if the average size of diamonds reported by these three certification groups differ. A completely randomized design was used and the Bonferroni multiple comparison results are shown below.
Unlock Deck
Unlock for access to all 90 flashcards in this deck.
Unlock Deck
k this deck
42
The __________ in a designed experiment to compare k means is the probability of making at least one Type I error in a series of inferences about the population means, based on (1 - α) 100% confidence intervals.
Unlock Deck
Unlock for access to all 90 flashcards in this deck.
Unlock Deck
k this deck
43
A certain HMO is attempting to show the benefits of managed health care to an insurance company. The HMO believes that certain types of doctors are more cost-effective than others. One theory is that primary specialty is an important factor in measuring the cost-effectiveness of physicians. To investigate this, the HMO obtained independent random samples of 20 HMO physicians from each of four primary specialties-General Practice (GP), Internal Medicine (IM), Pediatrics (PED), and Family Physician (FP) ? and recorded the total per-member, per-month charges for each. In order to compare the mean charges for the four specialty groups, the data were be subjected to a one-way analysis of variance. The results of the Tukey analysis are summarized below. Which primary specialties have significantly lower mean charges than Internal Medicine (IM)?
A) PED
B) PED and FP
C) PED, FP, and GP
D) none
A) PED
B) PED and FP
C) PED, FP, and GP
D) none
Unlock Deck
Unlock for access to all 90 flashcards in this deck.
Unlock Deck
k this deck
44
An article in a journal examined the attitudes of three groups of professionals on the condition of the environment, and quantified their responses on a seven-point scale (1 = no problem to 7 = disaster very likely). The mean scores for the groups are: A: 3.60 , B: 3.32 , and C: 3.29 . Using an experimentalwise error rate of α = .05, Tukey's minimum significance for comparing means is 0.27. Use this information to conduct a multiple comparisons of the means.
A) The highest mean differs significantly from the other two, but there is no significant difference in the other two means.
B) All means are significantly different.
C) There is no significant difference in any of the means.
D) The lowest mean differs significantly from the other two, but there is no significant difference in the other two means.
Unlock Deck
Unlock for access to all 90 flashcards in this deck.
Unlock Deck
k this deck
45
A multiple-comparison procedure for comparing four treatment means produced the confidence intervals shown below. For each pair of means, indicate which mean is larger or indicate that there is no significant difference.
Unlock Deck
Unlock for access to all 90 flashcards in this deck.
Unlock Deck
k this deck
46
Which procedure was specifically developed for pairwise comparisons when the sample sizes of the treatments are equal?
A) Tukey
B) Bonferroni
C) Scheffé
D) ANOVA
A) Tukey
B) Bonferroni
C) Scheffé
D) ANOVA
Unlock Deck
Unlock for access to all 90 flashcards in this deck.
Unlock Deck
k this deck
47
In an experiment with 10 treatments, how many pairs of means can be compared?
A) 45
B) 90
C) 20
D) 100
A) 45
B) 90
C) 20
D) 100
Unlock Deck
Unlock for access to all 90 flashcards in this deck.
Unlock Deck
k this deck
48
A multiple-comparison procedure for comparing four treatment means produced the confidence intervals shown below. Rank the means from smallest to largest. Use solid lines to connect those means which are not significantly different.
Unlock Deck
Unlock for access to all 90 flashcards in this deck.
Unlock Deck
k this deck
49
Which of the following is not one of the multiple comparison method options available to compare treatment means?
A) The Tukey Method
B) The Bonferroni Method
C) The Scheffe Method
D) The Einstein Method
A) The Tukey Method
B) The Bonferroni Method
C) The Scheffe Method
D) The Einstein Method
Unlock Deck
Unlock for access to all 90 flashcards in this deck.
Unlock Deck
k this deck
50
A local consumer reporter wants to compare the average costs of grocery items purchased at three different supermarkets, A, B, and C. Prices (in dollars) were recorded for a sample of 60 randomly selected grocery items at each of the three supermarkets. In order to reduce item-to-item variation, the prices were recorded for each item on the same day at each supermarket. Identify the treatments for this experiment.
A) the three supermarkets
B) the 60 grocery items
C) the 60 × 3 = 180 prices
D) the day on which the data were collected
A) the three supermarkets
B) the 60 grocery items
C) the 60 × 3 = 180 prices
D) the day on which the data were collected
Unlock Deck
Unlock for access to all 90 flashcards in this deck.
Unlock Deck
k this deck
51
Consider a completely randomized design with k treatments. Assume all pairwise comparisons of treatment means are to be made using a multiple comparisons procedure. Determine the total number of treatment means to be compared for the value k = 8.
A) 28
B) 8
C) 36
D) 16
A) 28
B) 8
C) 36
D) 16
Unlock Deck
Unlock for access to all 90 flashcards in this deck.
Unlock Deck
k this deck
52
An economist is investigating the impact of today's economy on workers in the manufacturing industry who have been laid off. A sample of 50 workers was randomly selected from all workers in manufacturing that have been laid off in the past year. The following variables were measured for each laid off worker: length of time jobless (number of weeks) and tax status (single, married, or married/head of household). The data for the 50 workers were entered into the computer and analyzed to determine if the mean number of weeks jobless differed for the three tax status groups. The Tukey multiple comparison printout is shown below:
Unlock Deck
Unlock for access to all 90 flashcards in this deck.
Unlock Deck
k this deck
53
Four brands of baseball bats were tested to determine which bat allowed hitters to hit a baseball farthest. Eight different batters were thrown 25 pitches while hitting with each of the four bats (assigned in random order). The average distance of the five longest hits using each bat is shown in the table below. The goal is to determine if the average hit distance differs for the four brands of baseball bats. Identify the response variable in this experiment.
A) A batter
B) The brand of baseball
C) The average distance hit
D) The brand of bat
A) A batter
B) The brand of baseball
C) The average distance hit
D) The brand of bat
Unlock Deck
Unlock for access to all 90 flashcards in this deck.
Unlock Deck
k this deck
54
An appliance manufacturer is interested in determining whether the brand of laundry detergent used affects the average amount of dirt removed from standard household laundry loads. An experiment is set up in which 10 laundry loads are randomly assigned to each of four laundry detergents-Brands A, B, C, and D (a total of 40 loads in the experiment). The amount of dirt removed, y, (measured in milligrams) for each load is recorded and subjected to an ANOVA analysis, including a follow-up Tukey analysis. Which of the following inferences concerning the Tukey results below is incorrect?
Unlock Deck
Unlock for access to all 90 flashcards in this deck.
Unlock Deck
k this deck
55
Which method generally produces wider confidence intervals?
A) Scheffé
B) Bonferroni
C) Tukey
D) ANOVA
A) Scheffé
B) Bonferroni
C) Tukey
D) ANOVA
Unlock Deck
Unlock for access to all 90 flashcards in this deck.
Unlock Deck
k this deck
56
Consider a completely randomized design with five treatments. How many pairwise comparisons of treatments are made in a Bonferroni analysis?
A) 10
B) 5! = 120
C) 20
D) 5
A) 10
B) 5! = 120
C) 20
D) 5
Unlock Deck
Unlock for access to all 90 flashcards in this deck.
Unlock Deck
k this deck
57
The results of a Tukey multiple comparison are summarized below. a. How many pairwise comparisons of the three treatments are there? b. Which treatments are significantly different from each other? c. Which treatments are not significantly different from each other? 10.4 The Randomized Block Design
a. How many pairwise comparisons of the three treatments are there? b. Which treatments are significantly different from each other? c. Which treatments are not significantly different from each other? 10.4 The Randomized Block Design Unlock Deck
Unlock for access to all 90 flashcards in this deck.
Unlock Deck
k this deck
58
An experiment was conducted to compare the mean iron content in iron ore pieces determined by three different methods: (1) mechanical, (2) manual, and (3) laser. Five 1-meter long pieces of iron ore were removed from a conveyor belt, and the iron content of each piece was determined using each of the three methods. The data are shown below. How should the data be analyzed?
A) randomized block design with three treatments and five blocks
B) randomized block design with five treatments and three blocks
C) completely randomized design with three treatments
D) 3 × 5 factorial design
A) randomized block design with three treatments and five blocks
B) randomized block design with five treatments and three blocks
C) completely randomized design with three treatments
D) 3 × 5 factorial design
Unlock Deck
Unlock for access to all 90 flashcards in this deck.
Unlock Deck
k this deck
59
Four brands of baseball bats were tested to determine which bat allowed hitters to hit a baseball farthest. Eight different batters were thrown 25 pitches while hitting with each of the four bats (assigned in random order). The average distance of the five longest hits using each bat is shown in the table below. The goal is to determine if the average hit distance differs for the four brands of baseball bats. How should the data be analyzed?
A) Randomized block design with eight treatments and four blocks
B) Randomized block design with four treatments and eight blocks
C) Completely randomized design with four treatments
D) 4 × 8 factorial design
A) Randomized block design with eight treatments and four blocks
B) Randomized block design with four treatments and eight blocks
C) Completely randomized design with four treatments
D) 4 × 8 factorial design
Unlock Deck
Unlock for access to all 90 flashcards in this deck.
Unlock Deck
k this deck
60
A local consumer reporter wants to compare the average costs of grocery items purchased at three different supermarkets, A, B, and C. Prices (in dollars) were recorded for a sample of 60 randomly selected grocery items at each of the three supermarkets. In order to reduce item-to-item variation, the prices were recorded for each item on the same day at each supermarket. Identify the dependent (response) variable for this experiment.
A) the prices of the grocery items
B) the grocery items
C) the supermarkets
D) the mean prices of the grocery items at each supermarket
A) the prices of the grocery items
B) the grocery items
C) the supermarkets
D) the mean prices of the grocery items at each supermarket
Unlock Deck
Unlock for access to all 90 flashcards in this deck.
Unlock Deck
k this deck
61
Four brands of baseball bats were tested to determine which bat allowed hitters to hit a baseball farthest. Eight different batters were thrown 25 pitches while hitting with each of the four bats (assigned in random order). The average distance of the five longest hits using each bat is shown in the table below. The goal is to determine if the average hit distance differs for the four brands of baseball bats. Based on the p-value for this test, make the proper conclusion about the treatments in this experiment.
A) There is sufficient evidence (at ? = 0.01) to indicate differences among the mean distances for the eight batters.
B) There is sufficient evidence (at ? = 0.01) to indicate differences among the mean distances for the four brands of baseball bats.
C) There is insufficient evidence (at ? = 0.01) to indicate differences among the mean distances for the eight batters.
D) There is insufficient evidence (at ? = 0.01) to indicate differences among the mean distances for the four brands of baseball bats.
Unlock Deck
Unlock for access to all 90 flashcards in this deck.
Unlock Deck
k this deck
62
A market research firm is interested in the possible success of new flavors of ice cream. A study was conducted with three different flavorsꟷpeach, almond, and coconut. Three participants were given a sample of each ice cream, in random order, and asked to rate the flavors on a 100-point scale. The results are given in the table below. a. What is the purpose of blocking on participants in this study? b. Construct an ANOVA summary table using the information given. c. Is there sufficient evidence of a difference in the mean ratings for the three flavors? Use α = 0.05.
a. What is the purpose of blocking on participants in this study? b. Construct an ANOVA summary table using the information given. c. Is there sufficient evidence of a difference in the mean ratings for the three flavors? Use α = 0.05. Unlock Deck
Unlock for access to all 90 flashcards in this deck.
Unlock Deck
k this deck
63
A local consumer reporter wants to compare the average costs of grocery items purchased at three different supermarkets, A, B, and C. Prices (in dollars) were recorded for a sample of 60 randomly selected grocery items at each of the three supermarkets. In order to reduce item-to-item variation, the prices were recorded for each item on the same day at each supermarket. The results of a Bonferroni analysis are summarized below. ___________
Interpret the Bonferroni analysis results.
A) A has a significantly smaller mean price than either of the other two supermarkets.
B) A has a significantly larger mean price than either of the other two supermarkets.
C) C has a significantly larger mean price than either of the other two supermarkets.
D) B and C have significantly different mean prices.
Unlock Deck
Unlock for access to all 90 flashcards in this deck.
Unlock Deck
k this deck
64
The goal of an experiment is to investigate the factors that affect visitor travel time in a complex, multilevel building on campus. Specifically, we want to determine whether the effect of directional aid (wall signs or map) on travel time depends on starting room location (interior or exterior). Three visitors were assigned to each of the combinations of directional aid and starting room location, and the travel times of each (in seconds) to reach the goal destination room were recorded. Explain how to properly analyze these data.
A) ANOVA F-test for interaction in a 2 x 2 factorial design with 3 replications
B) ANOVA F-test for a completely randomized design with four treatments
C) ANOVA F-test for a randomized block design with two treatments
D) Chi-square test for a 2 x 2 factorial design
A) ANOVA F-test for interaction in a 2 x 2 factorial design with 3 replications
B) ANOVA F-test for a completely randomized design with four treatments
C) ANOVA F-test for a randomized block design with two treatments
D) Chi-square test for a 2 x 2 factorial design
Unlock Deck
Unlock for access to all 90 flashcards in this deck.
Unlock Deck
k this deck
65
Suppose a company makes 3 different frozen dinners, and tests their ability to attract customers. They test the frozen dinners in 15 different stores in order to account for any extraneous sources of variation. The company records the number of customers who purchase each product at each store. What assumptions are necessary for the validity of the F statistic for comparing the response means of the 3 frozen dinners?
A) The probability distributions of observations corresponding to all the block-treatment combinations are normal, and the variances of all the probability distributions are equal.
B) The probability distributions of observations corresponding to all the block-treatment combinations are normal, and the sampling distributions of the variances of all the block-treatment combinations are
Normally distributed.
C) The means of the observations corresponding to all the block-treatment combinations are equal, and the variances of all the probability distributions are equal.
D) None. The Central Limit Theorem eliminates the need for any assumptions.
Unlock Deck
Unlock for access to all 90 flashcards in this deck.
Unlock Deck
k this deck
66
Four brands of baseball bats were tested to determine which bat allowed hitters to hit a baseball farthest. Eight different batters were thrown 25 pitches while hitting with each of the four bats (assigned in random order). The average distance of the five longest hits using each bat is shown in the table below. The goal is to determine if the average hit distance differs for the four brands of baseball bats. Identify the test statistic that should be used for testing whether the average distance hit for the four brands of baseball bats differ.
A) 39.7
B) 23.85
C) 57.55
D) 0.0000
A) 39.7
B) 23.85
C) 57.55
D) 0.0000
Unlock Deck
Unlock for access to all 90 flashcards in this deck.
Unlock Deck
k this deck
67
A study was conducted to test the effectiveness of supermarket sales strategies. At one supermarket, the price level (regular, reduced price, and at cost to supermarket) and display level (normal display space, normal display space plus end-of-aisle display, and twice the normal display space) were tested to determine if they had any effect on the weekly sales of a particular supermarket product. Each of the combinations of price level and display level were put in place for a randomly selected week and the weekly sales of the product was recorded. Each combination was used three times over the course of the experiment. The results of the study are shown here: Identify the response variable used in this experiment.
A) The three price levels used by the supermarket.
B) The three display levels used by the supermarket.
C) The nine combinations of price level and display level used by the supermarket.
D) The weekly sales collected for each of the weeks. SHORT ANSWER. Write the word or phrase that best completes each statement or answers the question.
Identify the response variable used in this experiment.A) The three price levels used by the supermarket.
B) The three display levels used by the supermarket.
C) The nine combinations of price level and display level used by the supermarket.
D) The weekly sales collected for each of the weeks. SHORT ANSWER. Write the word or phrase that best completes each statement or answers the question.
Unlock Deck
Unlock for access to all 90 flashcards in this deck.
Unlock Deck
k this deck
68
Suppose an experiment utilizing a random block design has 4 treatments and 10 blocks for a total of 40 observations. Assume that the total Sum of Squares for the response is SS(Total) = 300. If the Sum of Squares for Treatments (SST) is 20% of SS(Total), and the Sum of Squares for Blocks (SSB) is 40% of SS (Total), find the F values for this experiment.
A) treatments: F = 4.50; blocks: F = 3.00
B) treatments: F = 3.38; blocks: F = 2.70
C) treatments: F = 6.5; blocks: F = 4.33
D) treatments: F = 20.83; blocks: F = 6.94
A) treatments: F = 4.50; blocks: F = 3.00
B) treatments: F = 3.38; blocks: F = 2.70
C) treatments: F = 6.5; blocks: F = 4.33
D) treatments: F = 20.83; blocks: F = 6.94
Unlock Deck
Unlock for access to all 90 flashcards in this deck.
Unlock Deck
k this deck
69
A local consumer reporter wants to compare the average costs of grocery items purchased at three different supermarkets, A, B, and C. Prices (in dollars) were recorded for a sample of 60 randomly selected grocery items at each of the three supermarkets. In order to reduce item-to-item variation, the prices were recorded for each item on the same day at each supermarket. The results of the ANOVA test are summarized in the following table. What is the value of the test statistic for determining whether the three supermarkets have the same average prices?
A) 39.23
B) 0.0001
C) 108.54
D) 1.3206
A) 39.23
B) 0.0001
C) 108.54
D) 1.3206
Unlock Deck
Unlock for access to all 90 flashcards in this deck.
Unlock Deck
k this deck
70
A beverage distributor wanted to determine the combination of advertising agency (two levels) and advertising medium (three levels) that would produce the largest increase in sales per advertising dollar. Each of the advertising agencies prepared ads as required for each of the media-- newspaper, radio, and television. Twelve small towns of roughly the same size were selected for the experiment, and two each were randomly assigned to receive an advertisement prepared and transmitted by each of the six agency-medium combinations. The dollar increases in sales per advertising dollar, based on a 1-month sales period, are shown in the table. (Note: SPSS uses "Explained" instead of "Treatment" in the factorial analysis. Also, SPSS uses "Residual" instead of "Error.") Would you test the main effects factors, agency and medium, in this example? Explain why or why not.
(Note: SPSS uses "Explained" instead of "Treatment" in the factorial analysis. Also, SPSS uses "Residual" instead of "Error.") Would you test the main effects factors, agency and medium, in this example? Explain why or why not. Unlock Deck
Unlock for access to all 90 flashcards in this deck.
Unlock Deck
k this deck
71
A local consumer reporter wants to compare the average costs of grocery items purchased at three different supermarkets, A, B, and C. Prices (in dollars) were recorded for a sample of 60 randomly selected grocery items at each of the three supermarkets. In order to reduce item-to-item variation, the prices were recorded for each item on the same day at each supermarket. Identify the blocks for this experiment.
A) the 60 grocery items
B) the three supermarkets
C) the 60 × 3 = 180 prices
D) the day on which the data were collected
A) the 60 grocery items
B) the three supermarkets
C) the 60 × 3 = 180 prices
D) the day on which the data were collected
Unlock Deck
Unlock for access to all 90 flashcards in this deck.
Unlock Deck
k this deck
72
A local consumer reporter wants to compare the average costs of grocery items purchased at three different supermarkets, A, B, and C. Prices (in dollars) were recorded for a sample of 60 randomly selected grocery items at each of the three supermarkets. In order to reduce item-to-item variation, the prices were recorded for each item on the same day at each supermarket. The results of the Bonferroni analysis are summarized below. ___________________ Fully interpret the Bonferroni analysis.
Fully interpret the Bonferroni analysis. Unlock Deck
Unlock for access to all 90 flashcards in this deck.
Unlock Deck
k this deck
73
The randomized block design is an extension of the matched pairs comparison of μ1 and μ2.
Unlock Deck
Unlock for access to all 90 flashcards in this deck.
Unlock Deck
k this deck
74
A local consumer reporter wants to compare the average costs of grocery items purchased at three different supermarkets, A, B, and C. Prices (in dollars) were recorded for a sample of 60 randomly selected grocery items at each of the three supermarkets. In order to reduce item-to-item variation, the prices were recorded for each item on the same day at each supermarket. The results of the ANOVA are summarized in the following table. Based on the p-value of the test, make the proper conclusion.
A) There is sufficient evidence (at ? = .01) to indicate differences among the mean prices of grocery items at the three supermarkets.
B) There is insufficient evidence (at ? = .01) to indicate differences among the mean prices of grocery items at the three supermarkets.
C) There is sufficient evidence (at ? = .01) to indicate that the mean prices of grocery items at the three supermarkets are identical.
D) No conclusions can be drawn from the given information.
Unlock Deck
Unlock for access to all 90 flashcards in this deck.
Unlock Deck
k this deck
75
Four brands of baseball bats were tested to determine which bat allowed hitters to hit a baseball farthest. Eight different batters were thrown 25 pitches while hitting with each of the four bats (assigned in random order). The average distance of the five longest hits using each bat is shown in the table below. The goal is to determine if the average hit distance differs for the four brands of baseball bats. Find the F-value in the table above for testing whether the average distance hit for the four brands of baseball bats differ.
A) 39.7
B) 23.9
C) 2.8
D) 57.6
A) 39.7
B) 23.9
C) 2.8
D) 57.6
Unlock Deck
Unlock for access to all 90 flashcards in this deck.
Unlock Deck
k this deck
76
When a variable is identified as reducing variation in the response variable, but no additional knowledge concerning the variable is desired, it should be used as the blocking factor in the randomized block design.
Unlock Deck
Unlock for access to all 90 flashcards in this deck.
Unlock Deck
k this deck
77
Psychologists have found that people are generally reluctant to transmit bad news to their peers. This phenomenon has been named the "MUM effect." To investigate the cause of the MUM effect, undergraduates at a university participated in an experiment. Each subject was asked to administer an IQ test to another student and then provide the test taker with his or her percentile score. (Unknown to the subject, the test taker was a bogus student who was working with the researchers.) The experimenters manipulated two factors, subject visibility and success of test taker, each at two levels. Subject visibility was either visible or not visible to the test taker. Success of test taker was either top 20% or bottom 20%. Five subjects were randomly assigned to each of the 2 x 2 = 4 experimental conditions. Then the time (in seconds) between the end of the test and the delivery of the percentile score from the subject to the test taker was measured. (This variable is called the latency to feedback.) What type of experimental design was employed in this study?
A) 2 x 2 factorial design with 5 replications
B) completely randomized design with four treatments
C) randomized block design with four treatments and 5 blocks
D) 4 x 20 factorial design with no replications
A) 2 x 2 factorial design with 5 replications
B) completely randomized design with four treatments
C) randomized block design with four treatments and 5 blocks
D) 4 x 20 factorial design with no replications
Unlock Deck
Unlock for access to all 90 flashcards in this deck.
Unlock Deck
k this deck
78
A study was conducted to test the effectiveness of supermarket sales strategies. At one supermarket, the price level (regular, reduced price, and at cost to supermarket) and display level (normal display space, normal display space plus end-of-aisle display, and twice the normal display space) were tested to determine if they had any effect on the weekly sales of a particular supermarket product. Each of the combinations of price level and display level were put in place for a randomly selected week and the weekly sales of the product was recorded. Each combination was used three times over the course of the experiment. The results of the study are shown here: Identify the treatments used in this experiment.
A) The three price levels used by the supermarket.
B) The three display levels used by the supermarket.
C) The nine combinations of price level and display level used by the supermarket.
D) The weekly sales collected for each of the weeks.
Identify the treatments used in this experiment.A) The three price levels used by the supermarket.
B) The three display levels used by the supermarket.
C) The nine combinations of price level and display level used by the supermarket.
D) The weekly sales collected for each of the weeks.
Unlock Deck
Unlock for access to all 90 flashcards in this deck.
Unlock Deck
k this deck
79
An experiment was conducted using a randomized block design. The data from the experiment are displayed in the following table.
Unlock Deck
Unlock for access to all 90 flashcards in this deck.
Unlock Deck
k this deck
80
A certain HMO is attempting to show the benefits of managed health care to an insurance company. The HMO believes that certain types of doctors are more cost-effective than others. One theory is that both primary specialty and whether the physician is a foreign or USA medical school graduate are an important factors in measuring the cost-effectiveness of physicians. To investigate this, the president obtained independent random samples of 40 HMO physicians, half foreign graduates and half USA graduates, from each of four primary specialties?General Practice (GP), Internal Medicine (IM), Pediatrics (PED), and Family Physician (FP)?and recorded the total per-member, per-month charges for each. Thus, information on charges were obtained for a total of n = 160 doctors. The sample mean charges for each of the eight categories are shown in the table. What type of design was used for this experiment?
A) 4 x 2 factorial design with 20 replications
B) completely randomized design with eight treatments
C) completely randomized design with two treatments
D) 2 x 2 factorial design with 160 replications
A) 4 x 2 factorial design with 20 replications
B) completely randomized design with eight treatments
C) completely randomized design with two treatments
D) 2 x 2 factorial design with 160 replications
Unlock Deck
Unlock for access to all 90 flashcards in this deck.
Unlock Deck
k this deck
Unlock Deck
Unlock for access to all 90 flashcards in this deck.


