Deck 7: Inferences Based on a Single Sample: Estimation With Confidence Intervals
Full screen (f)
Question
Question
Question
Question
Question
Question
Question
Question
Question
Question
Question
Question
Question
Question
Question
Question
Question
Question
Question
Question
Question
Question
A random sample of 250 students at a university finds that these students take a mean of 15.6 credit hours per quarter with a standard deviation of 2.2 credit hours. Estimate the mean credit hours taken by a student each quarter using a 98% confidence interval. Round to the nearest thousandth. 
Question
The following data represent the scores of a sample of 50 randomly chosen students on a standardized test. 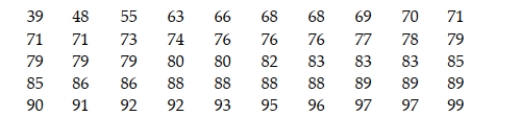 a. Write a 95% confidence interval for the mean score of all students who took the test. b. Identify the target parameter and the point estimator.
a. Write a 95% confidence interval for the mean score of all students who took the test. b. Identify the target parameter and the point estimator. Question
Question
Question
A random sample of n measurements was selected from a population with unknown mean μ and known standard deviation σ. Calculate a 95% confidence interval for μ for the given situation. Round to the nearest hundredth when necessary. 
Question
Question
Which information is not shown on the screen below? 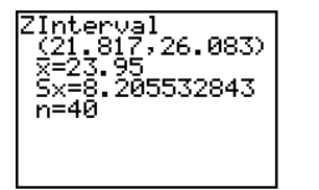
A) the confidence level
B) the sample mean
C) the sample standard deviation
D) the sample size
A) the confidence level
B) the sample mean
C) the sample standard deviation
D) the sample size
Question
Question
Question
Question
Question
Question
Question
Question
A random sample of n = 100 measurements was selected from a population with unknown mean μ and standard deviation σ. Calculate a 95% confidence interval if 
Question
Question
Question
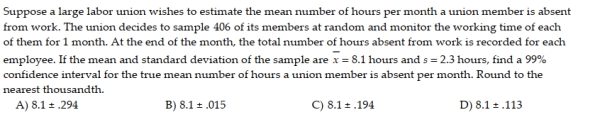
How much money does the average professional football fan spend on food at a single football game? That question was posed to 60 randomly selected football fans. The sampled results show that the sample mean was $70.00 and prior sampling indicated that the population standard deviation was $17.50. Use this information to create a 95 percent confidence interval for the population mean. 
Question
Question
Question

Question
How much money does the average professional football fan spend on food at a single football game? That question was posed to ten randomly selected football fans. The sampled results show that the sample mean and sample standard deviation were $70.00 and $17.50, respectively. Use this information to create a 95 percent confidence interval for the population mean. 
Question
Question
Question
Let t0 be a particular value of t. Find a value of 
Question
Fifteen SmartCars were randomly selected and the highway mileage of each was noted. The analysis yielded a mean of 47 miles per gallon and a standard deviation of 5 miles per gallon. Which of the following would represent a 90% confidence interval for the average highway mileage of all SmartCars? 
Question
Question
Question
Question
You are interested in purchasing a new car. One of the many points you wish to consider is the resale value of the car after 5 years. Since you are particularly interested in a certain foreign sedan, you decide to estimate the resale value of this car with a 99% confidence interval. You manage to obtain data on 17 recently resold 5-year-old foreign sedans of the same model. These 17 cars were resold at an average price of $12,380 with a standard deviation of $800. What is the 99% confidence interval for the true mean resale value of a 5- year-old car of this model? 
Question
How much money does the average professional football fan spend on food at a single football game? That question was posed to 10 randomly selected football fans. The sample results provided a sample mean and standard deviation of $19.00 and $2.95, respectively. Use this information to construct a 98% confidence interval for the mean. 
Question
Question
Question
Question
A random sample of n = 144 measurements was selected from a population with unknown mean μ and standard deviation σ. Calculate a 90% confidence interval if 
Question
Question
A random sample of 80 observations produced a mean  a. Find a 90% confidence interval for the population mean μ. b. Find a 95% confidence interval for μ. c. Find a 99% confidence interval for μ. d. What happens to the width of a confidence interval as the value of the confidence coefficient is increased while the sample size is held fixed? 7.3 Confidence Interval for a Population Mean: Student's t-Statistic 1 Compare t-Distribution to Normal Distribution
a. Find a 90% confidence interval for the population mean μ. b. Find a 95% confidence interval for μ. c. Find a 99% confidence interval for μ. d. What happens to the width of a confidence interval as the value of the confidence coefficient is increased while the sample size is held fixed? 7.3 Confidence Interval for a Population Mean: Student's t-Statistic 1 Compare t-Distribution to Normal Distribution Question
Question
Question
Question
Question
A marketing research company is estimating which of two soft drinks college students prefer. A random sample of 157 college students produced the following confidence interval for the proportion of college students who prefer drink A: (.344, .494). Is this a large enough sample for this analysis to work? 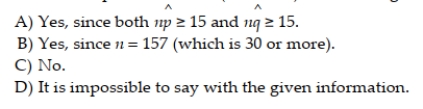
Question
For n = 800 and  = .99, is the sample size large enough to construct a confidence for p?
= .99, is the sample size large enough to construct a confidence for p? Question
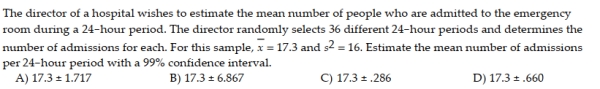
To help consumers assess the risks they are taking, the Food and Drug Administration (FDA) publishes the amount of nicotine found in all commercial brands of cigarettes. A new cigarette has recently been marketed. The FDA tests on this cigarette yielded mean nicotine content of 28.4 milligrams and standard deviation of 2.2 milligrams for a sample of n = 9 cigarettes. Construct a 98% confidence interval for the mean nicotine content of this brand of cigarette. 
Question
Question
A computer package was used to generate the following printout for estimating the mean sale price of homes in a particular neighborhood. 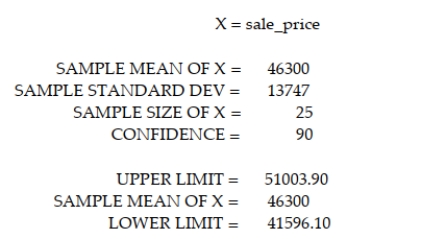 A friend suggests that the mean sale price of homes in this neighborhood is $42,000. Comment on your friend's suggestion.
A friend suggests that the mean sale price of homes in this neighborhood is $42,000. Comment on your friend's suggestion. Question
A study was conducted to determine what proportion of all college students considered themselves as full-time students. A random sample of 300 college students was selected and 210 of the students responded that they considered themselves full-time students. A computer program was used to generate the following 95% confidence interval for the population proportion: (0.64814, 0.75186). The sample size that was used in this problem is considered a large sample. What criteria should be used to determine if n is large? 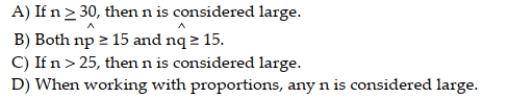
Question
Question
Question
Question
Question
What type of car is more popular among college students, American or foreign? One hundred fifty-nine college students were randomly sampled and each was asked which type of car he or she prefers. A computer package was used to generate the printout below for the proportion of college students who prefer American automobiles. SAMPLE PROPORTION = .396226 SAMPLE SIZE = 159 UPPER LIMIT = .46418 LOWER LIMIT = .331125 Is the sample large enough for the interval to be valid? 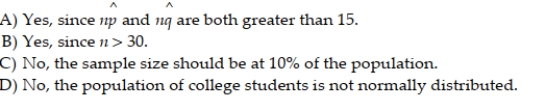
Question
Question
 181.387
 Question
For n = 40 and  = .35, is the sample size large enough to construct a confidence for p?
= .35, is the sample size large enough to construct a confidence for p? Question
Question
For n = 40 and  = .45, is the sample size large enough to construct a confidence for p?
= .45, is the sample size large enough to construct a confidence for p? Question
The following sample of 16 measurements was selected from a population that is approximately normally distributed. 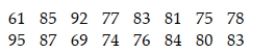 Construct a 90% confidence interval for the population mean.
Construct a 90% confidence interval for the population mean. Question

Unlock Deck
Sign up to unlock the cards in this deck!
Unlock Deck
Unlock Deck
1/124
Play
Full screen (f)
Deck 7: Inferences Based on a Single Sample: Estimation With Confidence Intervals
1
A study was conducted to determine what proportion of all college students considered themselves as full-time students. A random sample of 300 college students was selected and 210 of the students responded that they considered themselves full-time students. Which of the following would represent the target parameter of interest?
A) p
B) μ
A) p
B) μ
A
2
Parking at a large university can be extremely difficult at times. One particular university is trying to determine the location of a new parking garage. As part of their research, officials are interested in estimating the average parking time of students from within the various colleges on campus. A survey of 338 College of Business (COBA) students yields the following descriptive information regarding the length of time (in minutes) it took them to find a parking spot. Note that the "Lo 95%" and "Up 95%" refer to the endpoints of the desired confidence interval.
University officials have determined that the confidence interval would be more useful if the interval were narrower. Which of the following changes in the confidence level would result in a narrower interval?
A) The university could increase their confidence level.
B) The university could decrease their confidence level.
The university could decrease their confidence level.
3
Explain what the phrase 95% confident means when we interpret a 95% confidence interval for μ.
A) In repeated sampling, 95% of similarly constructed intervals contain the value of the population mean.
B) 95% of similarly constructed intervals would contain the value of the sampled mean.
C) 95% of the observations in the population fall within the bounds of the calculated interval.
D) The probability that the sample mean falls in the calculated interval is 0.95.
A
4
A retired statistician was interested in determining the average cost of a $200,000.00 term life insurance policy for a 60-year-old male non-smoker. He randomly sampled 65 subjects (60-year-old male non-smokers) and constructed the following 95 percent confidence interval for the mean cost of the term life insurance: ($850.00, $1050.00). What value of alpha was used to create this confidence interval?
A) 0.10
B) 0.05
C) 0.025
D) 0.01
A) 0.10
B) 0.05
C) 0.025
D) 0.01
Unlock Deck
Unlock for access to all 124 flashcards in this deck.
Unlock Deck
k this deck
5
Which statement best describes a parameter?
A) A parameter is a numerical measure of a population that is almost always unknown and must be estimated.
B) A parameter is a level of confidence associated with an interval about a sample mean or proportion.
C) A parameter is a sample size that guarantees the error in estimation is within acceptable limits.
D) A parameter is an unbiased estimate of a statistic found by experimentation or polling.
Unlock Deck
Unlock for access to all 124 flashcards in this deck.
Unlock Deck
k this deck
6
For quantitative data, the target parameter is most likely to be the mode of the data.
Unlock Deck
Unlock for access to all 124 flashcards in this deck.
Unlock Deck
k this deck
7
The confidence coefficient is the relative frequency with which the interval estimator encloses the population parameter when the estimator is used repeatedly a very large number of times.
Unlock Deck
Unlock for access to all 124 flashcards in this deck.
Unlock Deck
k this deck
8
A 90% confidence interval for the average salary of all CEOs in the electronics industry was constructed using the results of a random survey of 45 CEOs. The interval was ($130,852, $147,990). To make more useful inferences from the data, it is desired to reduce the width of the confidence interval. Which of the following will result in a reduced interval width?
A) Increase the sample size and decrease the confidence level.
B) Decrease the sample size and decrease the confidence level.
C) Increase the sample size and increase the confidence level.
D) Decrease the sample size and increase the confidence level.
A) Increase the sample size and decrease the confidence level.
B) Decrease the sample size and decrease the confidence level.
C) Increase the sample size and increase the confidence level.
D) Decrease the sample size and increase the confidence level.
Unlock Deck
Unlock for access to all 124 flashcards in this deck.
Unlock Deck
k this deck
9
What is ?
A) 1.96
B) 2.575
C) 2.33
D) 1.645
A) 1.96
B) 2.575
C) 2.33
D) 1.645
Unlock Deck
Unlock for access to all 124 flashcards in this deck.
Unlock Deck
k this deck
10
The registrar's office at State University would like to determine a 95% confidence interval for the mean commute time of its students. A member of the staff randomly chooses a parking lot and surveys the first 125 students who park in the chosen lot on a given day. The confidence interval is
A) not meaningful because of the lack of random sampling.
B) meaningful because the sample size exceeds 30 and the Central Limit Theorem ensures normality of the sampling distribution of the sample mean.
C) not meaningful because the sampling distribution of the sample mean is not normal.
D) meaningful because the sample is representative of the population.
Unlock Deck
Unlock for access to all 124 flashcards in this deck.
Unlock Deck
k this deck
11
One way of reducing the width of a confidence interval is to reduce the confidence level.
Unlock Deck
Unlock for access to all 124 flashcards in this deck.
Unlock Deck
k this deck
12
The confidence level is the confidence coefficient expressed as a percentage.
Unlock Deck
Unlock for access to all 124 flashcards in this deck.
Unlock Deck
k this deck
13
Parking at a large university can be extremely difficult at times. One particular university is trying to determine the location of a new parking garage. As part of their research, officials are interested in estimating the average parking time of students from within the various colleges on campus. Which of the following would represent the target parameter of interest?
A) p
B) μ
A) p
B) μ
Unlock Deck
Unlock for access to all 124 flashcards in this deck.
Unlock Deck
k this deck
14
The Central Limit Theorem guarantees an approximately normal sampling distribution for the sample mean for large sample sizes, so no knowledge about the distribution of the population is necessary for the corresponding interval to be valid.
Unlock Deck
Unlock for access to all 124 flashcards in this deck.
Unlock Deck
k this deck
15
Suppose a large labor union wishes to estimate the mean number of hours per month a union member is absent from work. The union decides to sample 343 of its members at random and monitor the working time of each of them for 1 month. At the end of the month, the total number of hours absent from work is recorded for each employee. Which of the following should be used to estimate the parameter of interest for this problem?
A) A large sample confidence interval for μ.
B) A small sample confidence interval for μ.
C) A large sample confidence interval for p.
D) A small sample confidence interval for p.
A) A large sample confidence interval for μ.
B) A small sample confidence interval for μ.
C) A large sample confidence interval for p.
D) A small sample confidence interval for p.
Unlock Deck
Unlock for access to all 124 flashcards in this deck.
Unlock Deck
k this deck
16
Since the population standard deviation σ is almost always known, we use it instead of the sample standard deviation s when finding a confidence interval.
Unlock Deck
Unlock for access to all 124 flashcards in this deck.
Unlock Deck
k this deck
17
Suppose (1,000, 2,100) is a 95% confidence interval for μ. To make more useful inferences from the data, it is desired to reduce the width of the confidence interval. Explain why an increase in sample size will lead to a narrower interval of the estimate of μ.
Unlock Deck
Unlock for access to all 124 flashcards in this deck.
Unlock Deck
k this deck
18
A 90% confidence interval for the mean percentage of airline reservations being canceled on the day of the flight is (1.3%, 5%). What is the point estimator of the mean percentage of reservations that are canceled on the day of the flight?
A) 3.15%
B) 1.85%
C) 2.50%
D) 3.7%
A) 3.15%
B) 1.85%
C) 2.50%
D) 3.7%
Unlock Deck
Unlock for access to all 124 flashcards in this deck.
Unlock Deck
k this deck
19
What is the confidence level of the following confidence interval for ??
A) 95%
B) 98%
C) 99%
D) 196%
A) 95%
B) 98%
C) 99%
D) 196%
Unlock Deck
Unlock for access to all 124 flashcards in this deck.
Unlock Deck
k this deck
20
For data with two outcomes (success or failure), the binomial proportion of successes is likely to be the parameter of interest.
Unlock Deck
Unlock for access to all 124 flashcards in this deck.
Unlock Deck
k this deck
21
A retired statistician was interested in determining the average cost of a $200,000.00 term life insurance policy for a 60-year-old male non-smoker. He randomly sampled 65 subjects (60-year-old male non-smokers) and constructed the following 95 percent confidence interval for the mean cost of the term life insurance: ($850.00, $1050.00). Explain what the phrase "95 percent confident" means in this situation.
A) In repeated sampling, the mean of the population will fall within the specified intervals 95 percent of the time.
B) In repeated sampling, 95 percent of the intervals constructed would contain the value of the true population mean.
C) 95 percent of all retired statisticians are underinsured.
D) 95 percent of all the life insurance costs will fall within the specified interval.
Unlock Deck
Unlock for access to all 124 flashcards in this deck.
Unlock Deck
k this deck
22
A random sample of 250 students at a university finds that these students take a mean of 15.6 credit hours per quarter with a standard deviation of 2.2 credit hours. Estimate the mean credit hours taken by a student each quarter using a 98% confidence interval. Round to the nearest thousandth.
Unlock Deck
Unlock for access to all 124 flashcards in this deck.
Unlock Deck
k this deck
23
The following data represent the scores of a sample of 50 randomly chosen students on a standardized test. a. Write a 95% confidence interval for the mean score of all students who took the test. b. Identify the target parameter and the point estimator.
a. Write a 95% confidence interval for the mean score of all students who took the test. b. Identify the target parameter and the point estimator. Unlock Deck
Unlock for access to all 124 flashcards in this deck.
Unlock Deck
k this deck
24
A random sample of 250 students at a university finds that these students take a mean of 15.4 credit hours per quarter with a standard deviation of 2.2 credit hours. The 99% confidence interval for the mean is 15.4 ± 0.358. Interpret the interval.
A) We are 99% confident that the average number of credit hours per quarter of students at the university falls in the interval 15.042 to 15.758 hours.
B) 99% of the students take between 15.042 to 15.758 credit hours per quarter.
C) We are 99% confident that the average number of credit hours per quarter of the sampled students falls in the interval 15.042 to 15.758 hours.
D) The probability that a student takes 15.042 to 15.758 credit hours in a quarter is 0.99.
Unlock Deck
Unlock for access to all 124 flashcards in this deck.
Unlock Deck
k this deck
25
Determine the confidence level for the given confidence interval for ?.
A) 86%
B) 93%
C) 7%
D) 96.5%
A) 86%
B) 93%
C) 7%
D) 96.5%
Unlock Deck
Unlock for access to all 124 flashcards in this deck.
Unlock Deck
k this deck
26
A random sample of n measurements was selected from a population with unknown mean μ and known standard deviation σ. Calculate a 95% confidence interval for μ for the given situation. Round to the nearest hundredth when necessary.
Unlock Deck
Unlock for access to all 124 flashcards in this deck.
Unlock Deck
k this deck
27
A 90% confidence interval for the average salary of all CEOs in the electronics industry was constructed using the results of a random survey of 45 CEOs. The interval was ($139,048, $154,144). Give a practical interpretation of the interval.
A) We are 90% confident that the mean salary of all CEOs in the electronics industry falls in the interval $139,048 to $154,144.
B) 90% of all CEOs in the electronics industry have salaries that fall between $139,048 to $154,144.
C) We are 90% confident that the mean salary of the sampled CEOs falls in the interval $139,048 to $154,144.
D) 90% of the sampled CEOs have salaries that fell in the interval $139,048 to $154,144.
Unlock Deck
Unlock for access to all 124 flashcards in this deck.
Unlock Deck
k this deck
28
Which information is not shown on the screen below?
A) the confidence level
B) the sample mean
C) the sample standard deviation
D) the sample size
A) the confidence level
B) the sample mean
C) the sample standard deviation
D) the sample size
Unlock Deck
Unlock for access to all 124 flashcards in this deck.
Unlock Deck
k this deck
29
A retired statistician was interested in determining the average cost of a $200,000.00 term life insurance policy for a 60-year-old male non-smoker. He randomly sampled 65 subjects (60-year-old male non-smokers) and constructed the following 95 percent confidence interval for the mean cost of the term life insurance: ($850.00, $1050.00). State the appropriate interpretation for this confidence interval. Note that all answers begin with "We are 95 percent confidence that…"
A) The average term life insurance cost for sampled 65 subjects falls between $850.00 and $1050.00
B) The term life insurance cost of the retired statistician's insurance policy falls between $850.00 and $1050.00
C) The term life insurance cost for all 60-year-old male non-smokers' insurance policies falls between $850.00 and $1050.00
D) The average term life insurance costs for all 60-year-old male non-smokers falls between $850.00 and $1050.00
Unlock Deck
Unlock for access to all 124 flashcards in this deck.
Unlock Deck
k this deck
30
Unlock Deck
Unlock for access to all 124 flashcards in this deck.
Unlock Deck
k this deck
31
Find for the given value of .
A) 1.48
B) 1.08
C) 0.14
D) 1.58
A) 1.48
B) 1.08
C) 0.14
D) 1.58
Unlock Deck
Unlock for access to all 124 flashcards in this deck.
Unlock Deck
k this deck
32
What is the confidence coefficient in a 95% confidence interval for μ?
A) .95
B) .05
C) .025
D) .475
A) .95
B) .05
C) .025
D) .475
Unlock Deck
Unlock for access to all 124 flashcards in this deck.
Unlock Deck
k this deck
33
To help consumers assess the risks they are taking, the Food and Drug Administration (FDA) publishes the amount of nicotine found in all commercial brands of cigarettes. A new cigarette has recently been marketed. The FDA tests on this cigarette yielded a mean nicotine content of 24.5 milligrams and standard deviation of 2.3 milligrams for a sample of n = 82 cigarettes. Find a 95% confidence interval for μ.
Unlock Deck
Unlock for access to all 124 flashcards in this deck.
Unlock Deck
k this deck
34
Parking at a large university can be extremely difficult at times. One particular university is trying to determine the location of a new parking garage. As part of their research, officials are interested in estimating the average parking time of students from within the various colleges on campus. A survey of 338 College of Business (COBA) students yields the following descriptive information regarding the length of time (in minutes) it took them to find a parking spot. Note that the "Lo 95%" and "Up 95%" refer to the endpoints of the desired confidence interval.
Explain what the phrase "95% confident" means when working with a 95% confidence interval.
A) In repeated sampling, 95% of the sample means will fall within the interval created.
B) 95% of the observations in the population will fall within the endpoints of the interval.
C) In repeated sampling, 95% of the population means will fall within the interval created.
D) In repeated sampling, 95% of the intervals created will contain the population mean.
Unlock Deck
Unlock for access to all 124 flashcards in this deck.
Unlock Deck
k this deck
35
How much money does the average professional football fan spend on food at a single football game? That question was posed to 40 randomly selected football fans. The sample results provided a sample mean and standard deviation of $11.00 and $2.80, respectively. Find and interpret a 99% confidence interval for μ.
Unlock Deck
Unlock for access to all 124 flashcards in this deck.
Unlock Deck
k this deck
36
A random sample of n = 100 measurements was selected from a population with unknown mean μ and standard deviation σ. Calculate a 95% confidence interval if
Unlock Deck
Unlock for access to all 124 flashcards in this deck.
Unlock Deck
k this deck
37
Suppose that 100 samples of size n = 50 are independently chosen from the same population and that each sample is used to construct its own 95% confidence interval for an unknown population mean μ. How many of the 100 confidence intervals would you expect to actually contain μ?
Unlock Deck
Unlock for access to all 124 flashcards in this deck.
Unlock Deck
k this deck
38
Unlock Deck
Unlock for access to all 124 flashcards in this deck.
Unlock Deck
k this deck
39
How much money does the average professional football fan spend on food at a single football game? That question was posed to 60 randomly selected football fans. The sampled results show that the sample mean was $70.00 and prior sampling indicated that the population standard deviation was $17.50. Use this information to create a 95 percent confidence interval for the population mean.
Unlock Deck
Unlock for access to all 124 flashcards in this deck.
Unlock Deck
k this deck
40
Parking at a large university can be extremely difficult at times. One particular university is trying to determine the location of a new parking garage. As part of their research, officials are interested in estimating the average parking time of students from within the various colleges on campus. A survey of 338 College of Business (COBA) students yields the following descriptive information regarding the length of time (in minutes) it took them to find a parking spot. Note that the "Lo 95%" and "Up 95%" refer to the endpoints of the desired confidence interval. Give a practical interpretation for the 95% confidence interval given above.
A) 95% of the COBA students had parking times of 10.466 minutes.
B) 95% of the COBA students had parking times that fell between 9.19 and 11.74 minutes.
C) We are 95% confident that the average parking time of all COBA students falls between 9.19 and 11.74 minutes.
D) We are 95% confident that the average parking time of the 338 COBA students surveyed falls between 9.19 and 11.74 minutes.
Unlock Deck
Unlock for access to all 124 flashcards in this deck.
Unlock Deck
k this deck
41
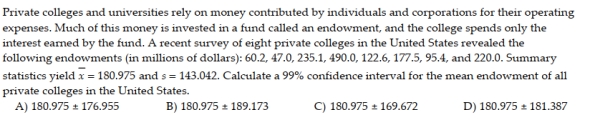
Private colleges and universities rely on money contributed by individuals and corporations for their operating expenses. Much of this money is invested in a fund called an endowment, and the college spends only the interest earned by the fund. A recent survey of eight private colleges in the United States revealed the following endowments (in millions of dollars): 64.5, 55.1, 232.8, 496.1, 127.6, 186.4, 104.7, and 212.2. What value will be used as the point estimate for the mean endowment of all private colleges in the United States?
A) 184.925
B) 1479.4
C) 211.343
D) 8
A) 184.925
B) 1479.4
C) 211.343
D) 8
Unlock Deck
Unlock for access to all 124 flashcards in this deck.
Unlock Deck
k this deck
42
Unlock Deck
Unlock for access to all 124 flashcards in this deck.
Unlock Deck
k this deck
43
How much money does the average professional football fan spend on food at a single football game? That question was posed to ten randomly selected football fans. The sampled results show that the sample mean and sample standard deviation were $70.00 and $17.50, respectively. Use this information to create a 95 percent confidence interval for the population mean.
Unlock Deck
Unlock for access to all 124 flashcards in this deck.
Unlock Deck
k this deck
44
Suppose you selected a random sample of n = 7 measurements from a normal distribution. Compare the standard normal z value with the corresponding t value for a 90% confidence interval.
Unlock Deck
Unlock for access to all 124 flashcards in this deck.
Unlock Deck
k this deck
45
Find the value of
A) 1.761
B) 1.345
C) 2.145
D) 2.624
A) 1.761
B) 1.345
C) 2.145
D) 2.624
Unlock Deck
Unlock for access to all 124 flashcards in this deck.
Unlock Deck
k this deck
46
Let t0 be a particular value of t. Find a value of
Unlock Deck
Unlock for access to all 124 flashcards in this deck.
Unlock Deck
k this deck
47
Fifteen SmartCars were randomly selected and the highway mileage of each was noted. The analysis yielded a mean of 47 miles per gallon and a standard deviation of 5 miles per gallon. Which of the following would represent a 90% confidence interval for the average highway mileage of all SmartCars?
Unlock Deck
Unlock for access to all 124 flashcards in this deck.
Unlock Deck
k this deck
48
A marketing research company is estimating the average total compensation of CEOs in the service industry. Data were randomly collected from 18 CEOs and the 90% confidence interval for the mean was calculated to be ($2,181,260, $5,836,180). Explain what the phrase "90% confident" means.
A) In repeated sampling, 90% of the intervals constructed would contain μ.
B) 90% of the population values will fall within the interval.
C) 90% of the sample means from similar samples fall within the interval.
D) 90% of the similarly constructed intervals would contain the value of the sample mean.
Unlock Deck
Unlock for access to all 124 flashcards in this deck.
Unlock Deck
k this deck
49
Find the value of
A) 2.131
B) 1.753
C) 2.602
D) 2.947
A) 2.131
B) 1.753
C) 2.602
D) 2.947
Unlock Deck
Unlock for access to all 124 flashcards in this deck.
Unlock Deck
k this deck
50
A marketing research company is estimating the average total compensation of CEOs in the service industry. Data were randomly collected from 18 CEOs and the 97% confidence interval for the mean was calculated to be ($2,181,260, $5,836,180). What would happen to the confidence interval if the confidence level were changed to 95%?
A) The interval would get narrower.
B) The interval would get wider.
C) There would be no change in the width of the interval.
D) It is impossible to tell until the 95% interval is constructed.
A) The interval would get narrower.
B) The interval would get wider.
C) There would be no change in the width of the interval.
D) It is impossible to tell until the 95% interval is constructed.
Unlock Deck
Unlock for access to all 124 flashcards in this deck.
Unlock Deck
k this deck
51
You are interested in purchasing a new car. One of the many points you wish to consider is the resale value of the car after 5 years. Since you are particularly interested in a certain foreign sedan, you decide to estimate the resale value of this car with a 99% confidence interval. You manage to obtain data on 17 recently resold 5-year-old foreign sedans of the same model. These 17 cars were resold at an average price of $12,380 with a standard deviation of $800. What is the 99% confidence interval for the true mean resale value of a 5- year-old car of this model?
Unlock Deck
Unlock for access to all 124 flashcards in this deck.
Unlock Deck
k this deck
52
How much money does the average professional football fan spend on food at a single football game? That question was posed to 10 randomly selected football fans. The sample results provided a sample mean and standard deviation of $19.00 and $2.95, respectively. Use this information to construct a 98% confidence interval for the mean.
Unlock Deck
Unlock for access to all 124 flashcards in this deck.
Unlock Deck
k this deck
53
A marketing research company is estimating the average total compensation of CEOs in the service industry. Data were randomly collected from 18 CEOs and the 98% confidence interval for the mean was calculated to be ($2,181,260, $5,836,180). What additional assumption is necessary for this confidence interval to be valid?
A) The population of total compensations of CEOs in the service industry is approximately normally distributed.
B) None. The Central Limit Theorem applies.
C) The sample standard deviation is less than the degrees of freedom.
D) The distribution of the sample means is approximately normal.
A) The population of total compensations of CEOs in the service industry is approximately normally distributed.
B) None. The Central Limit Theorem applies.
C) The sample standard deviation is less than the degrees of freedom.
D) The distribution of the sample means is approximately normal.
Unlock Deck
Unlock for access to all 124 flashcards in this deck.
Unlock Deck
k this deck
54
Let t0 be a specific value of t. Find t0 such that the following statement is true:
A) 2.086
B) -2.086
C) 2.093
D) -2.093
A) 2.086
B) -2.086
C) 2.093
D) -2.093
Unlock Deck
Unlock for access to all 124 flashcards in this deck.
Unlock Deck
k this deck
55
Suppose you selected a random sample of n = 29 measurements from a normal distribution. Compare the standard normal z value with the corresponding t value for a 95% confidence interval.
Unlock Deck
Unlock for access to all 124 flashcards in this deck.
Unlock Deck
k this deck
56
A random sample of n = 144 measurements was selected from a population with unknown mean μ and standard deviation σ. Calculate a 90% confidence interval if
Unlock Deck
Unlock for access to all 124 flashcards in this deck.
Unlock Deck
k this deck
57
An educator wanted to look at the study habits of university students. As part of the research, data was collected for three variables - the amount of time (in hours per week) spent studying, the amount of time (in hours per week) spent playing video games and the GPA - for a sample of 20 male university students. As part of the research, a 95% confidence interval for the average GPA of all male university students was calculated to be: (2.95, 3.10). Which of the following statements is true?
A) In construction of the confidence interval, a t-value with 19 degrees of freedom was used.
B) In construction of the confidence interval, a t-value with 20 degrees of freedom was used.
C) In construction of the confidence interval, a z-value was used.
D) In construction of the confidence interval, a z-value with 20 degrees of freedom was used. 2 Use t-Distribution
Unlock Deck
Unlock for access to all 124 flashcards in this deck.
Unlock Deck
k this deck
58
A random sample of 80 observations produced a mean a. Find a 90% confidence interval for the population mean μ. b. Find a 95% confidence interval for μ. c. Find a 99% confidence interval for μ. d. What happens to the width of a confidence interval as the value of the confidence coefficient is increased while the sample size is held fixed? 7.3 Confidence Interval for a Population Mean: Student's t-Statistic 1 Compare t-Distribution to Normal Distribution
a. Find a 90% confidence interval for the population mean μ. b. Find a 95% confidence interval for μ. c. Find a 99% confidence interval for μ. d. What happens to the width of a confidence interval as the value of the confidence coefficient is increased while the sample size is held fixed? 7.3 Confidence Interval for a Population Mean: Student's t-Statistic 1 Compare t-Distribution to Normal Distribution Unlock Deck
Unlock for access to all 124 flashcards in this deck.
Unlock Deck
k this deck
59
Find the value of
A) 3.250
B) 2.2821
C) 2.262
D) 1.833
A) 3.250
B) 2.2821
C) 2.262
D) 1.833
Unlock Deck
Unlock for access to all 124 flashcards in this deck.
Unlock Deck
k this deck
60
You are interested in purchasing a new car. One of the many points you wish to consider is the resale value of the car after 5 years. Since you are particularly interested in a certain foreign sedan, you decide to estimate the resale value of this car with a 90% confidence interval. You manage to obtain data on 17 recently resold 5-year-old foreign sedans of the same model. These 17 cars were resold at an average price of $12,320 with a standard deviation of $600. Suppose that the interval is calculated to be ($12,065.92, $12,574.08). How could we alter the sample size and the confidence coefficient in order to guarantee a decrease in the width of the interval?
A) Increase the sample size but decrease the confidence coefficient.
B) Increase the sample size and increase the confidence coefficient.
C) Keep the sample size the same but increase the confidence coefficient.
D) Decrease the sample size but increase the confidence coefficient.
A) Increase the sample size but decrease the confidence coefficient.
B) Increase the sample size and increase the confidence coefficient.
C) Keep the sample size the same but increase the confidence coefficient.
D) Decrease the sample size but increase the confidence coefficient.
Unlock Deck
Unlock for access to all 124 flashcards in this deck.
Unlock Deck
k this deck
61
An educator wanted to look at the study habits of university students. As part of the research, data was collected for three variables - the amount of time (in hours per week) spent studying, the amount of time (in hours per week) spent playing video games and the GPA - for a sample of 20 male university students. As part of the research, a 95% confidence interval for the average GPA of all male university students was calculated to be: (2.95, 3.10). The researcher claimed that the average GPA of all male students exceeded 2.94. Using the confidence interval supplied above, how do you respond to this claim?
A) We are 95% confident that the researcher is correct.
B) We are 100% confident that the researcher is incorrect.
C) We are 95% confident that the researcher is incorrect.
D) We cannot make any statement regarding the average GPA of male university students at the 95% confidence level.
A) We are 95% confident that the researcher is correct.
B) We are 100% confident that the researcher is incorrect.
C) We are 95% confident that the researcher is incorrect.
D) We cannot make any statement regarding the average GPA of male university students at the 95% confidence level.
Unlock Deck
Unlock for access to all 124 flashcards in this deck.
Unlock Deck
k this deck
62
A marketing research company is estimating the average total compensation of CEOs in the service industry. Data were randomly collected from 18 CEOs and the 95% confidence interval was calculated to be ($2,181,260, $5,836,180). Based on the interval above, do you believe the average total compensation of CEOs in the service industry is more than $1,500,000?
Unlock Deck
Unlock for access to all 124 flashcards in this deck.
Unlock Deck
k this deck
63
A marketing research company is estimating which of two soft drinks college students prefer. A random sample of 157 college students produced the following confidence interval for the proportion of college students who prefer drink A: (.344, .494). Is this a large enough sample for this analysis to work?
Unlock Deck
Unlock for access to all 124 flashcards in this deck.
Unlock Deck
k this deck
64
For n = 800 and = .99, is the sample size large enough to construct a confidence for p?
= .99, is the sample size large enough to construct a confidence for p? Unlock Deck
Unlock for access to all 124 flashcards in this deck.
Unlock Deck
k this deck
65
To help consumers assess the risks they are taking, the Food and Drug Administration (FDA) publishes the amount of nicotine found in all commercial brands of cigarettes. A new cigarette has recently been marketed. The FDA tests on this cigarette yielded mean nicotine content of 28.4 milligrams and standard deviation of 2.2 milligrams for a sample of n = 9 cigarettes. Construct a 98% confidence interval for the mean nicotine content of this brand of cigarette.
Unlock Deck
Unlock for access to all 124 flashcards in this deck.
Unlock Deck
k this deck
66
A computer package was used to generate the following printout for estimating the mean sale price of homes in a particular neighborhood.
At what level of reliability is the confidence interval made?
A) 98%
B) 2%
C) 49%
D) 51%
At what level of reliability is the confidence interval made?
A) 98%
B) 2%
C) 49%
D) 51%
Unlock Deck
Unlock for access to all 124 flashcards in this deck.
Unlock Deck
k this deck
67
A computer package was used to generate the following printout for estimating the mean sale price of homes in a particular neighborhood. A friend suggests that the mean sale price of homes in this neighborhood is $42,000. Comment on your friend's suggestion.
A friend suggests that the mean sale price of homes in this neighborhood is $42,000. Comment on your friend's suggestion. Unlock Deck
Unlock for access to all 124 flashcards in this deck.
Unlock Deck
k this deck
68
A study was conducted to determine what proportion of all college students considered themselves as full-time students. A random sample of 300 college students was selected and 210 of the students responded that they considered themselves full-time students. A computer program was used to generate the following 95% confidence interval for the population proportion: (0.64814, 0.75186). The sample size that was used in this problem is considered a large sample. What criteria should be used to determine if n is large?
Unlock Deck
Unlock for access to all 124 flashcards in this deck.
Unlock Deck
k this deck
69
A marketing research company is estimating the average total compensation of CEOs in the service industry. Data were randomly collected from 18 CEOs and the 97% confidence interval was calculated to be ($2,181,260, $5,836,180). Give a practical interpretation of the confidence interval.
Unlock Deck
Unlock for access to all 124 flashcards in this deck.
Unlock Deck
k this deck
70
A computer package was used to generate the following printout for estimating the mean sale price of homes in a particular neighborhood.
Which of the following is a practical interpretation of the interval above?
A) We are 90% confident that the mean sale price of all homes in this neighborhood falls between $40,349.40 and $52,850.60.
B) We are 90% confident that the true sale price of all homes in this neighborhood fall between $40,349.40 and $52,850.60.
C) 90% of the homes in this neighborhood have sale prices that fall between $40,349.40 and $52,850.60.
D) All are correct practical interpretations of this interval.
Unlock Deck
Unlock for access to all 124 flashcards in this deck.
Unlock Deck
k this deck
71
The following random sample was selected from a normal population: 9, 11, 8, 10, 14, 8. Construct a 95% confidence interval for the population mean μ.
Unlock Deck
Unlock for access to all 124 flashcards in this deck.
Unlock Deck
k this deck
72
A marketing research company is estimating which of two soft drinks college students prefer. A random sample of 341 college students produced the following 95% confidence interval for the proportion of college students who prefer one of the colas: (.341, .451). What additional assumptions are necessary for the interval to be valid?
A) No additional assumptions are necessary.
B) The sample proportion equals the population proportion.
C) The sample was randomly selected from an approximately normal population.
D) The population proportion has an approximately normal distribution.
A) No additional assumptions are necessary.
B) The sample proportion equals the population proportion.
C) The sample was randomly selected from an approximately normal population.
D) The population proportion has an approximately normal distribution.
Unlock Deck
Unlock for access to all 124 flashcards in this deck.
Unlock Deck
k this deck
73
What type of car is more popular among college students, American or foreign? One hundred fifty-nine college students were randomly sampled and each was asked which type of car he or she prefers. A computer package was used to generate the printout below for the proportion of college students who prefer American automobiles. SAMPLE PROPORTION = .396226 SAMPLE SIZE = 159 UPPER LIMIT = .46418 LOWER LIMIT = .331125 Is the sample large enough for the interval to be valid?
Unlock Deck
Unlock for access to all 124 flashcards in this deck.
Unlock Deck
k this deck
74
An educator wanted to look at the study habits of university students. As part of the research, data was collected for three variables - the amount of time (in hours per week) spent studying, the amount of time (in hours per week) spent playing video games and the GPA - for a sample of 20 male university students. As part of the research, a 95% confidence interval for the average GPA of all male university students was calculated to be: (2.95, 3.10). What assumption is necessary for the confidence interval analysis to work properly?
A) The Central Limit theorem guarantees that no assumptions about the population are necessary.
B) The population that we are sampling from needs to be a t-distribution with n-1 degrees of freedom.
C) The sampling distribution of the sample mean needs to be approximately normally distributed.
D) The population that we are sampling from needs to be approximately normally distributed.
Unlock Deck
Unlock for access to all 124 flashcards in this deck.
Unlock Deck
k this deck
75
181.387 Unlock Deck
Unlock for access to all 124 flashcards in this deck.
Unlock Deck
k this deck
76
For n = 40 and = .35, is the sample size large enough to construct a confidence for p?
= .35, is the sample size large enough to construct a confidence for p? Unlock Deck
Unlock for access to all 124 flashcards in this deck.
Unlock Deck
k this deck
77
You are interested in purchasing a new car. One of the many points you wish to consider is the resale value of the car after 5 years. Since you are particularly interested in a certain foreign sedan, you decide to estimate the resale value of this car with a 95% confidence interval. You manage to obtain data on 17 recently resold 5-year-old foreign sedans of the same model. These 17 cars were resold at an average price of $12,700 with a standard deviation of $700. Create a 95% confidence interval for the true mean resale value of a 5-year-old car of that model.
Unlock Deck
Unlock for access to all 124 flashcards in this deck.
Unlock Deck
k this deck
78
For n = 40 and = .45, is the sample size large enough to construct a confidence for p?
= .45, is the sample size large enough to construct a confidence for p? Unlock Deck
Unlock for access to all 124 flashcards in this deck.
Unlock Deck
k this deck
79
The following sample of 16 measurements was selected from a population that is approximately normally distributed. Construct a 90% confidence interval for the population mean.
Construct a 90% confidence interval for the population mean. Unlock Deck
Unlock for access to all 124 flashcards in this deck.
Unlock Deck
k this deck
80
A computer package was used to generate the following printout for estimating the mean sale price of homes in a particular neighborhood.
A friend suggests that the mean sale price of homes in this neighborhood is $44,000. Comment on your friend's suggestion.
A) Based on this printout, all you can say is that the mean sale price might be $44,000.
B) Your friend is wrong, and you are 95% certain.
C) Your friend is correct, and you are 95% certain.
D) Your friend is correct, and you are 100% certain.
Unlock Deck
Unlock for access to all 124 flashcards in this deck.
Unlock Deck
k this deck
Unlock Deck
Unlock for access to all 124 flashcards in this deck.


