Deck 4: Understanding and Comparing Distributions
Full screen (f)
Question
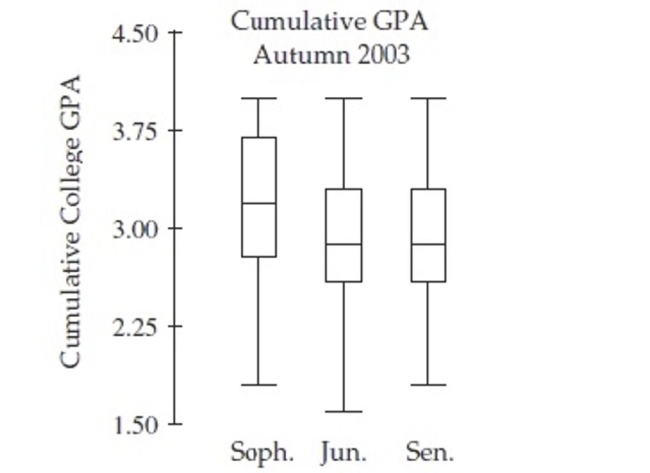
The side-by-side boxplots show the cumulative college GPAs for sophomores, juniors, and Seniors taking an intro stats course in Autumn 2003.
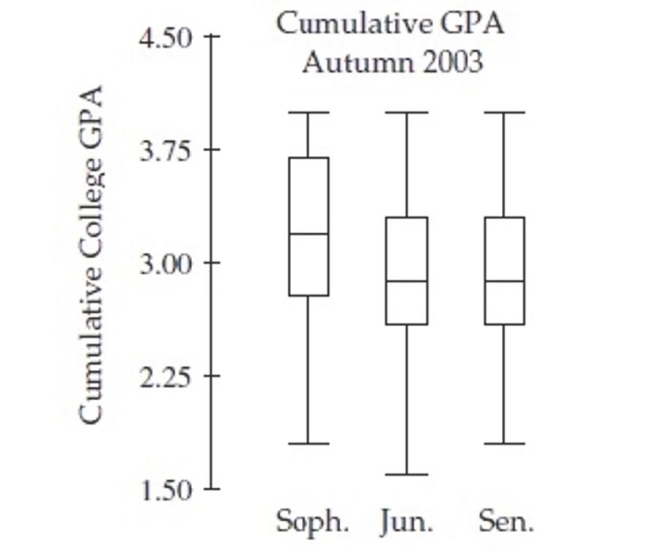
What is the approximate value of The largest range for GPA?
A)0.8
B)1.0
C)1.4
D)2.4
E)3.0
What is the approximate value of The largest range for GPA?
A)0.8
B)1.0
C)1.4
D)2.4
E)3.0
Question
The side-by-side boxplots show the cumulative college GPAs for sophomores, juniors, and seniors taking an intro stats course in Autumn 2012.
a.Which class (sophomore, junior, or senior) had the lowest cumulative college GPA?
What is the approximate value of that GPA?
b.Which class has the highest median GPA, and what is that GPA?
c.Which class has the largest range for GPA, and
what is it?
d.Which class has the most symmetric set of GPAs?
The most skewed set of GPAs?
Question
At www.census.gov you can create a "population pyramid" for any country.These pyramids are back-to-back histograms.This pyramid shows Mexico's 2000 female population and the census bureau's projection for 2050.Write a few sentences summarizing the changes that are forecast. 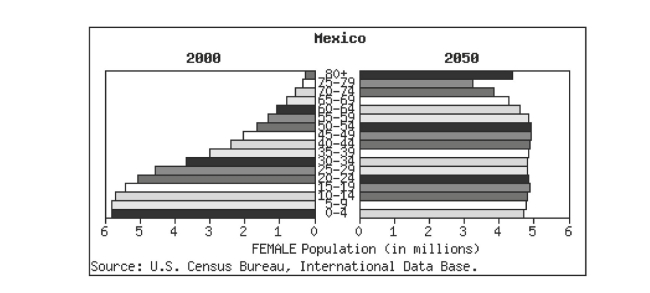
Question
On the right are two dotplots made for the heights of 200 randomly chosen students. The heights are separated by gender. Describe and compare the distributions 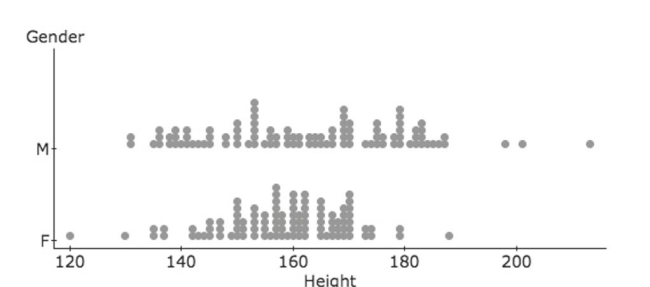
Question
One thousand students from a local university were sampled to gather information such as
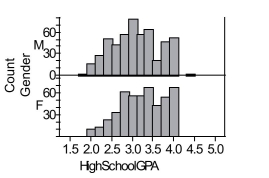
Gender, high school GPA, college GPA, and total SAT scores.The results were used to create Histograms displaying high school grade point averages (GPAs) for both males and females. Compare the grade distribution of males and females.Check all that apply.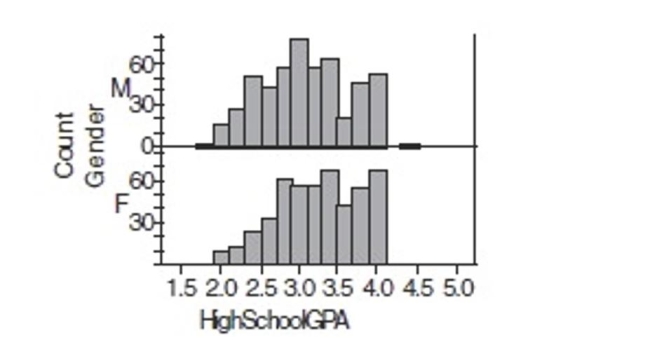
A)Both distributions are skewed to the left.
B)Both distributions appear to be centered at a GPA of about 3.0.
C)The distributions are skewed in different directions.
D)The distributions are differ strongly in center.
E)The distribution of male GPA appears slightly more spread out than the distribution of female GPA
Question
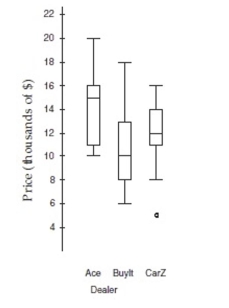
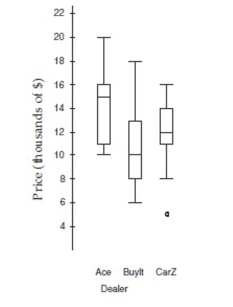
The boxplots show prices of used cars (in thousands of dollars) advertised for sale at three different car dealers.
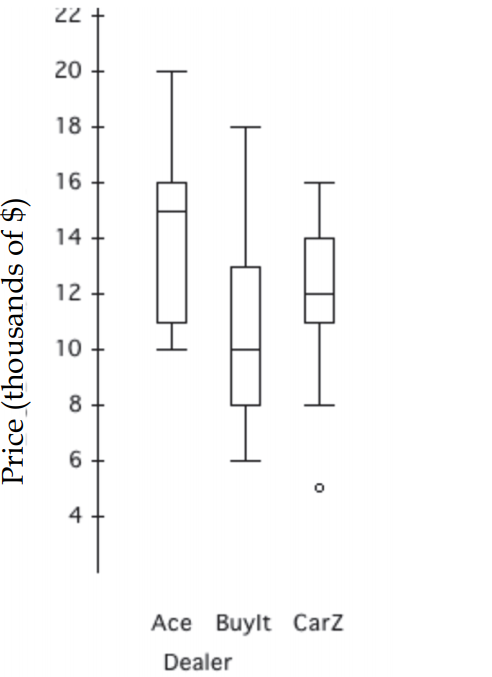
a. Which dealer offers the cheapest car offered, and at what price?
b. Which dealer has the lowest median price, and how much is it?
c. Which dealer has the smallest price range, and what is it?
d. Which dealer's prices have the smallest IQR, and what is it?
e. Which dealer generally sells cars cheapest? Explain.
Question
The side-by-side boxplots show the cumulative college GPAs for sophomores, juniors, and Seniors taking an intro stats course in Autumn 2003.
What is approximately the GPA of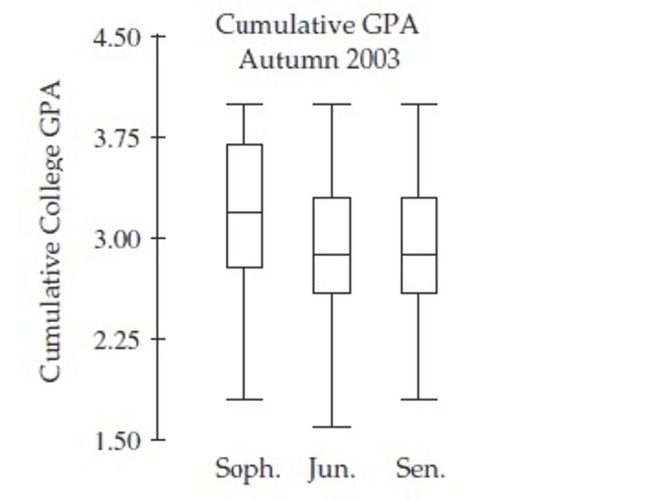
The class with the highest m edian GPA?
A)2.6
B)2.8
C)3.2
D)3.6
E)3.8
What is approximately the GPA of
The class with the highest m edian GPA?
A)2.6
B)2.8
C)3.2
D)3.6
E)3.8
Question
Question
The side-by-side boxplots show the cumulative college GPAs for sophomores, juniors, and
Seniors taking an intro stats course in Autumn 2003.
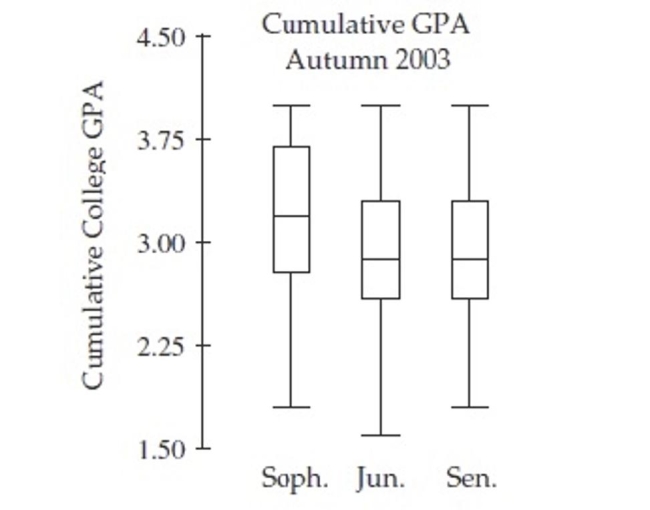
Which class has the most skewed set of GPAs?
A)Sophomore
B)Junior
C)Senior
D)Both Junior and Senior
Seniors taking an intro stats course in Autumn 2003.
Which class has the most skewed set of GPAs?
A)Sophomore
B)Junior
C)Senior
D)Both Junior and Senior
Question
The following boxplots show monthly sales revenue figures ($ thousands) for a discount
Office supply company with locations in three different regions of the U.S.(Northeast,
Southeast, and West).Which of the following statements is true?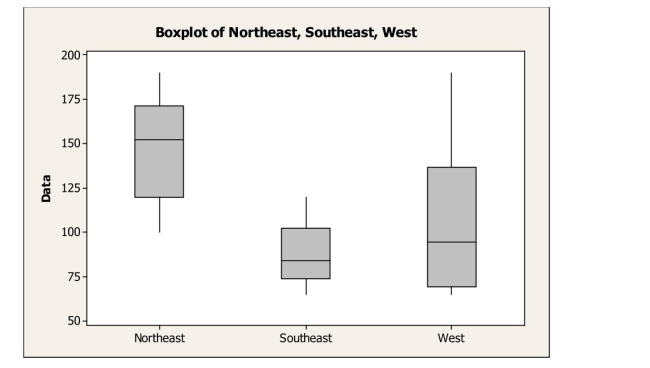
A)The Northeast has the lowest mean sales revenue.
B)The Southeast has the lowest median sales revenue.
C)The West has the lowest mean sales revenue.
D)The West has the lowest median sales revenue.
E)None of the above.
Question
The following boxplots show monthly sales revenue figures ($ thousands) for a discount
Office supply company with locations in three different regions of the U.S.(Northeast,
Southeast, and West).Which of the following statements is false?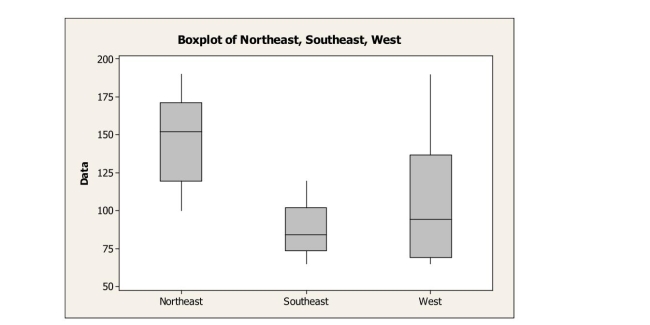
A)The West has the most variable sales revenues.
B)The West has the largest IQR.
C)The Southeast has the smallest IQR.
D)The Northeast has the most variable sales revenues.
Question
The side-by-side boxplots show the cumulative college GPAs for sophomores, juniors, and Seniors taking an intro stats course in Autumn 2003. 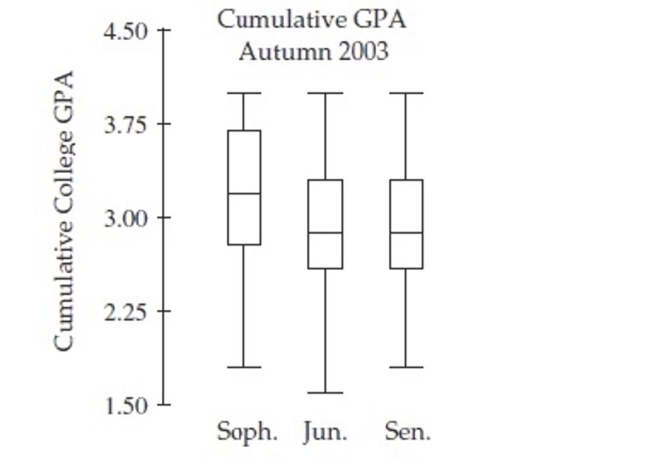
What is the approximate value of that GPA of the lowest scoring student?
A)1.6
B)1.8
C)2.6
D)2.8
E)3.0
What is the approximate value of that GPA of the lowest scoring student?
A)1.6
B)1.8
C)2.6
D)2.8
E)3.0
Question
The side-by-side boxplots show the cumulative college GPAs for sophomores, juniors, and Seniors taking an intro stats course in Autumn 2003. 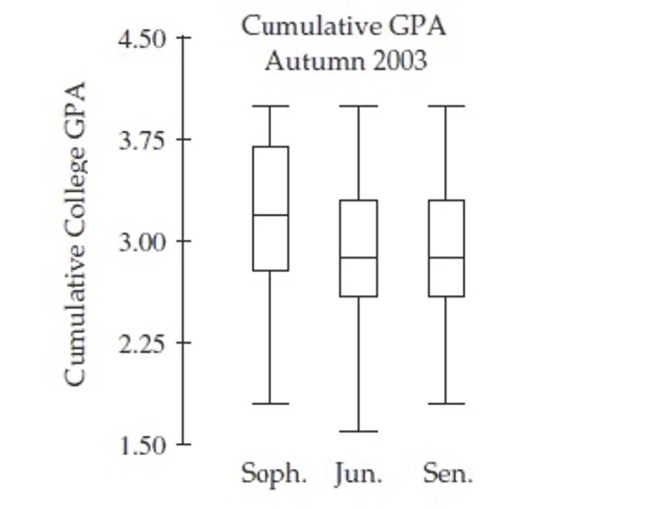
Which class has the highest median GPA?
A)Sophomore
B)Junior
C)Senior
D)Both Junior and Senior
Which class has the highest median GPA?
A)Sophomore
B)Junior
C)Senior
D)Both Junior and Senior
Question
One thousand students from a local university were sampled to gather information such as gender, high school GPA, college GPA, and total SAT scores. The results were used to create histograms displaying high school grade point averages (GPA’s) for both males and females. Compare the grade distribution of males and females.
Question
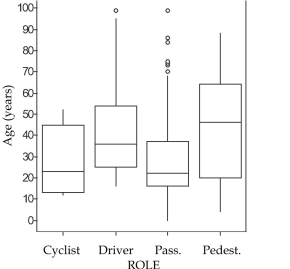
The boxplots show the age of people involved in accidents according to their role in the accident.
a. Which role involved the youngest person, and what is the age?
________________ _____________________
b. Which role had the lowe and what is the age?
_______________ _____________________
c. Which role had and what is it?
________________ _____________
d. Which role had the largest IQR of ages, and what is it?
___________ ______________
e. Which role generally involves the oldest people? Explain.
_____________ __________________
Question
The side-by-side boxplots show the cumulative college GPAs for sophomores, juniors, and
Seniors taking an intro stats course in Autumn 2003.
Which class has the largest range for GPA?
A)Sophomore
B)Junior
C)Senior
D)Both Junior and Senior
E)Both Sophomore and Junior
Seniors taking an intro stats course in Autumn 2003.
Which class has the largest range for GPA?
A)Sophomore
B)Junior
C)Senior
D)Both Junior and Senior
E)Both Sophomore and Junior
Question
Question
Question
The side-by-side boxplots show the cumulative college GPAs for sophomores, juniors, and Seniors taking an intro stats course in Autumn 2003.
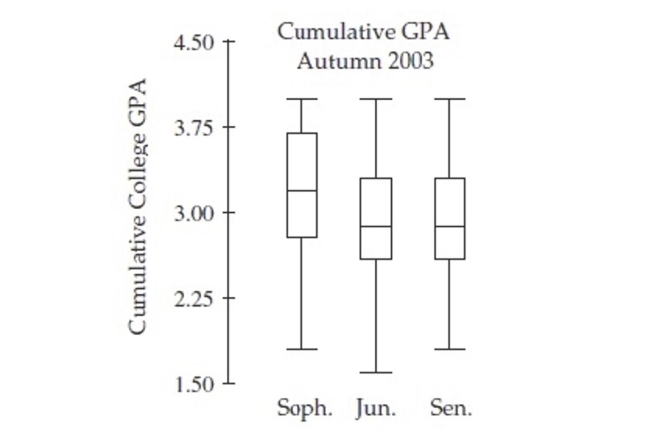
In which class (sophomore, junior, or senior) do you find the student with the lowest Cumulative college GPA?
A)Sophomore
B)Junior
C)Senior
D)Both Junior and Senior
E)Both Sophomore and Junior
In which class (sophomore, junior, or senior) do you find the student with the lowest Cumulative college GPA?
A)Sophomore
B)Junior
C)Senior
D)Both Junior and Senior
E)Both Sophomore and Junior
Question
Question
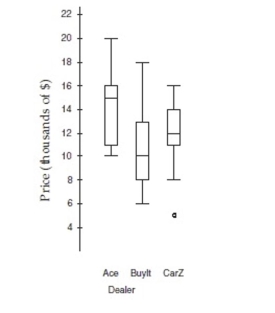
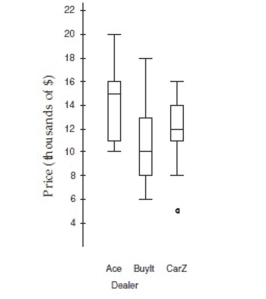
The boxplots show prices of used cars (in thousands of dollars) advertised for sale at three
Different car dealers.Which dealer has the lowest median price, and how much is it?
A)Ace: $15000.
B)BuyIt: $8000.
C)CarZ: $12000.
D)BuyIt: $10000.
E)Cannot say from boxplots only.
Different car dealers.Which dealer has the lowest median price, and how much is it?
A)Ace: $15000.
B)BuyIt: $8000.
C)CarZ: $12000.
D)BuyIt: $10000.
E)Cannot say from boxplots only.
Question
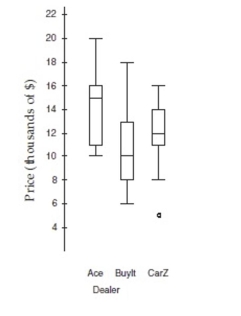
The boxplots show prices of used cars (in thousands of dollars) advertised for sale at three Different car dealers.Which dealer offers the cheapest car offered, and at what price?
A)Car Z: $5000.
B)BuyIt: $6000.
C)Ace: $10000.
D)BuyIt: $10000.
E)Cannot say from boxplots only.
A)Car Z: $5000.
B)BuyIt: $6000.
C)Ace: $10000.
D)BuyIt: $10000.
E)Cannot say from boxplots only.
Question
How do sports salaries compare? Two sets of histograms below show the distributions of Salaries for Major League Baseball and the National Football League.What set of histograms Makes it easier to compare the distributions? And for what reasons? Check all that apply.
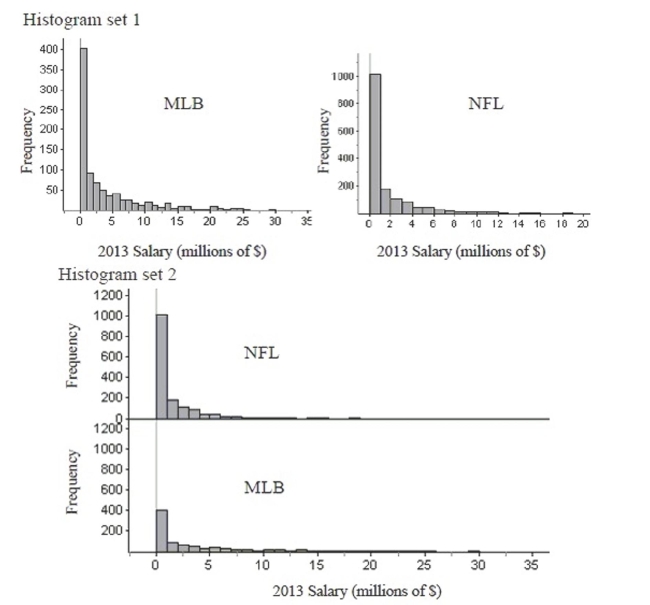
A)Both allow equal comparison.
B)The first set of histograms, because it uses different scales on the axes.
C)The second set of histograms, because it uses the same scales on the axes.
D)The first set of histograms, because it is stacked horizontally.
E) The second set of histograms, because it is stacked vertically
Question
At www.census.gov you can create a "population pyramid" for any country.These pyramids Are back-to-back histograms.This pyramid shows Mexico's 2000 female population and the Census bureau's projection for 2050.Check all that apply. 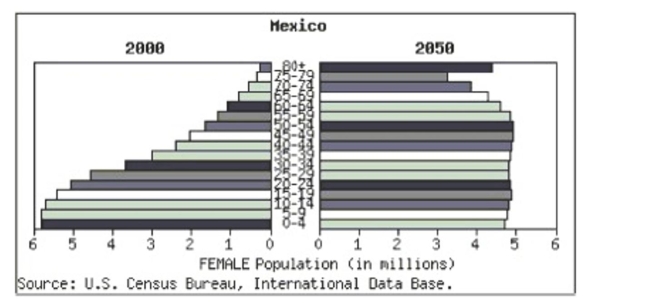
A)The expected mean age in 2050 is higher than the mean age in 2000.
B)The expected median age in 2050 is higher than the median age in 2000.
C)The expected mean age in 2050 is lower than the mean age in 2000.
D)The expected median age in 2050 is lower than the median age in 2000.
E)The IQR of the distribution of projected ages in 2050 is larger than the IQR of the distribution of ages in 2000.
Question
At www.census.gov you can create a "population pyramid" for any country.These pyramids Are back-to-back histograms.This pyramid shows Mexico's 2000 female population and the Census bureau's projection for 2050.Check all that apply. 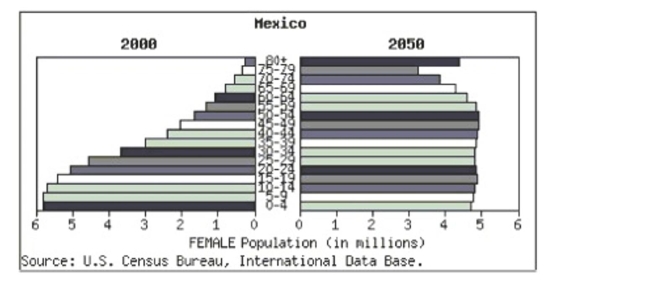
A)The distribution of ages in 2000 is strongly skewed to the left.
B)The distribution of ages in 2000 is strongly skewed to the right.
C)The distribution of projected ages in 2050 is strongly skewed to the left.
D)The distribution of projected ages in 2050 is strongly skewed to the right.
E) The distribution of projected ages in 2050 is approximately uniform
Question
The boxplots show prices of used cars (in thousands of dollars) advertised for sale at three
Different car dealers.Which dealer's prices have the smallest IQR, and what is it?
A)CarZ: $3000.
B)CarZ: $8000.
C)Ace: $5000.
D)BuyIt: $5000.
Different car dealers.Which dealer's prices have the smallest IQR, and what is it?
A)CarZ: $3000.
B)CarZ: $8000.
C)Ace: $5000.
D)BuyIt: $5000.
Question
The boxplots show prices of used cars (in thousands of dollars) advertised for sale at three
Different car dealers.Which dealer has the smallest price range, and what is it?
A)CarZ: $8000.
B)CarZ: $11000.
C)Ace: $10000.
D)BuyIt: $5000.
E)Cannot say from boxplots only.
Different car dealers.Which dealer has the smallest price range, and what is it?
A)CarZ: $8000.
B)CarZ: $11000.
C)Ace: $10000.
D)BuyIt: $5000.
E)Cannot say from boxplots only.
Question
The boxplots show prices of used cars (in thousands of dollars) advertised for sale at three Different car dealers.Which dealer generally sells cars cheapest?
A)CarZ.
B)BuyIt.
C)Ace.
D)Both CarZ and Ace.
E)Cannot say from boxplots only.
A)CarZ.
B)BuyIt.
C)Ace.
D)Both CarZ and Ace.
E)Cannot say from boxplots only.

Unlock Deck
Sign up to unlock the cards in this deck!
Unlock Deck
Unlock Deck
1/28
Play
Full screen (f)
Deck 4: Understanding and Comparing Distributions
1
The side-by-side boxplots show the cumulative college GPAs for sophomores, juniors, and Seniors taking an intro stats course in Autumn 2003.
What is the approximate value of The largest range for GPA?
A)0.8
B)1.0
C)1.4
D)2.4
E)3.0
What is the approximate value of The largest range for GPA?
A)0.8
B)1.0
C)1.4
D)2.4
E)3.0
2.4
2
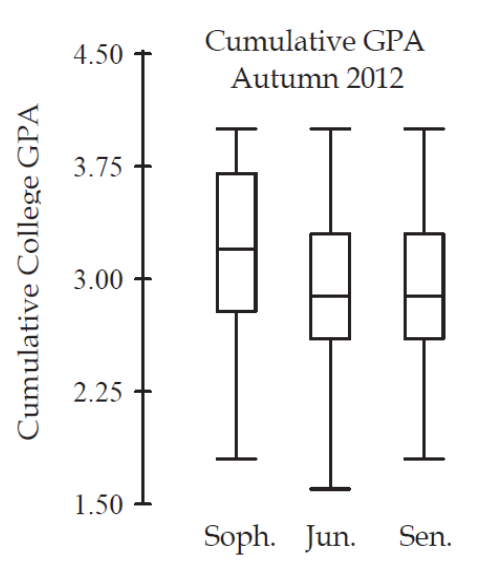
The side-by-side boxplots show the cumulative college GPAs for sophomores, juniors, and seniors taking an intro stats course in Autumn 2012.
a.Which class (sophomore, junior, or senior) had the lowest cumulative college GPA?
What is the approximate value of that GPA?
b.Which class has the highest median GPA, and what is that GPA?
c.Which class has the largest range for GPA, and
what is it?
d.Which class has the most symmetric set of GPAs?
The most skewed set of GPAs?
a.Which class (sophomore, junior, or senior) had the lowest cumulative college GPA?
What is the approximate value of that GPA?
b.Which class has the highest median GPA, and what is that GPA?
c.Which class has the largest range for GPA, and
what is it?
d.Which class has the most symmetric set of GPAs?
The most skewed set of GPAs?
a.The junior class had the lowest cumulative GPA, around 1.6
b.The sophomore class had the highest median cumulative GPA, around 3.2
c.The junior class had the largest range for GPA, about 2.4
d.The senior class had the most symmetric set of GPAs. The sophomore class had the most skewed set of GPAs, skewed to the left
b.The sophomore class had the highest median cumulative GPA, around 3.2
c.The junior class had the largest range for GPA, about 2.4
d.The senior class had the most symmetric set of GPAs. The sophomore class had the most skewed set of GPAs, skewed to the left
3
At www.census.gov you can create a "population pyramid" for any country.These pyramids are back-to-back histograms.This pyramid shows Mexico's 2000 female population and the census bureau's projection for 2050.Write a few sentences summarizing the changes that are forecast.
The Census Bureau projects dramatic changes in the female population of Mexico over the next 50 years.The current distribution of ages is strongly skewed to the right with most of the women under 30 and far fewer 50 and above.By 2050 the population will become more uniform across age groups from 0 to 60, and we anticipate an unusually large number of women over 80.
4
On the right are two dotplots made for the heights of 200 randomly chosen students. The heights are separated by gender. Describe and compare the distributions
Unlock Deck
Unlock for access to all 28 flashcards in this deck.
Unlock Deck
k this deck
5
One thousand students from a local university were sampled to gather information such as
Gender, high school GPA, college GPA, and total SAT scores.The results were used to create Histograms displaying high school grade point averages (GPAs) for both males and females. Compare the grade distribution of males and females.Check all that apply.
A)Both distributions are skewed to the left.
B)Both distributions appear to be centered at a GPA of about 3.0.
C)The distributions are skewed in different directions.
D)The distributions are differ strongly in center.
E)The distribution of male GPA appears slightly more spread out than the distribution of female GPA
Unlock Deck
Unlock for access to all 28 flashcards in this deck.
Unlock Deck
k this deck
6
The boxplots show prices of used cars (in thousands of dollars) advertised for sale at three different car dealers.
a. Which dealer offers the cheapest car offered, and at what price?
b. Which dealer has the lowest median price, and how much is it?
c. Which dealer has the smallest price range, and what is it?
d. Which dealer's prices have the smallest IQR, and what is it?
e. Which dealer generally sells cars cheapest? Explain.
Unlock Deck
Unlock for access to all 28 flashcards in this deck.
Unlock Deck
k this deck
7
The side-by-side boxplots show the cumulative college GPAs for sophomores, juniors, and Seniors taking an intro stats course in Autumn 2003.
What is approximately the GPA of
The class with the highest m edian GPA?
A)2.6
B)2.8
C)3.2
D)3.6
E)3.8
What is approximately the GPA of
The class with the highest m edian GPA?
A)2.6
B)2.8
C)3.2
D)3.6
E)3.8
Unlock Deck
Unlock for access to all 28 flashcards in this deck.
Unlock Deck
k this deck
8
A few of the male students are considerably taller than the rest.Describe the effect that these taller males will have on the mean and median of the male distribution.
Unlock Deck
Unlock for access to all 28 flashcards in this deck.
Unlock Deck
k this deck
9
The side-by-side boxplots show the cumulative college GPAs for sophomores, juniors, and
Seniors taking an intro stats course in Autumn 2003.
Which class has the most skewed set of GPAs?
A)Sophomore
B)Junior
C)Senior
D)Both Junior and Senior
Seniors taking an intro stats course in Autumn 2003.
Which class has the most skewed set of GPAs?
A)Sophomore
B)Junior
C)Senior
D)Both Junior and Senior
Unlock Deck
Unlock for access to all 28 flashcards in this deck.
Unlock Deck
k this deck
10
The following boxplots show monthly sales revenue figures ($ thousands) for a discount
Office supply company with locations in three different regions of the U.S.(Northeast,
Southeast, and West).Which of the following statements is true?
A)The Northeast has the lowest mean sales revenue.
B)The Southeast has the lowest median sales revenue.
C)The West has the lowest mean sales revenue.
D)The West has the lowest median sales revenue.
E)None of the above.
Unlock Deck
Unlock for access to all 28 flashcards in this deck.
Unlock Deck
k this deck
11
The following boxplots show monthly sales revenue figures ($ thousands) for a discount
Office supply company with locations in three different regions of the U.S.(Northeast,
Southeast, and West).Which of the following statements is false?
A)The West has the most variable sales revenues.
B)The West has the largest IQR.
C)The Southeast has the smallest IQR.
D)The Northeast has the most variable sales revenues.
Unlock Deck
Unlock for access to all 28 flashcards in this deck.
Unlock Deck
k this deck
12
The side-by-side boxplots show the cumulative college GPAs for sophomores, juniors, and Seniors taking an intro stats course in Autumn 2003.
What is the approximate value of that GPA of the lowest scoring student?
A)1.6
B)1.8
C)2.6
D)2.8
E)3.0
What is the approximate value of that GPA of the lowest scoring student?
A)1.6
B)1.8
C)2.6
D)2.8
E)3.0
Unlock Deck
Unlock for access to all 28 flashcards in this deck.
Unlock Deck
k this deck
13
The side-by-side boxplots show the cumulative college GPAs for sophomores, juniors, and Seniors taking an intro stats course in Autumn 2003.
Which class has the highest median GPA?
A)Sophomore
B)Junior
C)Senior
D)Both Junior and Senior
Which class has the highest median GPA?
A)Sophomore
B)Junior
C)Senior
D)Both Junior and Senior
Unlock Deck
Unlock for access to all 28 flashcards in this deck.
Unlock Deck
k this deck
14
One thousand students from a local university were sampled to gather information such as gender, high school GPA, college GPA, and total SAT scores. The results were used to create histograms displaying high school grade point averages (GPA’s) for both males and females. Compare the grade distribution of males and females.
Unlock Deck
Unlock for access to all 28 flashcards in this deck.
Unlock Deck
k this deck
15
The boxplots show the age of people involved in accidents according to their role in the accident.
a. Which role involved the youngest person, and what is the age?
________________ _____________________
b. Which role had the lowe and what is the age?
_______________ _____________________
c. Which role had and what is it?
________________ _____________
d. Which role had the largest IQR of ages, and what is it?
___________ ______________
e. Which role generally involves the oldest people? Explain.
_____________ __________________
a. Which role involved the youngest person, and what is the age?
________________ _____________________
b. Which role had the lowe and what is the age?
_______________ _____________________
c. Which role had and what is it?
________________ _____________
d. Which role had the largest IQR of ages, and what is it?
___________ ______________
e. Which role generally involves the oldest people? Explain.
_____________ __________________
Unlock Deck
Unlock for access to all 28 flashcards in this deck.
Unlock Deck
k this deck
16
The side-by-side boxplots show the cumulative college GPAs for sophomores, juniors, and
Seniors taking an intro stats course in Autumn 2003.
Which class has the largest range for GPA?
A)Sophomore
B)Junior
C)Senior
D)Both Junior and Senior
E)Both Sophomore and Junior
Seniors taking an intro stats course in Autumn 2003.
Which class has the largest range for GPA?
A)Sophomore
B)Junior
C)Senior
D)Both Junior and Senior
E)Both Sophomore and Junior
Unlock Deck
Unlock for access to all 28 flashcards in this deck.
Unlock Deck
k this deck
17
The body temperature of students is taken each time a student goes to the nurse's office.The five-number summary for the temperatures (in degrees Fahrenheit) of students on a particular day is:
a.Would you expect the mean temperature of all students who visited the nurse's office to be higher or lower than the median? Explain.
b. After the data were picked up in the afternoon, three more students visited the nurse’s
office with temperatures of 96.7º, 98.4º, and 99.2º. Were any of these students outliers?
Explain.
Unlock Deck
Unlock for access to all 28 flashcards in this deck.
Unlock Deck
k this deck
18
The five-number summary for the weights (in pounds) of fish caught in a bass tournament
is:
a.Would you expect the mean weight of all fish caught to be higher or lower than the median? Explain.
b.You caught 3 bass weighing 2.3 pounds, 3.9 pounds, and 4.2 pounds. Were any of your
fish outliers? Explain.
is:
a.Would you expect the mean weight of all fish caught to be higher or lower than the median? Explain.
b.You caught 3 bass weighing 2.3 pounds, 3.9 pounds, and 4.2 pounds. Were any of your
fish outliers? Explain.
Unlock Deck
Unlock for access to all 28 flashcards in this deck.
Unlock Deck
k this deck
19
The side-by-side boxplots show the cumulative college GPAs for sophomores, juniors, and Seniors taking an intro stats course in Autumn 2003.
In which class (sophomore, junior, or senior) do you find the student with the lowest Cumulative college GPA?
A)Sophomore
B)Junior
C)Senior
D)Both Junior and Senior
E)Both Sophomore and Junior
In which class (sophomore, junior, or senior) do you find the student with the lowest Cumulative college GPA?
A)Sophomore
B)Junior
C)Senior
D)Both Junior and Senior
E)Both Sophomore and Junior
Unlock Deck
Unlock for access to all 28 flashcards in this deck.
Unlock Deck
k this deck
20
The five-number summary for midterm scores (number of points; the maximum possible
score was 50 points) from an intro stats class is:
a. Would you expect the mean midterm score of all students who took the midterm to be
higher or lower than the median? Explain.
b. Based on the five-number summary, are any of the midterm scores outliers? Explain.
score was 50 points) from an intro stats class is:
a. Would you expect the mean midterm score of all students who took the midterm to be
higher or lower than the median? Explain.
b. Based on the five-number summary, are any of the midterm scores outliers? Explain.
Unlock Deck
Unlock for access to all 28 flashcards in this deck.
Unlock Deck
k this deck
21
The boxplots show prices of used cars (in thousands of dollars) advertised for sale at three
Different car dealers.Which dealer has the lowest median price, and how much is it?
A)Ace: $15000.
B)BuyIt: $8000.
C)CarZ: $12000.
D)BuyIt: $10000.
E)Cannot say from boxplots only.
Different car dealers.Which dealer has the lowest median price, and how much is it?
A)Ace: $15000.
B)BuyIt: $8000.
C)CarZ: $12000.
D)BuyIt: $10000.
E)Cannot say from boxplots only.
Unlock Deck
Unlock for access to all 28 flashcards in this deck.
Unlock Deck
k this deck
22
The boxplots show prices of used cars (in thousands of dollars) advertised for sale at three Different car dealers.Which dealer offers the cheapest car offered, and at what price?
A)Car Z: $5000.
B)BuyIt: $6000.
C)Ace: $10000.
D)BuyIt: $10000.
E)Cannot say from boxplots only.
A)Car Z: $5000.
B)BuyIt: $6000.
C)Ace: $10000.
D)BuyIt: $10000.
E)Cannot say from boxplots only.
Unlock Deck
Unlock for access to all 28 flashcards in this deck.
Unlock Deck
k this deck
23
How do sports salaries compare? Two sets of histograms below show the distributions of Salaries for Major League Baseball and the National Football League.What set of histograms Makes it easier to compare the distributions? And for what reasons? Check all that apply.
A)Both allow equal comparison.
B)The first set of histograms, because it uses different scales on the axes.
C)The second set of histograms, because it uses the same scales on the axes.
D)The first set of histograms, because it is stacked horizontally.
E) The second set of histograms, because it is stacked vertically
Unlock Deck
Unlock for access to all 28 flashcards in this deck.
Unlock Deck
k this deck
24
At www.census.gov you can create a "population pyramid" for any country.These pyramids Are back-to-back histograms.This pyramid shows Mexico's 2000 female population and the Census bureau's projection for 2050.Check all that apply.
A)The expected mean age in 2050 is higher than the mean age in 2000.
B)The expected median age in 2050 is higher than the median age in 2000.
C)The expected mean age in 2050 is lower than the mean age in 2000.
D)The expected median age in 2050 is lower than the median age in 2000.
E)The IQR of the distribution of projected ages in 2050 is larger than the IQR of the distribution of ages in 2000.
Unlock Deck
Unlock for access to all 28 flashcards in this deck.
Unlock Deck
k this deck
25
At www.census.gov you can create a "population pyramid" for any country.These pyramids Are back-to-back histograms.This pyramid shows Mexico's 2000 female population and the Census bureau's projection for 2050.Check all that apply.
A)The distribution of ages in 2000 is strongly skewed to the left.
B)The distribution of ages in 2000 is strongly skewed to the right.
C)The distribution of projected ages in 2050 is strongly skewed to the left.
D)The distribution of projected ages in 2050 is strongly skewed to the right.
E) The distribution of projected ages in 2050 is approximately uniform
Unlock Deck
Unlock for access to all 28 flashcards in this deck.
Unlock Deck
k this deck
26
The boxplots show prices of used cars (in thousands of dollars) advertised for sale at three
Different car dealers.Which dealer's prices have the smallest IQR, and what is it?
A)CarZ: $3000.
B)CarZ: $8000.
C)Ace: $5000.
D)BuyIt: $5000.
Different car dealers.Which dealer's prices have the smallest IQR, and what is it?
A)CarZ: $3000.
B)CarZ: $8000.
C)Ace: $5000.
D)BuyIt: $5000.
Unlock Deck
Unlock for access to all 28 flashcards in this deck.
Unlock Deck
k this deck
27
The boxplots show prices of used cars (in thousands of dollars) advertised for sale at three
Different car dealers.Which dealer has the smallest price range, and what is it?
A)CarZ: $8000.
B)CarZ: $11000.
C)Ace: $10000.
D)BuyIt: $5000.
E)Cannot say from boxplots only.
Different car dealers.Which dealer has the smallest price range, and what is it?
A)CarZ: $8000.
B)CarZ: $11000.
C)Ace: $10000.
D)BuyIt: $5000.
E)Cannot say from boxplots only.
Unlock Deck
Unlock for access to all 28 flashcards in this deck.
Unlock Deck
k this deck
28
The boxplots show prices of used cars (in thousands of dollars) advertised for sale at three Different car dealers.Which dealer generally sells cars cheapest?
A)CarZ.
B)BuyIt.
C)Ace.
D)Both CarZ and Ace.
E)Cannot say from boxplots only.
A)CarZ.
B)BuyIt.
C)Ace.
D)Both CarZ and Ace.
E)Cannot say from boxplots only.
Unlock Deck
Unlock for access to all 28 flashcards in this deck.
Unlock Deck
k this deck
Unlock Deck
Unlock for access to all 28 flashcards in this deck.


