Deck 9: Inferences Based on Two Samples: Confidence Intervals and Tests of Hypotheses
Full screen (f)
Question
A certain manufacturer is interested in evaluating two alternative manufacturing plans consisting of different machine layouts. Because of union rules, hours of operation vary greatly for this
Particular manufacturer from one day to the next. Twenty-eight random working days were
Selected and each plan was monitored and the number of items produced each day was recorded.
Some of the collected data is shown below: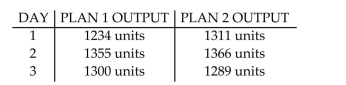 What type of analysis will best allow the manufacturer to determine which plan is more effective?
A)An independent samples comparison of population proportions.
B)A test of a single population proportion.
C)A paired difference comparison of population means.
D)An independent samples comparison of population means.
Particular manufacturer from one day to the next. Twenty-eight random working days were
Selected and each plan was monitored and the number of items produced each day was recorded.
Some of the collected data is shown below:
What type of analysis will best allow the manufacturer to determine which plan is more effective?A)An independent samples comparison of population proportions.
B)A test of a single population proportion.
C)A paired difference comparison of population means.
D)An independent samples comparison of population means.
Question
Question
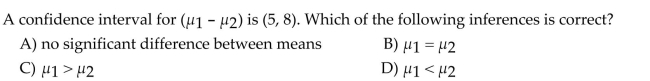
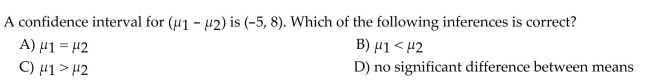
Which of the following represents the difference in two population means? 
Question
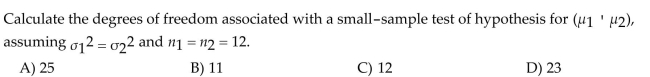
Data was collected from CEOs of companies within both the low-tech industry and the consumer products industry. The following printout compares the mean return-to-pay ratios between CEOs
In the low-tech industry with CEOs in the consumer products industry.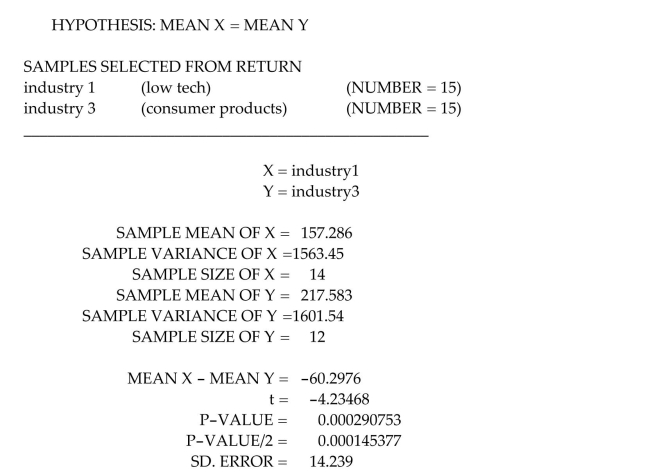 Using the printout, which of the following assumptions is not necessary for the test to be valid?
A)The population means are equal.
B)The population variances are equal.
C)The samples were randomly and independently selected.
D)Both populations have approximately normal distributions.
In the low-tech industry with CEOs in the consumer products industry.
Using the printout, which of the following assumptions is not necessary for the test to be valid?A)The population means are equal.
B)The population variances are equal.
C)The samples were randomly and independently selected.
D)Both populations have approximately normal distributions.
Question
Question
Data was collected from CEOs of companies within both the low-tech industry and the consumer products industry. The following printout compares the mean return-to-pay ratios between CEOs
In the low tech industry with CEOs in the consumer products industry.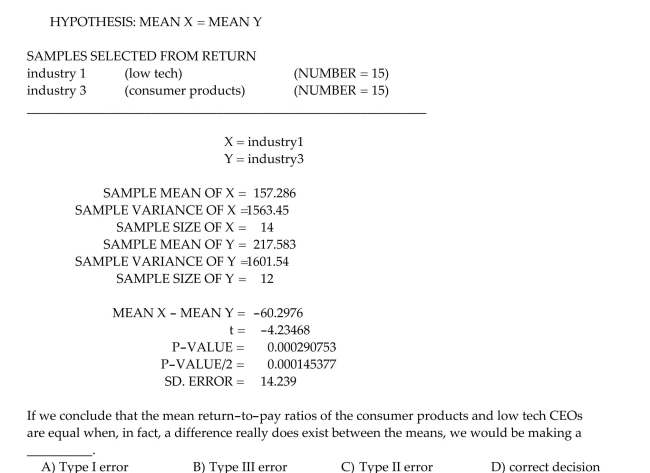
In the low tech industry with CEOs in the consumer products industry.
Question
Question
Question
Salary data were collected from CEOs in the consumer products industry and CEOs in the telecommunication industry. The data were analyzed using a software package in order to
Compare mean salaries of CEOs in the two industries.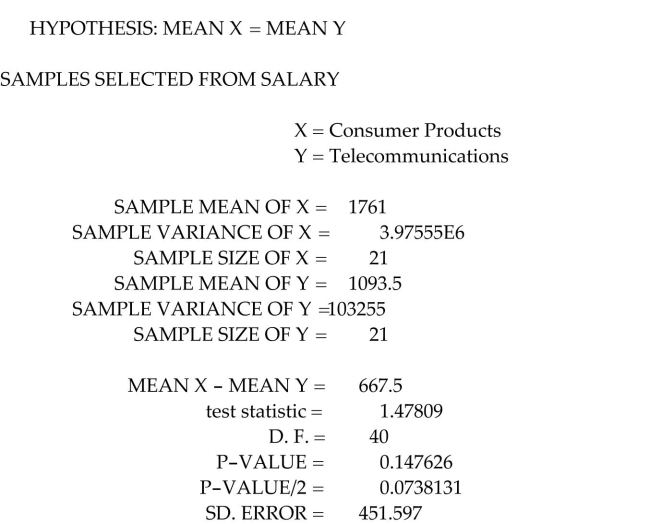 What of the following assumptions is necessary to perform the test described above?
A)The population of salaries for each of the two industries has an approximately normal distribution.
B)The standard deviations of the two populations of salaries are both large.
C)The means of the two populations of salaries are equal.
D)None. The Central Limit Theorem takes care of all assumptions
Compare mean salaries of CEOs in the two industries.
What of the following assumptions is necessary to perform the test described above?A)The population of salaries for each of the two industries has an approximately normal distribution.
B)The standard deviations of the two populations of salaries are both large.
C)The means of the two populations of salaries are equal.
D)None. The Central Limit Theorem takes care of all assumptions
Question
Independent random samples of 100 observations each are chosen from two normal
populations with the following means and standard deviations.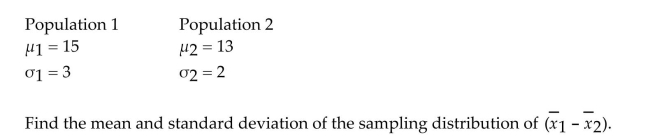
populations with the following means and standard deviations.
Question
In a controlled laboratory environment, a random sample of 10 adults and a random sample of 10 children were tested by a psychologist to determine the room temperature that each person finds
Most comfortable. The data are summarized below: Find the standard error of the estimate for the difference in mean comfortable room temperatures
Between adults and children.
A)1.6279
B)0.7000
C)0.1871
D)0.8367
Most comfortable. The data are summarized below:
Find the standard error of the estimate for the difference in mean comfortable room temperaturesBetween adults and children.
A)1.6279
B)0.7000
C)0.1871
D)0.8367
Question
Question
Consider the following set of salary data: 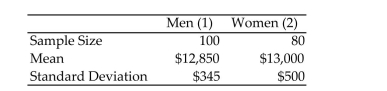 What assumptions are necessary to perform a test for the difference in population means?
A)The two samples were independently selected from the populations of men and women.
B)The population variances of salaries for men and women are equal.
C)Both of the target populations have approximately normal distributions.
D)All of the above are necessary.
What assumptions are necessary to perform a test for the difference in population means?A)The two samples were independently selected from the populations of men and women.
B)The population variances of salaries for men and women are equal.
C)Both of the target populations have approximately normal distributions.
D)All of the above are necessary.
Question
Which of the following represents the difference in two population proportions? 
Question
Question

Question
In a controlled laboratory environment, a random sample of 10 adults and a random sample of 10 children were tested by a psychologist to determine the room temperature that each person finds
Most comfortable. The data are summarized below: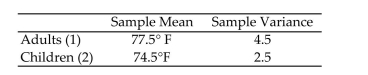 Suppose that the psychologist decides to construct a 99% confidence interval for the difference in
Mean comfortable room temperatures instead of proceeding with a test of hypothesis. The 99%
Confidence interval turns out to be (-2.9, 3.1). Select the correct statement.
A)It can be concluded at the 99% confidence level that the true mean comfortable room temperature for children exceeds that for adults.
B)It can be concluded at the 99% confidence level that the true mean comfortable room temperature is between -2.9 and 3.1.
C)It cannot be concluded at the 99% confidence level that there is actually a difference between the true mean comfortable room temperatures for the two groups.
D)It can be concluded at the 99% confidence level that the true mean room temperature for adults exceeds that for children.
Most comfortable. The data are summarized below:
Suppose that the psychologist decides to construct a 99% confidence interval for the difference inMean comfortable room temperatures instead of proceeding with a test of hypothesis. The 99%
Confidence interval turns out to be (-2.9, 3.1). Select the correct statement.
A)It can be concluded at the 99% confidence level that the true mean comfortable room temperature for children exceeds that for adults.
B)It can be concluded at the 99% confidence level that the true mean comfortable room temperature is between -2.9 and 3.1.
C)It cannot be concluded at the 99% confidence level that there is actually a difference between the true mean comfortable room temperatures for the two groups.
D)It can be concluded at the 99% confidence level that the true mean room temperature for adults exceeds that for children.
Question
Which of the following represents the ratio of variances? 
Question
Question
Question
Consider the following set of salary data: 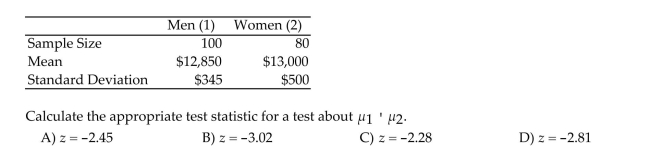
Question
In a controlled laboratory environment, a random sample of 10 adults and a random sample of 10 children were tested by a psychologist to determine the room temperature that each person finds
Most comfortable. The data are summarized below: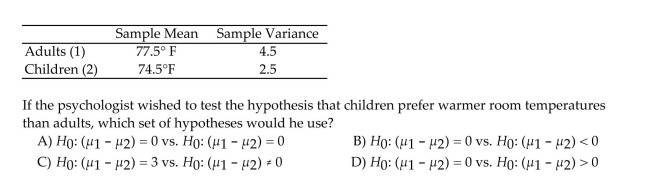
Most comfortable. The data are summarized below:
Question
Question
Data were collected from CEOs in the consumer products industry and CEOs in the telecommunication industry. The data were analyzed using a software package in order to
Compare mean salaries of CEOs in the two industries.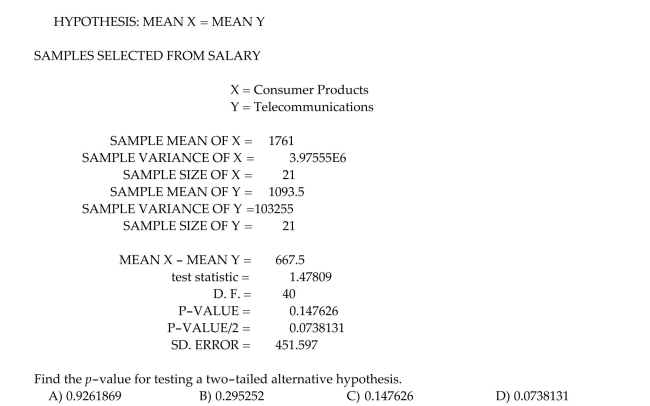
Compare mean salaries of CEOs in the two industries.
Question
The owners of an industrial plant want to determine which of two types of fuel (gas or electricity) will produce more useful energy at a lower cost. The cost is measured by plant investment per
Delivered quad ($ invested /quadrillion BTUs). The smaller this number, the less the industrial
Plant pays for delivered energy. Suppose we wish to determine if there is a difference in the
Average investment/quad between using electricity and using gas. Our null and alternative
Hypotheses would be:
Question
Independent random samples selected from two normal populations produced the
following sample means and standard deviations.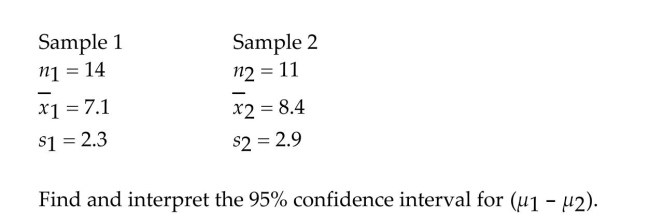
following sample means and standard deviations.
Question
Question
Data was collected from CEOs of companies within both the low-tech industry and the consumer products industry. The following printout compares the mean return-to-pay ratios between CEOs
In the low-tech industry and CEOs in the consumer products industry.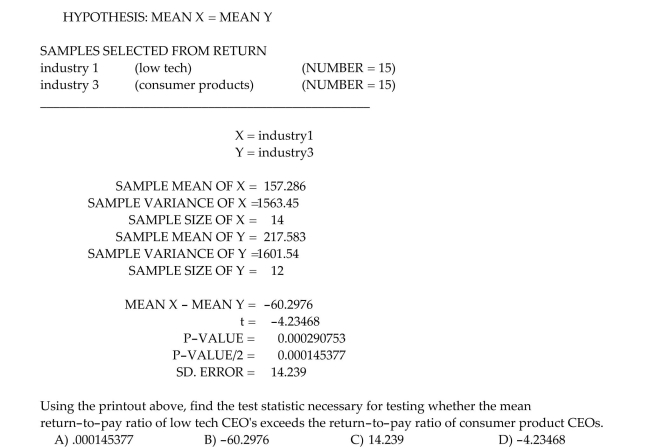
In the low-tech industry and CEOs in the consumer products industry.
Question
In order to compare the means of two populations, independent random samples of 144
observations are selected from each population with the following results.
observations are selected from each population with the following results.
Question
Consider the following set of salary data: 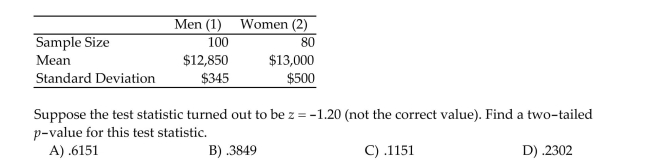
Question

Question

Question
Data were collected from CEOs in the consumer products industry and the CEOs in the telecommunication industry. The data were analyzed using a software package in order to
Compare mean salaries of CEOs in the two industries.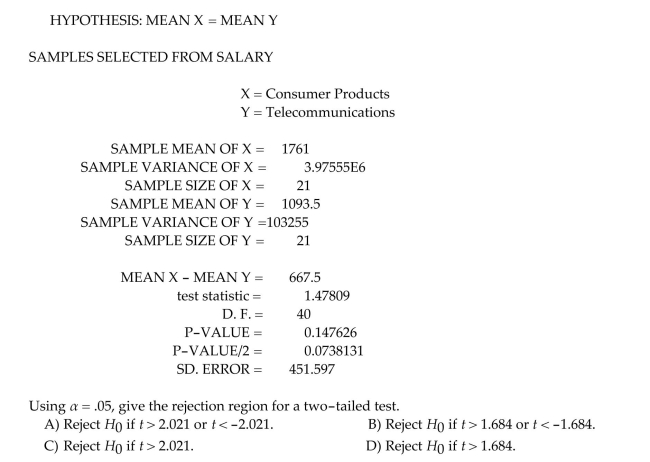
Compare mean salaries of CEOs in the two industries.
Question
Independent random samples from normal populations produced the results shown
below.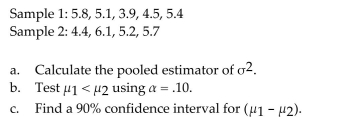
below.
Question
Consider the following set of salary data: 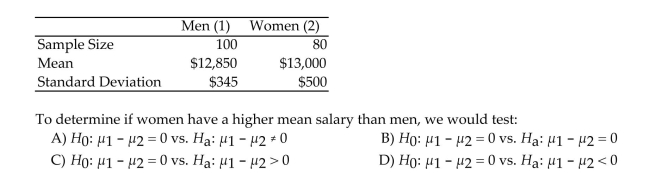
Question
A marketing study was conducted to compare the mean age of male and female purchasers of a certain product. Random and independent samples were selected for both male and female
Purchasers of the product. It was desired to test to determine if the mean age of all female
Purchasers exceeds the mean age of all male purchasers. The sample data is shown here: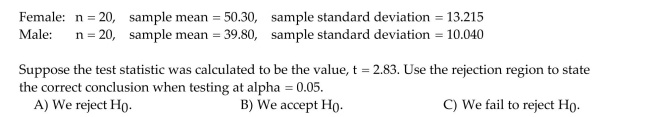
Purchasers of the product. It was desired to test to determine if the mean age of all female
Purchasers exceeds the mean age of all male purchasers. The sample data is shown here:
Question

Question
In order to compare the means of two populations, independent random samples of 225
observations are selected from each population with the following results.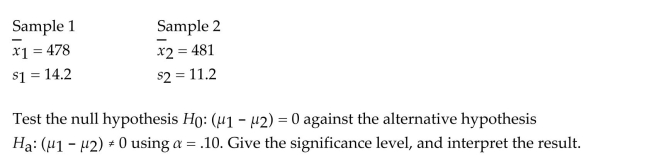
observations are selected from each population with the following results.
Question
Question
A marketing study was conducted to compare the mean age of male and female purchasers of a certain product. Random and independent samples were selected for both male and female
Purchasers of the product. It was desired to test to determine if the mean age of all female
Purchasers exceeds the mean age of all male purchasers. The sample data is shown here: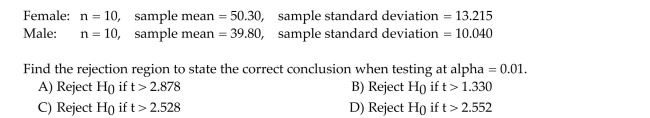
Purchasers of the product. It was desired to test to determine if the mean age of all female
Purchasers exceeds the mean age of all male purchasers. The sample data is shown here:
Question
A marketing study was conducted to compare the mean age of male and female purchasers of a certain product. Random and independent samples were selected for both male and female
Purchasers of the product. It was desired to test to determine if the mean age of all female
Purchasers exceeds the mean age of all male purchasers. The sample data is shown here: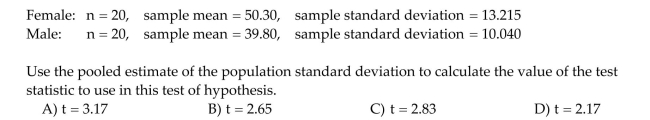
Purchasers of the product. It was desired to test to determine if the mean age of all female
Purchasers exceeds the mean age of all male purchasers. The sample data is shown here:
Question
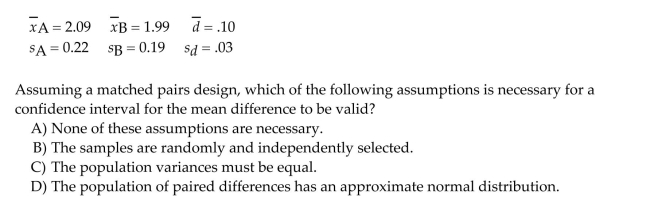
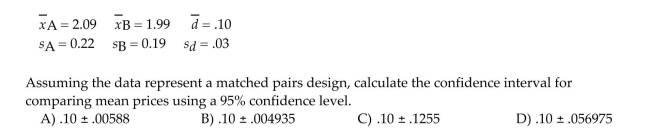
We are interested in comparing the average supermarket prices of two leading colas. Our sample was taken by randomly selecting eight supermarkets and recording the price of a six-pack of each
Brand of cola at each supermarket. The data are shown in the following table: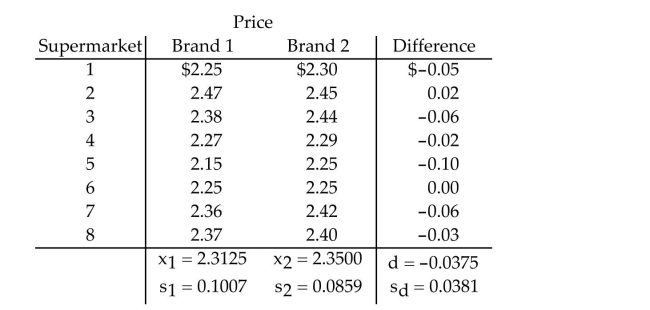 If the problem above represented a paired difference, what assumptions are needed for a
Confidence interval for the mean difference to be valid?
A)The population variances are equal.
B)The population of paired differences has an approximately normal distribution.
C)The samples were independently selected from each population.
D)All of the above are needed.
Brand of cola at each supermarket. The data are shown in the following table:
If the problem above represented a paired difference, what assumptions are needed for aConfidence interval for the mean difference to be valid?
A)The population variances are equal.
B)The population of paired differences has an approximately normal distribution.
C)The samples were independently selected from each population.
D)All of the above are needed.
Question
Which supermarket has the lowest prices in town? All claim to be cheaper, but an independent agency recently was asked to investigate this question. The agency randomly selected 100 items
Common to each of two supermarkets (labeled A and B)and recorded the prices charged by each
Supermarket. The summary results are provided below:
Common to each of two supermarkets (labeled A and B)and recorded the prices charged by each
Supermarket. The summary results are provided below:
Question
Independent random samples selected from two normal populations produced the
following sample means and standard deviations.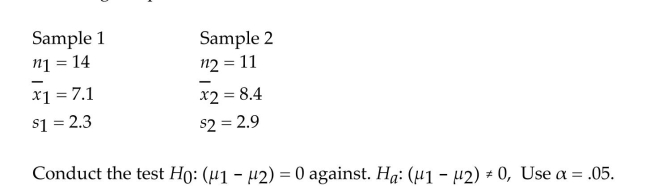
following sample means and standard deviations.
Question
Question
A new weight-reducing technique, consisting of a liquid protein diet, is currently
undergoing tests by the Food and Drug Administration (FDA)before its introduction into
the market. The weights of a random sample of five people are recorded before they are
introduced to the liquid protein diet. The five individuals are then instructed to follow the
liquid protein diet for 3 weeks. At the end of this period, their weights (in pounds)are
again recorded. The results are listed in the table. Let μ1 be the true mean weight of
individuals before starting the diet and let μ2 be the true mean weight of individuals after
3 weeks on the diet.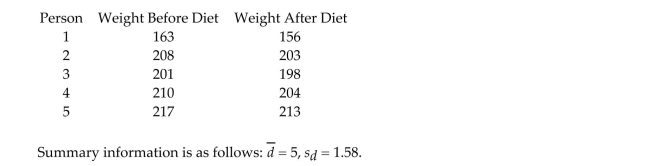 Calculate a 90% confidence interval for the difference between the mean weights before
and after the diet is used.
undergoing tests by the Food and Drug Administration (FDA)before its introduction into
the market. The weights of a random sample of five people are recorded before they are
introduced to the liquid protein diet. The five individuals are then instructed to follow the
liquid protein diet for 3 weeks. At the end of this period, their weights (in pounds)are
again recorded. The results are listed in the table. Let μ1 be the true mean weight of
individuals before starting the diet and let μ2 be the true mean weight of individuals after
3 weeks on the diet.
Calculate a 90% confidence interval for the difference between the mean weights beforeand after the diet is used.
Question
Question

Question
We are interested in comparing the average supermarket prices of two leading colas. Our sample was taken by randomly selecting eight supermarkets and recording the price of a six-pack of each
Brand of cola at each supermarket. The data are shown in the following table: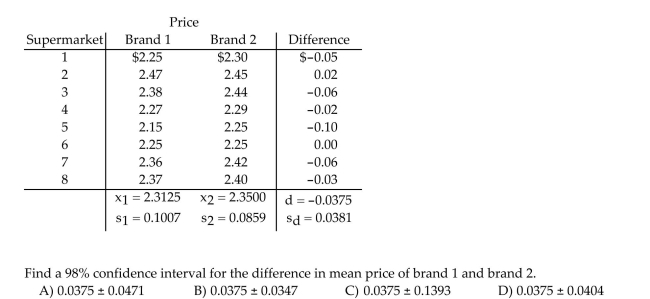
Brand of cola at each supermarket. The data are shown in the following table:
Question
Question
Using paired differences removes sources of variation that tend to inflate 
Question
Question
Question
The data for a random sample of five paired observations are shown below. 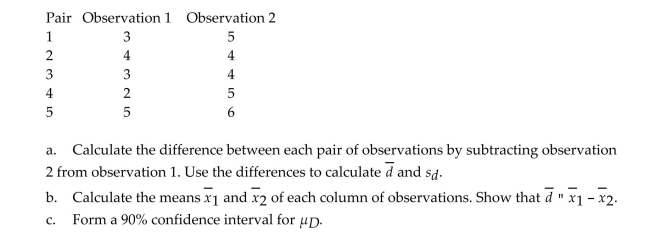
Question

Question
Question
Which supermarket has the lowest prices in town? All claim to be cheaper, but an independent agency recently was asked to investigate this question. The agency randomly selected 100 items
Common to each of two supermarkets (labeled A and
B)and recorded the prices charged by each supermarket. The summary results are provided below:
Common to each of two supermarkets (labeled A and
B)and recorded the prices charged by each supermarket. The summary results are provided below:
Question
The data for a random sample of six paired observations are shown below. 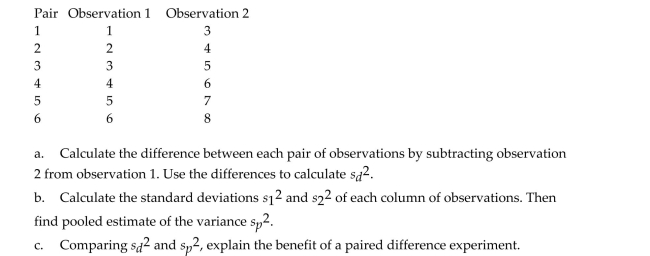
Question
A certain manufacturer is interested in evaluating two alternative manufacturing plans consisting of different machine layouts. Because of union rules, hours of operation vary greatly for this
Particular manufacturer from one day to the next. Twenty-eight random working days were
Selected and each plan was monitored and the number of items produced each day was recorded.
Some of the collected data is shown below: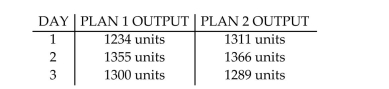 What assumptions are necessary for the above test to be valid?
A)None of these listed, since the Central Limit Theorem can be applied.
B)The population variances must be approximately equal.
C)Both populations must be approximately normally distributed.
D)The population of paired differences must be approximately normally distributed.
Particular manufacturer from one day to the next. Twenty-eight random working days were
Selected and each plan was monitored and the number of items produced each day was recorded.
Some of the collected data is shown below:
What assumptions are necessary for the above test to be valid?A)None of these listed, since the Central Limit Theorem can be applied.
B)The population variances must be approximately equal.
C)Both populations must be approximately normally distributed.
D)The population of paired differences must be approximately normally distributed.
Question
An inventor has developed a new spray coating that is designed to improve the wear of bicycle tires. To test the new coating, the inventor randomly selects one of the two tires on each of 50
Bicycles to be coated with the new spray. The bicycle is then driven for 100 miles and the amount
Of the depth of the tread left on the two bicycle tires is measured (in millimeters). It is desired to
Determine whether the new spray coating improves the wear of the bicycle tires. The data and
Summary information is shown below: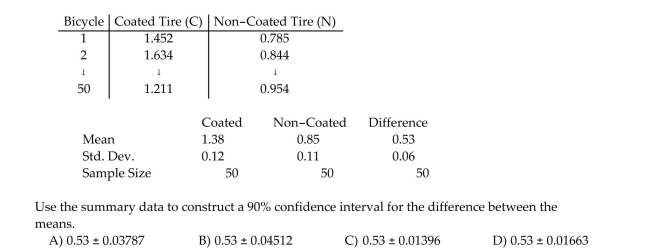
Question
Question
An inventor has developed a new spray coating that is designed to improve the wear of bicycle tires. To test the new coating, the inventor randomly selects one of the two tires on each of 50
Bicycles to be coated with the new spray. The bicycle is then driven for 100 miles and the amount
Of the depth of the tread left on the two bicycle tires is measured (in millimeters). It is desired to
Determine whether the new spray coating improves the wear of the bicycle tires. The data and
Summary information is shown below: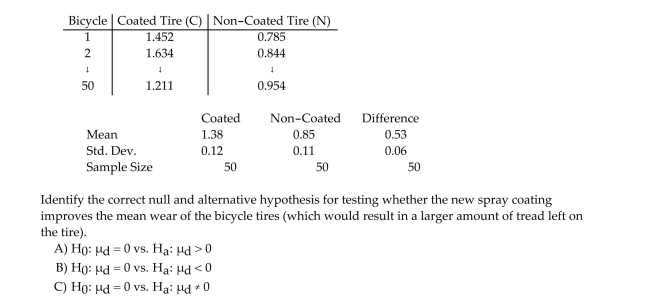
Bicycles to be coated with the new spray. The bicycle is then driven for 100 miles and the amount
Of the depth of the tread left on the two bicycle tires is measured (in millimeters). It is desired to
Determine whether the new spray coating improves the wear of the bicycle tires. The data and
Summary information is shown below:
Question
An inventor has developed a new spray coating that is designed to improve the wear of bicycle tires. To test the new coating, the inventor randomly selects one of the two tires on each of 50
Bicycles to be coated with the new spray. The bicycle is then driven for 100 miles and the amount
Of the depth of the tread left on the two bicycle tires is measured (in millimeters). It is desired to
Determine whether the new spray coating improves the wear of the bicycle tires. The data and
Summary information is shown below: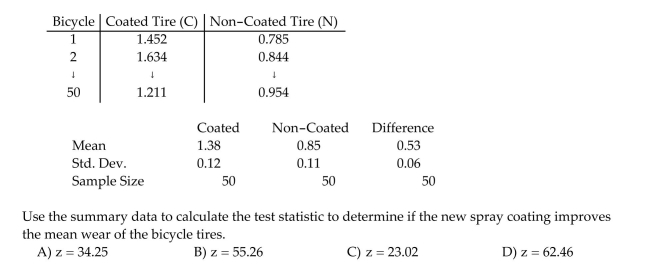
Bicycles to be coated with the new spray. The bicycle is then driven for 100 miles and the amount
Of the depth of the tread left on the two bicycle tires is measured (in millimeters). It is desired to
Determine whether the new spray coating improves the wear of the bicycle tires. The data and
Summary information is shown below:
Question
Question
Determine whether the sample sizes are large enough to conclude that the sampling
distributions are approximately normal.
distributions are approximately normal.
Question

Question
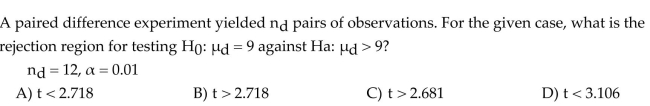
A paired difference experiment produced the following results. 
Question

Question
A cola manufacturer invited consumers to take a blind taste test. Consumers were asked to decide which of two sodas they preferred. The manufacturer was also interested in what factors played a
Role in taste preferences. Below is a printout comparing the taste preferences of men and women.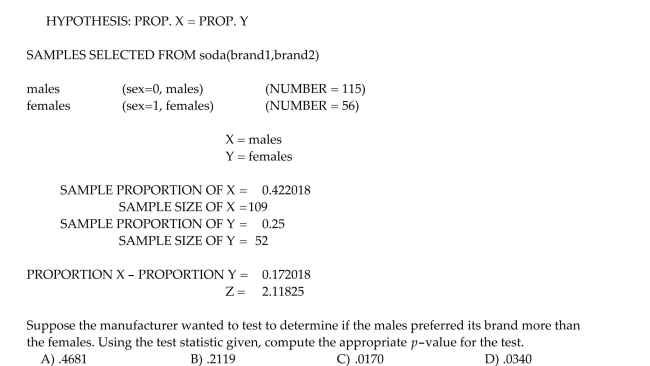
Role in taste preferences. Below is a printout comparing the taste preferences of men and women.
Question
Question
One indication of how strong the real estate market is performing is the proportion of
properties that sell in less than 30 days after being listed. Of the condominiums in a
Florida beach community that sold in the first six months of 2006, 75 of the 115 sampled
had been on the market less than 30 days. For the first six months of 2007, 25 of the 85
sampled had been on the market less than 30 days. Test the hypothesis that the proportion
of condominiums that sold within 30 days decreased from 2006 to
Question
Question
Question

Question
Question
Question
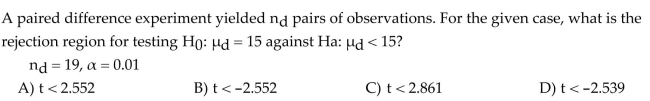
A paired difference experiment yielded the following results. 
Question
Question
Question
Determine whether the sample sizes are large enough to conclude that the sampling
distributions are approximately normal.
distributions are approximately normal.

Unlock Deck
Sign up to unlock the cards in this deck!
Unlock Deck
Unlock Deck
1/100
Play
Full screen (f)
Deck 9: Inferences Based on Two Samples: Confidence Intervals and Tests of Hypotheses
1
A certain manufacturer is interested in evaluating two alternative manufacturing plans consisting of different machine layouts. Because of union rules, hours of operation vary greatly for this
Particular manufacturer from one day to the next. Twenty-eight random working days were
Selected and each plan was monitored and the number of items produced each day was recorded.
Some of the collected data is shown below: What type of analysis will best allow the manufacturer to determine which plan is more effective?
A)An independent samples comparison of population proportions.
B)A test of a single population proportion.
C)A paired difference comparison of population means.
D)An independent samples comparison of population means.
Particular manufacturer from one day to the next. Twenty-eight random working days were
Selected and each plan was monitored and the number of items produced each day was recorded.
Some of the collected data is shown below:
What type of analysis will best allow the manufacturer to determine which plan is more effective?A)An independent samples comparison of population proportions.
B)A test of a single population proportion.
C)A paired difference comparison of population means.
D)An independent samples comparison of population means.
C
2
C
3
Which of the following represents the difference in two population means?
D
4
Data was collected from CEOs of companies within both the low-tech industry and the consumer products industry. The following printout compares the mean return-to-pay ratios between CEOs
In the low-tech industry with CEOs in the consumer products industry. Using the printout, which of the following assumptions is not necessary for the test to be valid?
A)The population means are equal.
B)The population variances are equal.
C)The samples were randomly and independently selected.
D)Both populations have approximately normal distributions.
In the low-tech industry with CEOs in the consumer products industry.
Using the printout, which of the following assumptions is not necessary for the test to be valid?A)The population means are equal.
B)The population variances are equal.
C)The samples were randomly and independently selected.
D)Both populations have approximately normal distributions.
Unlock Deck
Unlock for access to all 100 flashcards in this deck.
Unlock Deck
k this deck
5
Unlock Deck
Unlock for access to all 100 flashcards in this deck.
Unlock Deck
k this deck
6
Data was collected from CEOs of companies within both the low-tech industry and the consumer products industry. The following printout compares the mean return-to-pay ratios between CEOs
In the low tech industry with CEOs in the consumer products industry.
In the low tech industry with CEOs in the consumer products industry.
Unlock Deck
Unlock for access to all 100 flashcards in this deck.
Unlock Deck
k this deck
7
A marketing study was conducted to compare the mean age of male and female purchasers of a certain product. Random and independent samples were selected for both male and female
Purchasers of the product. It was desired to test to determine if the mean age of all female
Purchasers exceeds the mean age of all male purchasers. The sample data is shown here:
Female: n = 10, sample mean = 50.30, sample standard deviation = 13.215
Male: n = 10, sample mean = 39.80, sample standard deviation = 10.040
Which of the following assumptions must be true in order for the pooled test of hypothesis to be
Valid?
I. Both the male and female populations of ages must possess approximately normal probability
Distributions.
II. Both the male and female populations of ages must possess population variances that are
Equal.
III. Both samples of ages must have been randomly and independently selected from their
Respective populations.
A)I only
B)I, II, and III
C)II only
D)III only
Unlock Deck
Unlock for access to all 100 flashcards in this deck.
Unlock Deck
k this deck
8
Unlock Deck
Unlock for access to all 100 flashcards in this deck.
Unlock Deck
k this deck
9
Salary data were collected from CEOs in the consumer products industry and CEOs in the telecommunication industry. The data were analyzed using a software package in order to
Compare mean salaries of CEOs in the two industries. What of the following assumptions is necessary to perform the test described above?
A)The population of salaries for each of the two industries has an approximately normal distribution.
B)The standard deviations of the two populations of salaries are both large.
C)The means of the two populations of salaries are equal.
D)None. The Central Limit Theorem takes care of all assumptions
Compare mean salaries of CEOs in the two industries.
What of the following assumptions is necessary to perform the test described above?A)The population of salaries for each of the two industries has an approximately normal distribution.
B)The standard deviations of the two populations of salaries are both large.
C)The means of the two populations of salaries are equal.
D)None. The Central Limit Theorem takes care of all assumptions
Unlock Deck
Unlock for access to all 100 flashcards in this deck.
Unlock Deck
k this deck
10
Independent random samples of 100 observations each are chosen from two normal
populations with the following means and standard deviations.
populations with the following means and standard deviations.
Unlock Deck
Unlock for access to all 100 flashcards in this deck.
Unlock Deck
k this deck
11
In a controlled laboratory environment, a random sample of 10 adults and a random sample of 10 children were tested by a psychologist to determine the room temperature that each person finds
Most comfortable. The data are summarized below: Find the standard error of the estimate for the difference in mean comfortable room temperatures
Between adults and children.
A)1.6279
B)0.7000
C)0.1871
D)0.8367
Most comfortable. The data are summarized below:
Find the standard error of the estimate for the difference in mean comfortable room temperaturesBetween adults and children.
A)1.6279
B)0.7000
C)0.1871
D)0.8367
Unlock Deck
Unlock for access to all 100 flashcards in this deck.
Unlock Deck
k this deck
12
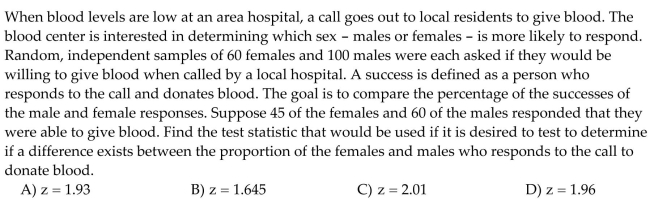
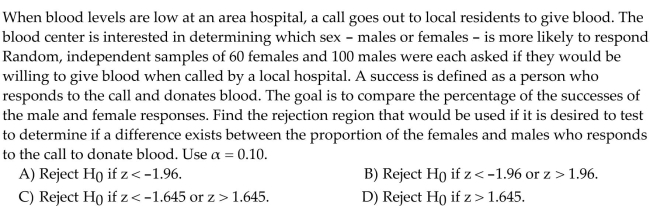
When blood levels are low at an area hospital, a call goes out to local residents to give blood. The blood center is interested in determining which sex - males or females - is more likely to respond.
Random, independent samples of 60 females and 100 males were each asked if they would be
Willing to give blood when called by a local hospital. A success is defined as a person who
Responds to the call and donates blood. The goal is to compare the percentage of the successes
Between the male and female responses. What type of analysis should be used?
A)A test of a single population proportion.
B)An independent samples comparison of population means.
C)An independent samples comparison of population proportions.
D)A paired difference comparison of population means.
Unlock Deck
Unlock for access to all 100 flashcards in this deck.
Unlock Deck
k this deck
13
Consider the following set of salary data: What assumptions are necessary to perform a test for the difference in population means?
A)The two samples were independently selected from the populations of men and women.
B)The population variances of salaries for men and women are equal.
C)Both of the target populations have approximately normal distributions.
D)All of the above are necessary.
What assumptions are necessary to perform a test for the difference in population means?A)The two samples were independently selected from the populations of men and women.
B)The population variances of salaries for men and women are equal.
C)Both of the target populations have approximately normal distributions.
D)All of the above are necessary.
Unlock Deck
Unlock for access to all 100 flashcards in this deck.
Unlock Deck
k this deck
14
Which of the following represents the difference in two population proportions?
Unlock Deck
Unlock for access to all 100 flashcards in this deck.
Unlock Deck
k this deck
15
Unlock Deck
Unlock for access to all 100 flashcards in this deck.
Unlock Deck
k this deck
16
Unlock Deck
Unlock for access to all 100 flashcards in this deck.
Unlock Deck
k this deck
17
In a controlled laboratory environment, a random sample of 10 adults and a random sample of 10 children were tested by a psychologist to determine the room temperature that each person finds
Most comfortable. The data are summarized below: Suppose that the psychologist decides to construct a 99% confidence interval for the difference in
Mean comfortable room temperatures instead of proceeding with a test of hypothesis. The 99%
Confidence interval turns out to be (-2.9, 3.1). Select the correct statement.
A)It can be concluded at the 99% confidence level that the true mean comfortable room temperature for children exceeds that for adults.
B)It can be concluded at the 99% confidence level that the true mean comfortable room temperature is between -2.9 and 3.1.
C)It cannot be concluded at the 99% confidence level that there is actually a difference between the true mean comfortable room temperatures for the two groups.
D)It can be concluded at the 99% confidence level that the true mean room temperature for adults exceeds that for children.
Most comfortable. The data are summarized below:
Suppose that the psychologist decides to construct a 99% confidence interval for the difference inMean comfortable room temperatures instead of proceeding with a test of hypothesis. The 99%
Confidence interval turns out to be (-2.9, 3.1). Select the correct statement.
A)It can be concluded at the 99% confidence level that the true mean comfortable room temperature for children exceeds that for adults.
B)It can be concluded at the 99% confidence level that the true mean comfortable room temperature is between -2.9 and 3.1.
C)It cannot be concluded at the 99% confidence level that there is actually a difference between the true mean comfortable room temperatures for the two groups.
D)It can be concluded at the 99% confidence level that the true mean room temperature for adults exceeds that for children.
Unlock Deck
Unlock for access to all 100 flashcards in this deck.
Unlock Deck
k this deck
18
Which of the following represents the ratio of variances?
Unlock Deck
Unlock for access to all 100 flashcards in this deck.
Unlock Deck
k this deck
19
Unlock Deck
Unlock for access to all 100 flashcards in this deck.
Unlock Deck
k this deck
20
A marketing study was conducted to compare the mean age of male and female purchasers of a certain product. Random and independent samples were selected for both male and female
Purchasers of the product. What type of analysis should be used to compare the mean age of male
And female purchasers?
A)A paired difference comparison of population means.
B)An independent samples comparison of population means.
C)A test of a single population mean.
D)An independent samples comparison of population proportions.
Unlock Deck
Unlock for access to all 100 flashcards in this deck.
Unlock Deck
k this deck
21
Consider the following set of salary data:
Unlock Deck
Unlock for access to all 100 flashcards in this deck.
Unlock Deck
k this deck
22
In a controlled laboratory environment, a random sample of 10 adults and a random sample of 10 children were tested by a psychologist to determine the room temperature that each person finds
Most comfortable. The data are summarized below:
Most comfortable. The data are summarized below:
Unlock Deck
Unlock for access to all 100 flashcards in this deck.
Unlock Deck
k this deck
23
Unlock Deck
Unlock for access to all 100 flashcards in this deck.
Unlock Deck
k this deck
24
Data were collected from CEOs in the consumer products industry and CEOs in the telecommunication industry. The data were analyzed using a software package in order to
Compare mean salaries of CEOs in the two industries.
Compare mean salaries of CEOs in the two industries.
Unlock Deck
Unlock for access to all 100 flashcards in this deck.
Unlock Deck
k this deck
25
The owners of an industrial plant want to determine which of two types of fuel (gas or electricity) will produce more useful energy at a lower cost. The cost is measured by plant investment per
Delivered quad ($ invested /quadrillion BTUs). The smaller this number, the less the industrial
Plant pays for delivered energy. Suppose we wish to determine if there is a difference in the
Average investment/quad between using electricity and using gas. Our null and alternative
Hypotheses would be:
Delivered quad ($ invested /quadrillion BTUs). The smaller this number, the less the industrial
Plant pays for delivered energy. Suppose we wish to determine if there is a difference in the
Average investment/quad between using electricity and using gas. Our null and alternative
Hypotheses would be:
Unlock Deck
Unlock for access to all 100 flashcards in this deck.
Unlock Deck
k this deck
26
Independent random samples selected from two normal populations produced the
following sample means and standard deviations.
following sample means and standard deviations.
Unlock Deck
Unlock for access to all 100 flashcards in this deck.
Unlock Deck
k this deck
27
Unlock Deck
Unlock for access to all 100 flashcards in this deck.
Unlock Deck
k this deck
28
Data was collected from CEOs of companies within both the low-tech industry and the consumer products industry. The following printout compares the mean return-to-pay ratios between CEOs
In the low-tech industry and CEOs in the consumer products industry.
In the low-tech industry and CEOs in the consumer products industry.
Unlock Deck
Unlock for access to all 100 flashcards in this deck.
Unlock Deck
k this deck
29
In order to compare the means of two populations, independent random samples of 144
observations are selected from each population with the following results.
observations are selected from each population with the following results.
Unlock Deck
Unlock for access to all 100 flashcards in this deck.
Unlock Deck
k this deck
30
Consider the following set of salary data:
Unlock Deck
Unlock for access to all 100 flashcards in this deck.
Unlock Deck
k this deck
31
Unlock Deck
Unlock for access to all 100 flashcards in this deck.
Unlock Deck
k this deck
32
Unlock Deck
Unlock for access to all 100 flashcards in this deck.
Unlock Deck
k this deck
33
Data were collected from CEOs in the consumer products industry and the CEOs in the telecommunication industry. The data were analyzed using a software package in order to
Compare mean salaries of CEOs in the two industries.
Compare mean salaries of CEOs in the two industries.
Unlock Deck
Unlock for access to all 100 flashcards in this deck.
Unlock Deck
k this deck
34
Independent random samples from normal populations produced the results shown
below.
below.
Unlock Deck
Unlock for access to all 100 flashcards in this deck.
Unlock Deck
k this deck
35
Consider the following set of salary data:
Unlock Deck
Unlock for access to all 100 flashcards in this deck.
Unlock Deck
k this deck
36
A marketing study was conducted to compare the mean age of male and female purchasers of a certain product. Random and independent samples were selected for both male and female
Purchasers of the product. It was desired to test to determine if the mean age of all female
Purchasers exceeds the mean age of all male purchasers. The sample data is shown here:
Purchasers of the product. It was desired to test to determine if the mean age of all female
Purchasers exceeds the mean age of all male purchasers. The sample data is shown here:
Unlock Deck
Unlock for access to all 100 flashcards in this deck.
Unlock Deck
k this deck
37
Unlock Deck
Unlock for access to all 100 flashcards in this deck.
Unlock Deck
k this deck
38
In order to compare the means of two populations, independent random samples of 225
observations are selected from each population with the following results.
observations are selected from each population with the following results.
Unlock Deck
Unlock for access to all 100 flashcards in this deck.
Unlock Deck
k this deck
39
Unlock Deck
Unlock for access to all 100 flashcards in this deck.
Unlock Deck
k this deck
40
A marketing study was conducted to compare the mean age of male and female purchasers of a certain product. Random and independent samples were selected for both male and female
Purchasers of the product. It was desired to test to determine if the mean age of all female
Purchasers exceeds the mean age of all male purchasers. The sample data is shown here:
Purchasers of the product. It was desired to test to determine if the mean age of all female
Purchasers exceeds the mean age of all male purchasers. The sample data is shown here:
Unlock Deck
Unlock for access to all 100 flashcards in this deck.
Unlock Deck
k this deck
41
A marketing study was conducted to compare the mean age of male and female purchasers of a certain product. Random and independent samples were selected for both male and female
Purchasers of the product. It was desired to test to determine if the mean age of all female
Purchasers exceeds the mean age of all male purchasers. The sample data is shown here:
Purchasers of the product. It was desired to test to determine if the mean age of all female
Purchasers exceeds the mean age of all male purchasers. The sample data is shown here:
Unlock Deck
Unlock for access to all 100 flashcards in this deck.
Unlock Deck
k this deck
42
We are interested in comparing the average supermarket prices of two leading colas. Our sample was taken by randomly selecting eight supermarkets and recording the price of a six-pack of each
Brand of cola at each supermarket. The data are shown in the following table: If the problem above represented a paired difference, what assumptions are needed for a
Confidence interval for the mean difference to be valid?
A)The population variances are equal.
B)The population of paired differences has an approximately normal distribution.
C)The samples were independently selected from each population.
D)All of the above are needed.
Brand of cola at each supermarket. The data are shown in the following table:
If the problem above represented a paired difference, what assumptions are needed for aConfidence interval for the mean difference to be valid?
A)The population variances are equal.
B)The population of paired differences has an approximately normal distribution.
C)The samples were independently selected from each population.
D)All of the above are needed.
Unlock Deck
Unlock for access to all 100 flashcards in this deck.
Unlock Deck
k this deck
43
Which supermarket has the lowest prices in town? All claim to be cheaper, but an independent agency recently was asked to investigate this question. The agency randomly selected 100 items
Common to each of two supermarkets (labeled A and B)and recorded the prices charged by each
Supermarket. The summary results are provided below:
Common to each of two supermarkets (labeled A and B)and recorded the prices charged by each
Supermarket. The summary results are provided below:
Unlock Deck
Unlock for access to all 100 flashcards in this deck.
Unlock Deck
k this deck
44
Independent random samples selected from two normal populations produced the
following sample means and standard deviations.
following sample means and standard deviations.
Unlock Deck
Unlock for access to all 100 flashcards in this deck.
Unlock Deck
k this deck
45
Unlock Deck
Unlock for access to all 100 flashcards in this deck.
Unlock Deck
k this deck
46
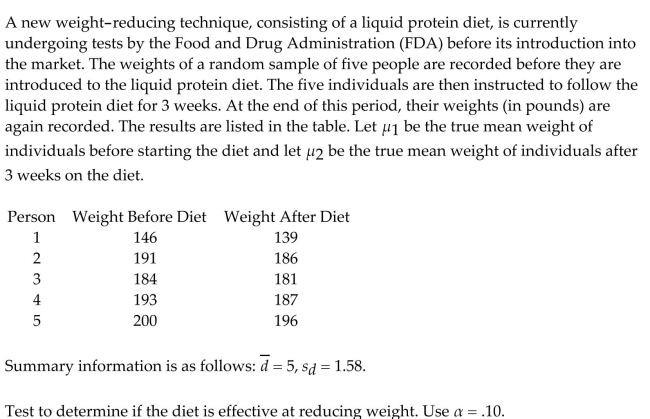
A new weight-reducing technique, consisting of a liquid protein diet, is currently
undergoing tests by the Food and Drug Administration (FDA)before its introduction into
the market. The weights of a random sample of five people are recorded before they are
introduced to the liquid protein diet. The five individuals are then instructed to follow the
liquid protein diet for 3 weeks. At the end of this period, their weights (in pounds)are
again recorded. The results are listed in the table. Let μ1 be the true mean weight of
individuals before starting the diet and let μ2 be the true mean weight of individuals after
3 weeks on the diet. Calculate a 90% confidence interval for the difference between the mean weights before
and after the diet is used.
undergoing tests by the Food and Drug Administration (FDA)before its introduction into
the market. The weights of a random sample of five people are recorded before they are
introduced to the liquid protein diet. The five individuals are then instructed to follow the
liquid protein diet for 3 weeks. At the end of this period, their weights (in pounds)are
again recorded. The results are listed in the table. Let μ1 be the true mean weight of
individuals before starting the diet and let μ2 be the true mean weight of individuals after
3 weeks on the diet.
Calculate a 90% confidence interval for the difference between the mean weights beforeand after the diet is used.
Unlock Deck
Unlock for access to all 100 flashcards in this deck.
Unlock Deck
k this deck
47
Unlock Deck
Unlock for access to all 100 flashcards in this deck.
Unlock Deck
k this deck
48
Unlock Deck
Unlock for access to all 100 flashcards in this deck.
Unlock Deck
k this deck
49
We are interested in comparing the average supermarket prices of two leading colas. Our sample was taken by randomly selecting eight supermarkets and recording the price of a six-pack of each
Brand of cola at each supermarket. The data are shown in the following table:
Brand of cola at each supermarket. The data are shown in the following table:
Unlock Deck
Unlock for access to all 100 flashcards in this deck.
Unlock Deck
k this deck
50
In order for the results of a paired difference experiment to be unbiased, the experimental units in
each pair must be chosen independently of one another.
each pair must be chosen independently of one another.
Unlock Deck
Unlock for access to all 100 flashcards in this deck.
Unlock Deck
k this deck
51
Using paired differences removes sources of variation that tend to inflate
Unlock Deck
Unlock for access to all 100 flashcards in this deck.
Unlock Deck
k this deck
52
Unlock Deck
Unlock for access to all 100 flashcards in this deck.
Unlock Deck
k this deck
53
Unlock Deck
Unlock for access to all 100 flashcards in this deck.
Unlock Deck
k this deck
54
The data for a random sample of five paired observations are shown below.
Unlock Deck
Unlock for access to all 100 flashcards in this deck.
Unlock Deck
k this deck
55
Unlock Deck
Unlock for access to all 100 flashcards in this deck.
Unlock Deck
k this deck
56
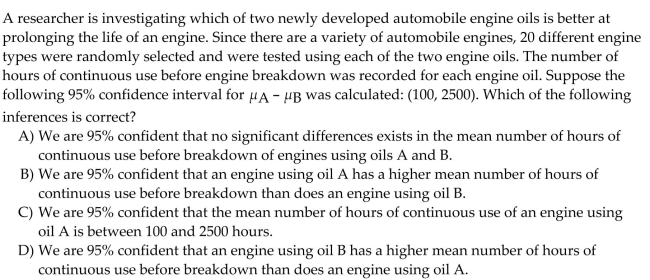
A researcher is investigating which of two newly developed automobile engine oils is better at prolonging the life of an engine. Since there are a variety of automobile engines, 20 different engine
Types were randomly selected and were tested using each of the two engine oils. The number of
Hours of continuous use before engine breakdown was recorded for each engine oil. Based on the
Information provided, what type of analysis will yield the most useful information?
A)Matched pairs comparison of population proportions.
B)Independent samples comparison of population proportions.
C)Independent samples comparison of population means.
D)Matched pairs comparison of population means.
Unlock Deck
Unlock for access to all 100 flashcards in this deck.
Unlock Deck
k this deck
57
Which supermarket has the lowest prices in town? All claim to be cheaper, but an independent agency recently was asked to investigate this question. The agency randomly selected 100 items
Common to each of two supermarkets (labeled A and
B)and recorded the prices charged by each supermarket. The summary results are provided below:
Common to each of two supermarkets (labeled A and
B)and recorded the prices charged by each supermarket. The summary results are provided below:
Unlock Deck
Unlock for access to all 100 flashcards in this deck.
Unlock Deck
k this deck
58
The data for a random sample of six paired observations are shown below.
Unlock Deck
Unlock for access to all 100 flashcards in this deck.
Unlock Deck
k this deck
59
A certain manufacturer is interested in evaluating two alternative manufacturing plans consisting of different machine layouts. Because of union rules, hours of operation vary greatly for this
Particular manufacturer from one day to the next. Twenty-eight random working days were
Selected and each plan was monitored and the number of items produced each day was recorded.
Some of the collected data is shown below: What assumptions are necessary for the above test to be valid?
A)None of these listed, since the Central Limit Theorem can be applied.
B)The population variances must be approximately equal.
C)Both populations must be approximately normally distributed.
D)The population of paired differences must be approximately normally distributed.
Particular manufacturer from one day to the next. Twenty-eight random working days were
Selected and each plan was monitored and the number of items produced each day was recorded.
Some of the collected data is shown below:
What assumptions are necessary for the above test to be valid?A)None of these listed, since the Central Limit Theorem can be applied.
B)The population variances must be approximately equal.
C)Both populations must be approximately normally distributed.
D)The population of paired differences must be approximately normally distributed.
Unlock Deck
Unlock for access to all 100 flashcards in this deck.
Unlock Deck
k this deck
60
An inventor has developed a new spray coating that is designed to improve the wear of bicycle tires. To test the new coating, the inventor randomly selects one of the two tires on each of 50
Bicycles to be coated with the new spray. The bicycle is then driven for 100 miles and the amount
Of the depth of the tread left on the two bicycle tires is measured (in millimeters). It is desired to
Determine whether the new spray coating improves the wear of the bicycle tires. The data and
Summary information is shown below:
Bicycles to be coated with the new spray. The bicycle is then driven for 100 miles and the amount
Of the depth of the tread left on the two bicycle tires is measured (in millimeters). It is desired to
Determine whether the new spray coating improves the wear of the bicycle tires. The data and
Summary information is shown below:
Unlock Deck
Unlock for access to all 100 flashcards in this deck.
Unlock Deck
k this deck
61
Unlock Deck
Unlock for access to all 100 flashcards in this deck.
Unlock Deck
k this deck
62
An inventor has developed a new spray coating that is designed to improve the wear of bicycle tires. To test the new coating, the inventor randomly selects one of the two tires on each of 50
Bicycles to be coated with the new spray. The bicycle is then driven for 100 miles and the amount
Of the depth of the tread left on the two bicycle tires is measured (in millimeters). It is desired to
Determine whether the new spray coating improves the wear of the bicycle tires. The data and
Summary information is shown below:
Bicycles to be coated with the new spray. The bicycle is then driven for 100 miles and the amount
Of the depth of the tread left on the two bicycle tires is measured (in millimeters). It is desired to
Determine whether the new spray coating improves the wear of the bicycle tires. The data and
Summary information is shown below:
Unlock Deck
Unlock for access to all 100 flashcards in this deck.
Unlock Deck
k this deck
63
An inventor has developed a new spray coating that is designed to improve the wear of bicycle tires. To test the new coating, the inventor randomly selects one of the two tires on each of 50
Bicycles to be coated with the new spray. The bicycle is then driven for 100 miles and the amount
Of the depth of the tread left on the two bicycle tires is measured (in millimeters). It is desired to
Determine whether the new spray coating improves the wear of the bicycle tires. The data and
Summary information is shown below:
Bicycles to be coated with the new spray. The bicycle is then driven for 100 miles and the amount
Of the depth of the tread left on the two bicycle tires is measured (in millimeters). It is desired to
Determine whether the new spray coating improves the wear of the bicycle tires. The data and
Summary information is shown below:
Unlock Deck
Unlock for access to all 100 flashcards in this deck.
Unlock Deck
k this deck
64
In an exit poll, 42 of 75 men sampled supported a ballot initiative to raise the local sales tax
to build a new football stadium. In the same poll, 41 of 85 women sampled supported the
initiative. Find and interpret the p-value for the test of hypothesis that the proportions of
men and women who support the initiative are different.
to build a new football stadium. In the same poll, 41 of 85 women sampled supported the
initiative. Find and interpret the p-value for the test of hypothesis that the proportions of
men and women who support the initiative are different.
Unlock Deck
Unlock for access to all 100 flashcards in this deck.
Unlock Deck
k this deck
65
Determine whether the sample sizes are large enough to conclude that the sampling
distributions are approximately normal.
distributions are approximately normal.
Unlock Deck
Unlock for access to all 100 flashcards in this deck.
Unlock Deck
k this deck
66
Unlock Deck
Unlock for access to all 100 flashcards in this deck.
Unlock Deck
k this deck
67
A paired difference experiment produced the following results.
Unlock Deck
Unlock for access to all 100 flashcards in this deck.
Unlock Deck
k this deck
68
Unlock Deck
Unlock for access to all 100 flashcards in this deck.
Unlock Deck
k this deck
69
A cola manufacturer invited consumers to take a blind taste test. Consumers were asked to decide which of two sodas they preferred. The manufacturer was also interested in what factors played a
Role in taste preferences. Below is a printout comparing the taste preferences of men and women.
Role in taste preferences. Below is a printout comparing the taste preferences of men and women.
Unlock Deck
Unlock for access to all 100 flashcards in this deck.
Unlock Deck
k this deck
70
Unlock Deck
Unlock for access to all 100 flashcards in this deck.
Unlock Deck
k this deck
71
One indication of how strong the real estate market is performing is the proportion of
properties that sell in less than 30 days after being listed. Of the condominiums in a
Florida beach community that sold in the first six months of 2006, 75 of the 115 sampled
had been on the market less than 30 days. For the first six months of 2007, 25 of the 85
sampled had been on the market less than 30 days. Test the hypothesis that the proportion
of condominiums that sold within 30 days decreased from 2006 to
properties that sell in less than 30 days after being listed. Of the condominiums in a
Florida beach community that sold in the first six months of 2006, 75 of the 115 sampled
had been on the market less than 30 days. For the first six months of 2007, 25 of the 85
sampled had been on the market less than 30 days. Test the hypothesis that the proportion
of condominiums that sold within 30 days decreased from 2006 to
Unlock Deck
Unlock for access to all 100 flashcards in this deck.
Unlock Deck
k this deck
72
A government housing agency is comparing home ownership rates among several
immigrant groups. In a sample of 235 families who emigrated to the U.S. from Eastern
Europe five years ago, 165 now own homes. In a sample of 195 families who emigrated to
the U.S. from Pacific islands five years ago, 125 now own homes. Write a 95% confidence
interval for the difference in home ownership rates between the two groups. Based on the
confidence interval, can you conclude that there is a significant difference in home
ownership rates in the two groups of immigrants?
Unlock Deck
Unlock for access to all 100 flashcards in this deck.
Unlock Deck
k this deck
73
Unlock Deck
Unlock for access to all 100 flashcards in this deck.
Unlock Deck
k this deck
74
Unlock Deck
Unlock for access to all 100 flashcards in this deck.
Unlock Deck
k this deck
75
Unlock Deck
Unlock for access to all 100 flashcards in this deck.
Unlock Deck
k this deck
76
Unlock Deck
Unlock for access to all 100 flashcards in this deck.
Unlock Deck
k this deck
77
A paired difference experiment yielded the following results.
Unlock Deck
Unlock for access to all 100 flashcards in this deck.
Unlock Deck
k this deck
78
We sampled 100 men and 100 women and asked: ʺDo you think the environment is a major concern?ʺ Of those sampled, 67 women and 53 men responded that they believed it is. For the
Confidence interval procedure to work properly, what additional assumptions must be satisfied?
A)The population variances are equal.
B)Both samples were randomly and independently selected from their respective populations.
C)Both populations have approximate normal distributions.
D)All of the above are necessary.
Unlock Deck
Unlock for access to all 100 flashcards in this deck.
Unlock Deck
k this deck
79
Unlock Deck
Unlock for access to all 100 flashcards in this deck.
Unlock Deck
k this deck
80
Determine whether the sample sizes are large enough to conclude that the sampling
distributions are approximately normal.
distributions are approximately normal.
Unlock Deck
Unlock for access to all 100 flashcards in this deck.
Unlock Deck
k this deck
Unlock Deck
Unlock for access to all 100 flashcards in this deck.


