Deck 2: Methods for Describing Sets of Data
Full screen (f)
Question
Question
Question
What number is missing from the table? 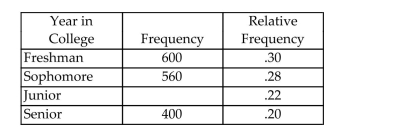
A)480
B)440
C)220
D)520
A)480
B)440
C)220
D)520
Question
Question
Question
260 randomly sampled college students were asked, among other things, to state their year in school (freshman, sophomore, junior, or senior). The responses are shown in the bar graph below.
How many of the students who responded would be classified as upperclassmen (e.g., juniors or
Seniors)?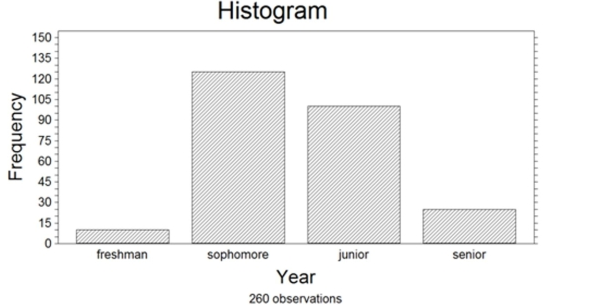
A) Approximately 10
B) Approximately 25
C) Approximately 100
D) Approximatley 125
How many of the students who responded would be classified as upperclassmen (e.g., juniors or
Seniors)?
A) Approximately 10
B) Approximately 25
C) Approximately 100
D) Approximatley 125
Question
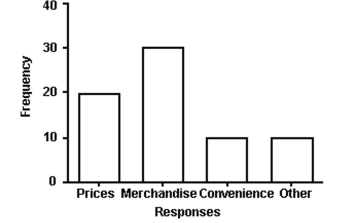
The manager of a store conducted a customer survey to determine why customers shopped at the store. The results are shown in the figure. What proportion of customers responded that merchandise was the reason they shopped at the store?
A) 30
B)

C)

D)

Question
The data below show the types of medals won by athletes representing the United States
in the Winter Olympics.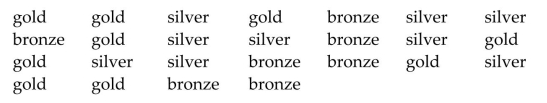
a. Construct a frequency table for the data.
b. Construct a relative frequency table for the data.
c. Construct a frequency bar graph for the data.
in the Winter Olympics.
a. Construct a frequency table for the data.
b. Construct a relative frequency table for the data.
c. Construct a frequency bar graph for the data.
Question
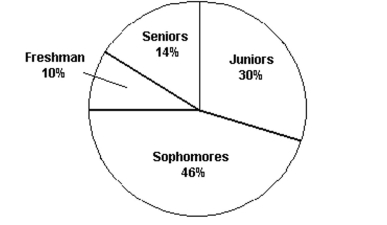 The pie chart shows the classifications of students in a statistics class. What percentage of the class consists of freshman, sophomores, and juniors?
A)54%
B)44%
C)86%
D)14%
Question
The table shows the number of each type of car sold in June. 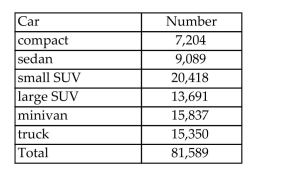 a. Construct a relative frequency table for the car sales.
b. Construct a Pareto diagram for the car sales using the class percentages as the heights
of the bars.
a. Construct a relative frequency table for the car sales.b. Construct a Pareto diagram for the car sales using the class percentages as the heights
of the bars.
Question
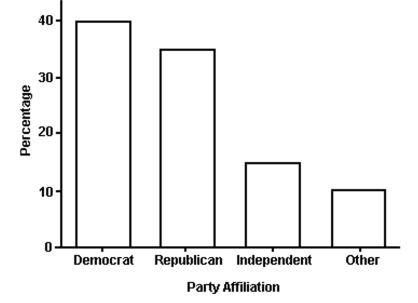
The bar graph shows the political affiliation of 1000 registered U.S. voters. What percentage of the voters belonged to one of the traditional two parties (Democratic or Republican)?
A) 25%
B) 35%
C) 75%
D) 40%
Question
Question
Question
Question
Question
The table shows the number of each type of book found at an online auction site during a
recent search.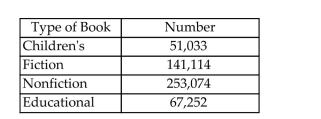
a. Construct a relative frequency table for the book data.
b. Construct a pie chart for the book data.
recent search.
a. Construct a relative frequency table for the book data.
b. Construct a pie chart for the book data.
Question
One of the questions posed to a sample of 286 incoming freshmen at a large public university was, ʺDo you have any tattoos?ʺ Their responses are shown below in the pie chart. Please note that the
Values shown represent the number of responses in each category. Based on the responses shown in the pie chart, what percentage of the freshmen responded with
ʺYes?ʺ
A)76%
B)26.6%
C)76
D)73.4%
Values shown represent the number of responses in each category.
Based on the responses shown in the pie chart, what percentage of the freshmen responded withʺYes?ʺ
A)76%
B)26.6%
C)76
D)73.4%
Question
Question
What number is missing from the table? 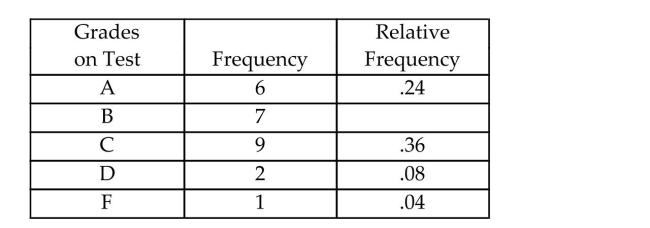
A).28
B).70
C).72
D).07
A).28
B).70
C).72
D).07
Question
Question
A dot plot of the speeds of a sample of 50 cars passing a policeman with a radar gun is shown below. 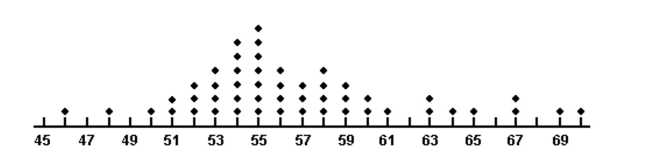 What proportion of the motorists were driving above the posted speed limit of 55 miles per hour?
A)0.14
B)7
C)0.50
D)0.64
What proportion of the motorists were driving above the posted speed limit of 55 miles per hour?A)0.14
B)7
C)0.50
D)0.64
Question
Question
The scores for a statistics test are as follows: 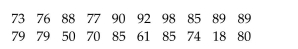 Compute the mean score.
A)76.90
B)75
C)67.85
D)80.10
Compute the mean score.A)76.90
B)75
C)67.85
D)80.10
Question
252 randomly sampled college students were asked, among other things, to estimate their college grade point average (GPA). The responses are shown in the stem-and-leaf plot shown below.
Notice that a GPA of 3.65 would be indicated with a stem of 36 and a leaf of 5 in the plot. How
Many of the students who responded had GPAʹs that exceeded 3.55?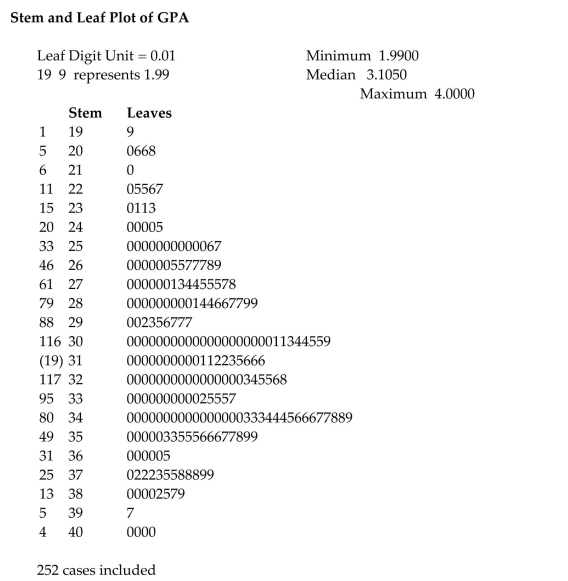
A) 39
B) 19
C) 49
D) 31
Notice that a GPA of 3.65 would be indicated with a stem of 36 and a leaf of 5 in the plot. How
Many of the students who responded had GPAʹs that exceeded 3.55?
A) 39
B) 19
C) 49
D) 31
Question
A sociologist recently conducted a survey of senior citizens who have net worths too high to qualify for Medicaid but have no private health insurance. The ages of the 25 uninsured senior
Citizens were as follows: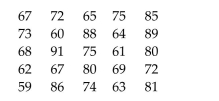 Find the median of the observations.
A)69
B)73
C)72.5
D)72
Citizens were as follows:
Find the median of the observations.A)69
B)73
C)72.5
D)72
Question
Question
Question
The total points scored by a basketball team for each game during its last season have
been summarized in the table below.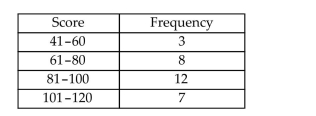 a. Explain why you cannot use the information in the table to construct a stem-and-leaf
display for the data.
b. Construct a histogram for the scores.
been summarized in the table below.
a. Explain why you cannot use the information in the table to construct a stem-and-leafdisplay for the data.
b. Construct a histogram for the scores.
Question
A survey was conducted to determine how people feel about the quality of programming available on television. Respondents were asked to rate the overall quality from 0 (no quality at all)to 100
(extremely good quality). The stem-and-leaf display of the data is shown below.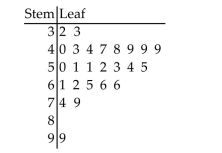 What percentage of the respondents rated overall television quality as very good (regarded as
Ratings of 80 and above)?
A)1%
B)36%
C)4%
D)9%
(extremely good quality). The stem-and-leaf display of the data is shown below.
What percentage of the respondents rated overall television quality as very good (regarded asRatings of 80 and above)?
A)1%
B)36%
C)4%
D)9%
Question
Question
Question
Question
The data show the total number of medals (gold, silver, and bronze)won by each country
winning at least one gold medal in the Winter Olympics.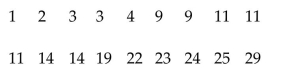
a. Complete the class frequency table for the data.
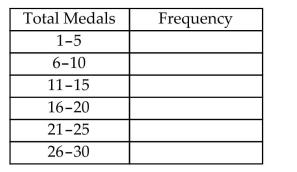
b. Using the classes from the frequency table, construct a histogram for the data.
winning at least one gold medal in the Winter Olympics.
a. Complete the class frequency table for the data.
b. Using the classes from the frequency table, construct a histogram for the data.
Question
The scores for a statistics test are as follows: 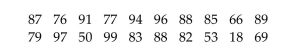 Create a stem-and-leaf display for the data.
Create a stem-and-leaf display for the data. Question
Question
Question
Question
Question
An annual survey sent to retail store managers contained the question ʺDid your store
suffer any losses due to employee theft?ʺ The responses are summarized in the table for
two years. Compare the responses for the two years using side-by-side bar charts. What
inferences can be made from the charts?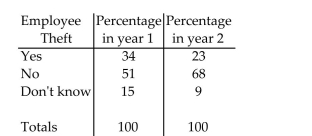
suffer any losses due to employee theft?ʺ The responses are summarized in the table for
two years. Compare the responses for the two years using side-by-side bar charts. What
inferences can be made from the charts?
Question
The payroll amounts for all teams in an international hockey league are shown below using a graphical technique from chapter 2 of the text. How many of the hockey team payrolls exceeded
$20 million (Note: Assume that no payroll was exactly $20 million)?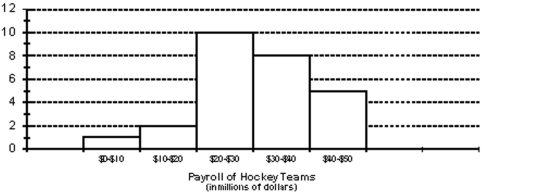
A) 10 teams
B) 8 teams
C) 18 teams
D) 23 teams
$20 million (Note: Assume that no payroll was exactly $20 million)?
A) 10 teams
B) 8 teams
C) 18 teams
D) 23 teams
Question
The output below displays the mean and median for the state high school dropout rates in
year 1 and in year 5.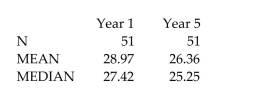 Use the information to determine the shape of the distributions of the high school dropout
rates in year 1 and year 5.
year 1 and in year 5.
Use the information to determine the shape of the distributions of the high school dropoutrates in year 1 and year 5.
Question
Question
The output below displays the mean and median for the state high school dropout rates in year 1 and in year 5.  Interpret the year 5 median dropout rate of 25.51.
A)Most of the 51 states had a dropout rate close to 25.51%.
B)The most frequently observed dropout rate of the 51 states was 25.51%.
C)Half of the 51 states had a dropout rate below 25.51%.
D)Half of the 51 states had a dropout rate of 25.51%.
Interpret the year 5 median dropout rate of 25.51.A)Most of the 51 states had a dropout rate close to 25.51%.
B)The most frequently observed dropout rate of the 51 states was 25.51%.
C)Half of the 51 states had a dropout rate below 25.51%.
D)Half of the 51 states had a dropout rate of 25.51%.
Question
Question
The data show the total number of medals (gold, silver, and bronze)won by each country
winning at least one gold medal in the Winter Olympics. Find the mean, median, and
mode of the numbers of medals won by these countries.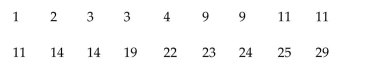
winning at least one gold medal in the Winter Olympics. Find the mean, median, and
mode of the numbers of medals won by these countries.
Question
Each year advertisers spend billions of dollars purchasing commercial time on network
television. In the first 6 months of one year, advertisers spent $1.1 billion. Who were the
largest spenders? In a recent article, the top 10 leading spenders and how much each
spent (in million of dollars)were listed: Calculate the mean and median for the data.
television. In the first 6 months of one year, advertisers spent $1.1 billion. Who were the
largest spenders? In a recent article, the top 10 leading spenders and how much each
spent (in million of dollars)were listed:
Calculate the mean and median for the data. Question
A shoe retailer keeps track of all types of information about sales of newly released shoe styles. One newly released style was marketed to tall people. Listed below are the shoe sizes of 12
Randomly selected customers who purchased the new style. Find the mode of the shoe sizes.
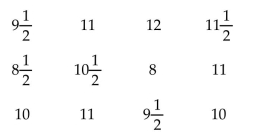
A) 11
B)
C)
D)
Randomly selected customers who purchased the new style. Find the mode of the shoe sizes.
A) 11
B)
C)
D)
Question
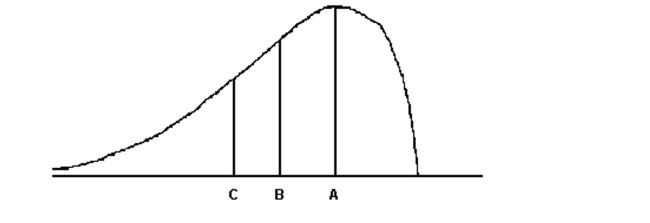 For the distribution drawn here, identify the mean, median, and mode.
A)A = mode, B = median, C = mean
B)A = mean, B = mode, C = median
C)A = mode, B = mean, C = median
D)A = median, B = mode, C = mean
Question
Question
Question
Calculate the mean of a sample for which 
and n=8
and n=8
Question
Question
Question
Question
The calculator screens summarize a data set. 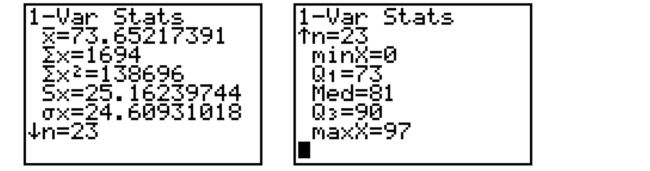 a. Identify the mean and the median.
b. Based only on the mean and the median, do you expect that the data set is skewed to
the right, symmetric, or skewed to the left? Explain.
a. Identify the mean and the median.b. Based only on the mean and the median, do you expect that the data set is skewed to
the right, symmetric, or skewed to the left? Explain.
Question
Question
Question
Question
The total points scored by a basketball team for each game during its last season have been
summarized in the table below. Identify the modal class of the distribution of scores.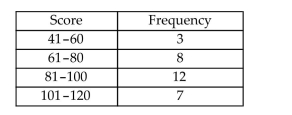
summarized in the table below. Identify the modal class of the distribution of scores.
Question
The calculator screens summarize a data set. 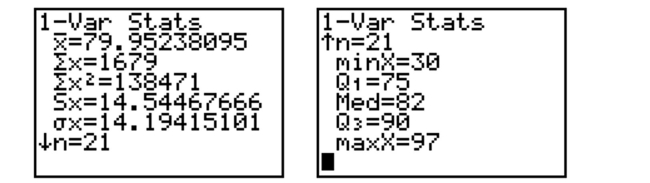
a. How many data items are in the set?
b. What is the sum of the data?
c. Identify the mean, median, and mode, if possible.
a. How many data items are in the set?
b. What is the sum of the data?
c. Identify the mean, median, and mode, if possible.
Question
Question
Calculate the variance of a sample for which 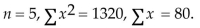
A) 8.00
B) 3.16
C) 10.00
D) 326.00
A) 8.00
B) 3.16
C) 10.00
D) 326.00
Question
Compute  and s for the data set: -3,-1,-4,-3,1,-3
A) 2.24 ; 1.5
B) 1.87 ; 1.37
C) 3.37 ; 1.83
D) 32.3 ; 5.68
and s for the data set: -3,-1,-4,-3,1,-3A) 2.24 ; 1.5
B) 1.87 ; 1.37
C) 3.37 ; 1.83
D) 32.3 ; 5.68
Question
Each year advertisers spend billions of dollars purchasing commercial time on network television. In the first 6 months of one year, advertisers spent $1.1 billion. Who were the largest spenders? In a
Recent article, the top 10 leading spenders and how much each spent (in million of dollars)were
Listed: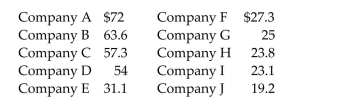 Calculate the sample variance.
A)391.238
B)3883.082
C)1919.040
D)2141.564
Recent article, the top 10 leading spenders and how much each spent (in million of dollars)were
Listed:
Calculate the sample variance.A)391.238
B)3883.082
C)1919.040
D)2141.564
Question
The data show the total number of medals (gold, silver, and bronze)won by each country
winning at least one gold medal in the Winter Olympics. Find the range, sample variance,
and sample standard deviation of the numbers of medals won by these countries.
winning at least one gold medal in the Winter Olympics. Find the range, sample variance,
and sample standard deviation of the numbers of medals won by these countries.
Question
Question
Question
Question
Question
Question
In practice, the population mean  is used to estimate the sample mean
is used to estimate the sample mean Question
Question
Compute  and s for the data set:
A) 0.033 ; 0.183
B) 6.667 ; 2.582
C) 0.767 ; 0.876
D) 0.067 ; 0.258
and s for the data set: A) 0.033 ; 0.183
B) 6.667 ; 2.582
C) 0.767 ; 0.876
D) 0.067 ; 0.258
Question
Question
Question
Question
Question
Question
Calculate the standard deviation of a sample for which 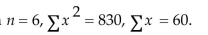
A) 6.78
B) 6.19
C) 46.00
D) 164.00
A) 6.78
B) 6.19
C) 46.00
D) 164.00
Question
The calculator screens summarize a data set.  a. Identify the smallest measurement in the data set.
b. Identify the largest measurement in the data set.
c. Calculate the range of the data set.
a. Identify the smallest measurement in the data set.b. Identify the largest measurement in the data set.
c. Calculate the range of the data set.

Unlock Deck
Sign up to unlock the cards in this deck!
Unlock Deck
Unlock Deck
1/187
Play
Full screen (f)
Deck 2: Methods for Describing Sets of Data
1
Either vertical or horizontal bars can be used when constructing a bar graph.
True
2
A sample of 100 e-mail users were asked whether their primary e-mail account was a free
account, an institutional (school or work)account, or an account that they pay for
personally. Identify the classes for the resulting data.
account, an institutional (school or work)account, or an account that they pay for
personally. Identify the classes for the resulting data.
free account, institutional account, account paid for personally
3
What number is missing from the table?
A)480
B)440
C)220
D)520
A)480
B)440
C)220
D)520
440
4
In an eye color study, 25 out of 50 people in the sample had brown eyes. In this situation, what does the number .50 represent?
A)a class relative frequency
B)a class percentage
C)a class
D)a class frequency
A)a class relative frequency
B)a class percentage
C)a class
D)a class frequency
Unlock Deck
Unlock for access to all 187 flashcards in this deck.
Unlock Deck
k this deck
5
Class relative frequencies must be used, rather than class frequencies or class percentages, when
constructing a Pareto diagram.
constructing a Pareto diagram.
Unlock Deck
Unlock for access to all 187 flashcards in this deck.
Unlock Deck
k this deck
6
260 randomly sampled college students were asked, among other things, to state their year in school (freshman, sophomore, junior, or senior). The responses are shown in the bar graph below.
How many of the students who responded would be classified as upperclassmen (e.g., juniors or
Seniors)?
A) Approximately 10
B) Approximately 25
C) Approximately 100
D) Approximatley 125
How many of the students who responded would be classified as upperclassmen (e.g., juniors or
Seniors)?
A) Approximately 10
B) Approximately 25
C) Approximately 100
D) Approximatley 125
Unlock Deck
Unlock for access to all 187 flashcards in this deck.
Unlock Deck
k this deck
7
The manager of a store conducted a customer survey to determine why customers shopped at the store. The results are shown in the figure. What proportion of customers responded that merchandise was the reason they shopped at the store?
A) 30
B)
C)
D)
Unlock Deck
Unlock for access to all 187 flashcards in this deck.
Unlock Deck
k this deck
8
The data below show the types of medals won by athletes representing the United States
in the Winter Olympics.
a. Construct a frequency table for the data.
b. Construct a relative frequency table for the data.
c. Construct a frequency bar graph for the data.
in the Winter Olympics.
a. Construct a frequency table for the data.
b. Construct a relative frequency table for the data.
c. Construct a frequency bar graph for the data.
Unlock Deck
Unlock for access to all 187 flashcards in this deck.
Unlock Deck
k this deck
9
The pie chart shows the classifications of students in a statistics class. What percentage of the class consists of freshman, sophomores, and juniors?A)54%
B)44%
C)86%
D)14%
Unlock Deck
Unlock for access to all 187 flashcards in this deck.
Unlock Deck
k this deck
10
The table shows the number of each type of car sold in June. a. Construct a relative frequency table for the car sales.
b. Construct a Pareto diagram for the car sales using the class percentages as the heights
of the bars.
a. Construct a relative frequency table for the car sales.b. Construct a Pareto diagram for the car sales using the class percentages as the heights
of the bars.
Unlock Deck
Unlock for access to all 187 flashcards in this deck.
Unlock Deck
k this deck
11
The bar graph shows the political affiliation of 1000 registered U.S. voters. What percentage of the voters belonged to one of the traditional two parties (Democratic or Republican)?
A) 25%
B) 35%
C) 75%
D) 40%
Unlock Deck
Unlock for access to all 187 flashcards in this deck.
Unlock Deck
k this deck
12
What characteristic of a Pareto diagram distinguishes it from other bar graphs?
Unlock Deck
Unlock for access to all 187 flashcards in this deck.
Unlock Deck
k this deck
13
The bars in a bar graph can be arranged by height in ascending order from left to right.
Unlock Deck
Unlock for access to all 187 flashcards in this deck.
Unlock Deck
k this deck
14
The slices of a pie chart must be arranged from largest to smallest in a clockwise direction.
Unlock Deck
Unlock for access to all 187 flashcards in this deck.
Unlock Deck
k this deck
15
A frequency table displays the proportion of observations falling into each class.
Unlock Deck
Unlock for access to all 187 flashcards in this deck.
Unlock Deck
k this deck
16
The table shows the number of each type of book found at an online auction site during a
recent search.
a. Construct a relative frequency table for the book data.
b. Construct a pie chart for the book data.
recent search.
a. Construct a relative frequency table for the book data.
b. Construct a pie chart for the book data.
Unlock Deck
Unlock for access to all 187 flashcards in this deck.
Unlock Deck
k this deck
17
One of the questions posed to a sample of 286 incoming freshmen at a large public university was, ʺDo you have any tattoos?ʺ Their responses are shown below in the pie chart. Please note that the
Values shown represent the number of responses in each category. Based on the responses shown in the pie chart, what percentage of the freshmen responded with
ʺYes?ʺ
A)76%
B)26.6%
C)76
D)73.4%
Values shown represent the number of responses in each category.
Based on the responses shown in the pie chart, what percentage of the freshmen responded withʺYes?ʺ
A)76%
B)26.6%
C)76
D)73.4%
Unlock Deck
Unlock for access to all 187 flashcards in this deck.
Unlock Deck
k this deck
18
What class percentage corresponds to a class relative frequency of .37?
A)37%
B)63%
C).37%
D).63%
A)37%
B)63%
C).37%
D).63%
Unlock Deck
Unlock for access to all 187 flashcards in this deck.
Unlock Deck
k this deck
19
What number is missing from the table?
A).28
B).70
C).72
D).07
A).28
B).70
C).72
D).07
Unlock Deck
Unlock for access to all 187 flashcards in this deck.
Unlock Deck
k this deck
20
If 25% of your statistics class is sophomores, then in a pie chart representing classifications of the
students in your statistics class the slice assigned to sophomores is 90°.
students in your statistics class the slice assigned to sophomores is 90°.
Unlock Deck
Unlock for access to all 187 flashcards in this deck.
Unlock Deck
k this deck
21
A dot plot of the speeds of a sample of 50 cars passing a policeman with a radar gun is shown below. What proportion of the motorists were driving above the posted speed limit of 55 miles per hour?
A)0.14
B)7
C)0.50
D)0.64
What proportion of the motorists were driving above the posted speed limit of 55 miles per hour?A)0.14
B)7
C)0.50
D)0.64
Unlock Deck
Unlock for access to all 187 flashcards in this deck.
Unlock Deck
k this deck
22
Parking at a university has become a problem. University administrators are interested in determining the average time it takes a student to find a parking spot. An administrator
Inconspicuously followed 120 students and recorded how long it took each of them to find a
Parking spot. Which of the following types of graphs should not be used to display information
Concerning the students parking times?
A)pie chart
B)box plot
C)histogram
D)stem-and-leaf display
Inconspicuously followed 120 students and recorded how long it took each of them to find a
Parking spot. Which of the following types of graphs should not be used to display information
Concerning the students parking times?
A)pie chart
B)box plot
C)histogram
D)stem-and-leaf display
Unlock Deck
Unlock for access to all 187 flashcards in this deck.
Unlock Deck
k this deck
23
The scores for a statistics test are as follows: Compute the mean score.
A)76.90
B)75
C)67.85
D)80.10
Compute the mean score.A)76.90
B)75
C)67.85
D)80.10
Unlock Deck
Unlock for access to all 187 flashcards in this deck.
Unlock Deck
k this deck
24
252 randomly sampled college students were asked, among other things, to estimate their college grade point average (GPA). The responses are shown in the stem-and-leaf plot shown below.
Notice that a GPA of 3.65 would be indicated with a stem of 36 and a leaf of 5 in the plot. How
Many of the students who responded had GPAʹs that exceeded 3.55?
A) 39
B) 19
C) 49
D) 31
Notice that a GPA of 3.65 would be indicated with a stem of 36 and a leaf of 5 in the plot. How
Many of the students who responded had GPAʹs that exceeded 3.55?
A) 39
B) 19
C) 49
D) 31
Unlock Deck
Unlock for access to all 187 flashcards in this deck.
Unlock Deck
k this deck
25
A sociologist recently conducted a survey of senior citizens who have net worths too high to qualify for Medicaid but have no private health insurance. The ages of the 25 uninsured senior
Citizens were as follows: Find the median of the observations.
A)69
B)73
C)72.5
D)72
Citizens were as follows:
Find the median of the observations.A)69
B)73
C)72.5
D)72
Unlock Deck
Unlock for access to all 187 flashcards in this deck.
Unlock Deck
k this deck
26
The bars in a histogram should be arranged by height in descending order from left to right.
Unlock Deck
Unlock for access to all 187 flashcards in this deck.
Unlock Deck
k this deck
27
The amount spent on textbooks for the fall term was recorded for a sample of five university students - $400, $350, $600, $525, and $450. Calculate the value of the sample mean for the data.
A)$450
B)$465
C)$400
D)$600
A)$450
B)$465
C)$400
D)$600
Unlock Deck
Unlock for access to all 187 flashcards in this deck.
Unlock Deck
k this deck
28
The total points scored by a basketball team for each game during its last season have
been summarized in the table below. a. Explain why you cannot use the information in the table to construct a stem-and-leaf
display for the data.
b. Construct a histogram for the scores.
been summarized in the table below.
a. Explain why you cannot use the information in the table to construct a stem-and-leafdisplay for the data.
b. Construct a histogram for the scores.
Unlock Deck
Unlock for access to all 187 flashcards in this deck.
Unlock Deck
k this deck
29
A survey was conducted to determine how people feel about the quality of programming available on television. Respondents were asked to rate the overall quality from 0 (no quality at all)to 100
(extremely good quality). The stem-and-leaf display of the data is shown below. What percentage of the respondents rated overall television quality as very good (regarded as
Ratings of 80 and above)?
A)1%
B)36%
C)4%
D)9%
(extremely good quality). The stem-and-leaf display of the data is shown below.
What percentage of the respondents rated overall television quality as very good (regarded asRatings of 80 and above)?
A)1%
B)36%
C)4%
D)9%
Unlock Deck
Unlock for access to all 187 flashcards in this deck.
Unlock Deck
k this deck
30
Fill in the blank. One advantage of the __________ is that the actual data values are retained in the graphical summarization of the data.
A)histogram
B)pie chart
C)stem-and-leaf plot
A)histogram
B)pie chart
C)stem-and-leaf plot
Unlock Deck
Unlock for access to all 187 flashcards in this deck.
Unlock Deck
k this deck
31
All class intervals in a histogram have the same width.
Unlock Deck
Unlock for access to all 187 flashcards in this deck.
Unlock Deck
k this deck
32
A Pareto diagram is a pie chart where the slices are arranged from largest to smallest in a
counterclockwise direction.
counterclockwise direction.
Unlock Deck
Unlock for access to all 187 flashcards in this deck.
Unlock Deck
k this deck
33
The data show the total number of medals (gold, silver, and bronze)won by each country
winning at least one gold medal in the Winter Olympics.
a. Complete the class frequency table for the data.
b. Using the classes from the frequency table, construct a histogram for the data.
winning at least one gold medal in the Winter Olympics.
a. Complete the class frequency table for the data.
b. Using the classes from the frequency table, construct a histogram for the data.
Unlock Deck
Unlock for access to all 187 flashcards in this deck.
Unlock Deck
k this deck
34
The scores for a statistics test are as follows: Create a stem-and-leaf display for the data.
Create a stem-and-leaf display for the data. Unlock Deck
Unlock for access to all 187 flashcards in this deck.
Unlock Deck
k this deck
35
A histogram can be constructed using either class frequencies or class relative frequencies as the
heights of the bars.
heights of the bars.
Unlock Deck
Unlock for access to all 187 flashcards in this deck.
Unlock Deck
k this deck
36
For large data sets, a stem-and-leaf display is a better choice than a histogram.
Unlock Deck
Unlock for access to all 187 flashcards in this deck.
Unlock Deck
k this deck
37
Which of the graphical techniques below can be used to summarize qualitative data?
A)dot plot
B)stem-and-leaf plot
C)box plot
D)bar graph
A)dot plot
B)stem-and-leaf plot
C)box plot
D)bar graph
Unlock Deck
Unlock for access to all 187 flashcards in this deck.
Unlock Deck
k this deck
38
The amount spent on textbooks for the fall term was recorded for a sample of five university students - $400, $350, $600, $525, and $450. Calculate the value of the sample median for the data.
A)$400
B)$600
C)$465
D)$450
A)$400
B)$600
C)$465
D)$450
Unlock Deck
Unlock for access to all 187 flashcards in this deck.
Unlock Deck
k this deck
39
An annual survey sent to retail store managers contained the question ʺDid your store
suffer any losses due to employee theft?ʺ The responses are summarized in the table for
two years. Compare the responses for the two years using side-by-side bar charts. What
inferences can be made from the charts?
suffer any losses due to employee theft?ʺ The responses are summarized in the table for
two years. Compare the responses for the two years using side-by-side bar charts. What
inferences can be made from the charts?
Unlock Deck
Unlock for access to all 187 flashcards in this deck.
Unlock Deck
k this deck
40
The payroll amounts for all teams in an international hockey league are shown below using a graphical technique from chapter 2 of the text. How many of the hockey team payrolls exceeded
$20 million (Note: Assume that no payroll was exactly $20 million)?
A) 10 teams
B) 8 teams
C) 18 teams
D) 23 teams
$20 million (Note: Assume that no payroll was exactly $20 million)?
A) 10 teams
B) 8 teams
C) 18 teams
D) 23 teams
Unlock Deck
Unlock for access to all 187 flashcards in this deck.
Unlock Deck
k this deck
41
The output below displays the mean and median for the state high school dropout rates in
year 1 and in year 5. Use the information to determine the shape of the distributions of the high school dropout
rates in year 1 and year 5.
year 1 and in year 5.
Use the information to determine the shape of the distributions of the high school dropoutrates in year 1 and year 5.
Unlock Deck
Unlock for access to all 187 flashcards in this deck.
Unlock Deck
k this deck
42
During one recent year, U.S. consumers redeemed 6.16 billion manufacturersʹ coupons and saved themselves $2.27 billion. Calculate and interpret the mean savings per coupon.
A)Half of all coupons were worth more than 271.4 cents in savings.
B)The average savings was $0.37 per coupon.
C)Half of all coupons were worth more than $0.37 in savings.
D)The average savings was 271.4 cents per coupon.
A)Half of all coupons were worth more than 271.4 cents in savings.
B)The average savings was $0.37 per coupon.
C)Half of all coupons were worth more than $0.37 in savings.
D)The average savings was 271.4 cents per coupon.
Unlock Deck
Unlock for access to all 187 flashcards in this deck.
Unlock Deck
k this deck
43
The output below displays the mean and median for the state high school dropout rates in year 1 and in year 5. Interpret the year 5 median dropout rate of 25.51.
A)Most of the 51 states had a dropout rate close to 25.51%.
B)The most frequently observed dropout rate of the 51 states was 25.51%.
C)Half of the 51 states had a dropout rate below 25.51%.
D)Half of the 51 states had a dropout rate of 25.51%.
Interpret the year 5 median dropout rate of 25.51.A)Most of the 51 states had a dropout rate close to 25.51%.
B)The most frequently observed dropout rate of the 51 states was 25.51%.
C)Half of the 51 states had a dropout rate below 25.51%.
D)Half of the 51 states had a dropout rate of 25.51%.
Unlock Deck
Unlock for access to all 187 flashcards in this deck.
Unlock Deck
k this deck
44
In a distribution that is skewed to the right, what is the relationship of the mean, median, and mode?
A)mean > median > mode
B)mode > mean > median
C)mode > median > mode
D)median > mean > mode
A)mean > median > mode
B)mode > mean > median
C)mode > median > mode
D)median > mean > mode
Unlock Deck
Unlock for access to all 187 flashcards in this deck.
Unlock Deck
k this deck
45
The data show the total number of medals (gold, silver, and bronze)won by each country
winning at least one gold medal in the Winter Olympics. Find the mean, median, and
mode of the numbers of medals won by these countries.
winning at least one gold medal in the Winter Olympics. Find the mean, median, and
mode of the numbers of medals won by these countries.
Unlock Deck
Unlock for access to all 187 flashcards in this deck.
Unlock Deck
k this deck
46
Each year advertisers spend billions of dollars purchasing commercial time on network
television. In the first 6 months of one year, advertisers spent $1.1 billion. Who were the
largest spenders? In a recent article, the top 10 leading spenders and how much each
spent (in million of dollars)were listed: Calculate the mean and median for the data.
television. In the first 6 months of one year, advertisers spent $1.1 billion. Who were the
largest spenders? In a recent article, the top 10 leading spenders and how much each
spent (in million of dollars)were listed:
Calculate the mean and median for the data. Unlock Deck
Unlock for access to all 187 flashcards in this deck.
Unlock Deck
k this deck
47
A shoe retailer keeps track of all types of information about sales of newly released shoe styles. One newly released style was marketed to tall people. Listed below are the shoe sizes of 12
Randomly selected customers who purchased the new style. Find the mode of the shoe sizes.
A) 11
B)
C)
D)
Randomly selected customers who purchased the new style. Find the mode of the shoe sizes.
A) 11
B)
C)
D)
Unlock Deck
Unlock for access to all 187 flashcards in this deck.
Unlock Deck
k this deck
48
For the distribution drawn here, identify the mean, median, and mode.A)A = mode, B = median, C = mean
B)A = mean, B = mode, C = median
C)A = mode, B = mean, C = median
D)A = median, B = mode, C = mean
Unlock Deck
Unlock for access to all 187 flashcards in this deck.
Unlock Deck
k this deck
49
Many firms use on-the-job training to teach their employees computer programming. Suppose you work in the personnel department of a firm that just finished training a group of its employees
To program, and you have been requested to review the performance of one of the trainees on the
Final test that was given to all trainees. The mean of the test scores is 75. Additional information
Indicated that the median of the test scores was 85. What type of distribution most likely describes
The shape of the test scores?
A)symmetric
B)unable to determine with the information given
C)skewed to the left
D)skewed to the right
Unlock Deck
Unlock for access to all 187 flashcards in this deck.
Unlock Deck
k this deck
50
Which of the following is not a measure of central tendency?
A)mode
B)median
C)range
D)mean
A)mode
B)median
C)range
D)mean
Unlock Deck
Unlock for access to all 187 flashcards in this deck.
Unlock Deck
k this deck
51
Calculate the mean of a sample for which
and n=8
and n=8
Unlock Deck
Unlock for access to all 187 flashcards in this deck.
Unlock Deck
k this deck
52
The distribution of salaries of professional basketball players is skewed to the right. Which measure of central tendency would be the best measure to determine the location of the center of
The distribution?
A)range
B)median
C)mean
D)mode
The distribution?
A)range
B)median
C)mean
D)mode
Unlock Deck
Unlock for access to all 187 flashcards in this deck.
Unlock Deck
k this deck
53
The amount spent on textbooks for the fall term was recorded for a sample of five hundred university students. The mean expenditure was calculated to be $500 and the median expenditure
Was calculated to be $425. Which of the following interpretations of the mean is correct?
A)50% of the students sampled had textbook costs equal to $500
B)The most frequently occurring textbook cost in the sample was $500
C)The average of the textbook costs sampled was $500
D)50% of the students sampled had textbook costs that were less than $500
Unlock Deck
Unlock for access to all 187 flashcards in this deck.
Unlock Deck
k this deck
54
Parking at a university has become a problem. University administrators are interested in
determining the average time it takes a student to find a parking spot. An administrator
inconspicuously followed 190 students and recorded how long it took each of them to find
a parking spot. The times had a distribution that was skewed to the right. Based on this
information, discuss the relationship between the mean and the median for the 190 times
collected.
Unlock Deck
Unlock for access to all 187 flashcards in this deck.
Unlock Deck
k this deck
55
The calculator screens summarize a data set. a. Identify the mean and the median.
b. Based only on the mean and the median, do you expect that the data set is skewed to
the right, symmetric, or skewed to the left? Explain.
a. Identify the mean and the median.b. Based only on the mean and the median, do you expect that the data set is skewed to
the right, symmetric, or skewed to the left? Explain.
Unlock Deck
Unlock for access to all 187 flashcards in this deck.
Unlock Deck
k this deck
56
A shoe company reports the mode for the shoe sizes of menʹs shoes is 12. Interpret this result.
A)Half of the shoes sold to men are larger than a size 12
B)Most men have shoe sizes between 11 and 13.
C)Half of all menʹs shoe sizes are size 12
D)The most frequently occurring shoe size for men is size 12
A)Half of the shoes sold to men are larger than a size 12
B)Most men have shoe sizes between 11 and 13.
C)Half of all menʹs shoe sizes are size 12
D)The most frequently occurring shoe size for men is size 12
Unlock Deck
Unlock for access to all 187 flashcards in this deck.
Unlock Deck
k this deck
57
The amount spent on textbooks for the fall term was recorded for a sample of five hundred university students. The mean expenditure was calculated to be $500 and the median expenditure
Was calculated to be $425. Which of the following interpretations of the median is correct?
A)50% of the students sampled had textbook costs that were less than $425
B)50% of the students sampled had textbook costs equal to $425
C)The average of the textbook costs sampled was $425
D)The most frequently occurring textbook cost in the sample was $425
Unlock Deck
Unlock for access to all 187 flashcards in this deck.
Unlock Deck
k this deck
58
At the U.S. Open Tennis Championship a statistician keeps track of every serve that a player hits during the tournament. The statistician reported that the mean serve speed of a particular player
Was 105 miles per hour. Suppose that the statistician indicated that the serve speed distribution
Was skewed to the left. Which of the following values is most likely the value of the median serve
Speed?
A)105 mph
B)96 mph
C)87 mph
D)114 mph
Was 105 miles per hour. Suppose that the statistician indicated that the serve speed distribution
Was skewed to the left. Which of the following values is most likely the value of the median serve
Speed?
A)105 mph
B)96 mph
C)87 mph
D)114 mph
Unlock Deck
Unlock for access to all 187 flashcards in this deck.
Unlock Deck
k this deck
59
The total points scored by a basketball team for each game during its last season have been
summarized in the table below. Identify the modal class of the distribution of scores.
summarized in the table below. Identify the modal class of the distribution of scores.
Unlock Deck
Unlock for access to all 187 flashcards in this deck.
Unlock Deck
k this deck
60
The calculator screens summarize a data set.
a. How many data items are in the set?
b. What is the sum of the data?
c. Identify the mean, median, and mode, if possible.
a. How many data items are in the set?
b. What is the sum of the data?
c. Identify the mean, median, and mode, if possible.
Unlock Deck
Unlock for access to all 187 flashcards in this deck.
Unlock Deck
k this deck
61
The mean and the median are useful measures of central tendency for both qualitative and
quantitative data.
quantitative data.
Unlock Deck
Unlock for access to all 187 flashcards in this deck.
Unlock Deck
k this deck
62
Calculate the variance of a sample for which
A) 8.00
B) 3.16
C) 10.00
D) 326.00
A) 8.00
B) 3.16
C) 10.00
D) 326.00
Unlock Deck
Unlock for access to all 187 flashcards in this deck.
Unlock Deck
k this deck
63
Compute and s for the data set: -3,-1,-4,-3,1,-3
A) 2.24 ; 1.5
B) 1.87 ; 1.37
C) 3.37 ; 1.83
D) 32.3 ; 5.68
and s for the data set: -3,-1,-4,-3,1,-3A) 2.24 ; 1.5
B) 1.87 ; 1.37
C) 3.37 ; 1.83
D) 32.3 ; 5.68
Unlock Deck
Unlock for access to all 187 flashcards in this deck.
Unlock Deck
k this deck
64
Each year advertisers spend billions of dollars purchasing commercial time on network television. In the first 6 months of one year, advertisers spent $1.1 billion. Who were the largest spenders? In a
Recent article, the top 10 leading spenders and how much each spent (in million of dollars)were
Listed: Calculate the sample variance.
A)391.238
B)3883.082
C)1919.040
D)2141.564
Recent article, the top 10 leading spenders and how much each spent (in million of dollars)were
Listed:
Calculate the sample variance.A)391.238
B)3883.082
C)1919.040
D)2141.564
Unlock Deck
Unlock for access to all 187 flashcards in this deck.
Unlock Deck
k this deck
65
The data show the total number of medals (gold, silver, and bronze)won by each country
winning at least one gold medal in the Winter Olympics. Find the range, sample variance,
and sample standard deviation of the numbers of medals won by these countries.
winning at least one gold medal in the Winter Olympics. Find the range, sample variance,
and sample standard deviation of the numbers of medals won by these countries.
Unlock Deck
Unlock for access to all 187 flashcards in this deck.
Unlock Deck
k this deck
66
Calculate the range of the following data set: 8, 7, 9, 1, 6, 10, 4, 7, 4
A)1
B)10
C)11
D)9
A)1
B)10
C)11
D)9
Unlock Deck
Unlock for access to all 187 flashcards in this deck.
Unlock Deck
k this deck
67
The range of scores on a statistics test was 42. The lowest score was 57. What was the highest score?
A)99
B)cannot be determined
C)70.5
D)78
A)99
B)cannot be determined
C)70.5
D)78
Unlock Deck
Unlock for access to all 187 flashcards in this deck.
Unlock Deck
k this deck
68
The amount spent on textbooks for the fall term was recorded for a sample of five university students - $400, $350, $600, $525, and $450. Calculate the value of the sample range for the data.
A)$98.75
B)$99.37
C)$250
D)$450
A)$98.75
B)$99.37
C)$250
D)$450
Unlock Deck
Unlock for access to all 187 flashcards in this deck.
Unlock Deck
k this deck
69
The temperature fluctuated between a low of 73°F and a high of 89°F. Which of the following could be calculated using just this information?
A)median
B)range
C)variance
D)standard deviation
A)median
B)range
C)variance
D)standard deviation
Unlock Deck
Unlock for access to all 187 flashcards in this deck.
Unlock Deck
k this deck
70
In symmetric distributions, the mean and the median will be approximately equal.
Unlock Deck
Unlock for access to all 187 flashcards in this deck.
Unlock Deck
k this deck
71
In practice, the population mean is used to estimate the sample mean
is used to estimate the sample mean Unlock Deck
Unlock for access to all 187 flashcards in this deck.
Unlock Deck
k this deck
72
In general, the sample mean is a better estimator of the population mean for larger sample sizes.
Unlock Deck
Unlock for access to all 187 flashcards in this deck.
Unlock Deck
k this deck
73
Compute and s for the data set:
A) 0.033 ; 0.183
B) 6.667 ; 2.582
C) 0.767 ; 0.876
D) 0.067 ; 0.258
and s for the data set: A) 0.033 ; 0.183
B) 6.667 ; 2.582
C) 0.767 ; 0.876
D) 0.067 ; 0.258
Unlock Deck
Unlock for access to all 187 flashcards in this deck.
Unlock Deck
k this deck
74
In a symmetric and mound shaped distribution, we expect the values of the mean, median, and
mode to differ greatly from one another.
mode to differ greatly from one another.
Unlock Deck
Unlock for access to all 187 flashcards in this deck.
Unlock Deck
k this deck
75
The amount spent on textbooks for the fall term was recorded for a sample of five university students - $400, $350, $600, $525, and $450. Calculate the value of the sample standard deviation
For the data.
A)$250
B)$450
C)$99.37
D)$98.75
For the data.
A)$250
B)$450
C)$99.37
D)$98.75
Unlock Deck
Unlock for access to all 187 flashcards in this deck.
Unlock Deck
k this deck
76
The ages of five randomly chosen professors are 47, 55, 52, 63, and 66. Calculate the
sample variance of these ages.
sample variance of these ages.
Unlock Deck
Unlock for access to all 187 flashcards in this deck.
Unlock Deck
k this deck
77
The top speeds for a sample of five new automobiles are listed below. Calculate the standard deviation of the speeds. Round to four decimal places.
195, 135, 200, 190, 150
A)276.6903
B)29.4534
C)196.6443
D)155.51
195, 135, 200, 190, 150
A)276.6903
B)29.4534
C)196.6443
D)155.51
Unlock Deck
Unlock for access to all 187 flashcards in this deck.
Unlock Deck
k this deck
78
In skewed distributions, the mean is the best measure of the center of the distribution since it is
least affected by extreme observations.
least affected by extreme observations.
Unlock Deck
Unlock for access to all 187 flashcards in this deck.
Unlock Deck
k this deck
79
Calculate the standard deviation of a sample for which
A) 6.78
B) 6.19
C) 46.00
D) 164.00
A) 6.78
B) 6.19
C) 46.00
D) 164.00
Unlock Deck
Unlock for access to all 187 flashcards in this deck.
Unlock Deck
k this deck
80
The calculator screens summarize a data set. a. Identify the smallest measurement in the data set.
b. Identify the largest measurement in the data set.
c. Calculate the range of the data set.
a. Identify the smallest measurement in the data set.b. Identify the largest measurement in the data set.
c. Calculate the range of the data set.
Unlock Deck
Unlock for access to all 187 flashcards in this deck.
Unlock Deck
k this deck
Unlock Deck
Unlock for access to all 187 flashcards in this deck.


