Deck 2: Exploring Relationships Between Variables
Full screen (f)
Question
Question
Question
Question
Question
It takes a while for new factory workers to master a complex assembly process. During the first
Month new employees work, the company tracks the number of days they have been on the job and
The length of time it takes them to complete an assembly. The correlation is most likely to be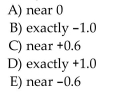
Month new employees work, the company tracks the number of days they have been on the job and
The length of time it takes them to complete an assembly. The correlation is most likely to be
Question
Question
Question
Question

A) is 0.35
B) cannot be determined.
C) is 0.70
D) is 0.90
E) is 0.50
Question
Question
researcher studied the relationship between family income and amount of money spent on an
Automobile. She calculated that
Which is the correct interpretaion?
A) 45% of the price of the car can be predicted by using income.
B) 45% of the variability in car price can be explained by using income.
C) The car price fluctuates 45% more than income.
D) The probability of predicting the correct price of a car is 45%.
E) None of these
Question
A regression analysis of students' college grade point averages (GPAs) and their high school GPAs
Found
11) Which of these is true?
I) High school GPA accounts for 31.1% of college GPA.
II) 31.1% of college GPAs can be correctly predicted with this model.
III) 31.1% of the variance in college GPA can be accounted for by the model
A) I only
B) none of these
C) II only
D) III only
E) I and II
Found
11) Which of these is true?
I) High school GPA accounts for 31.1% of college GPA.
II) 31.1% of college GPAs can be correctly predicted with this model.
III) 31.1% of the variance in college GPA can be accounted for by the model
A) I only
B) none of these
C) II only
D) III only
E) I and II
Question
A silly psychology student gathers data on the shoe size of 30 of his classmates and their GPA's.
The correlation coefficient between these two variables is most likely to be
The correlation coefficient between these two variables is most likely to be
Question
Question
The correlation between a family's weekly income and the amount they spend on restaurant meals
Is found to be
Which must be true?
I) Families tend to spend about 30% of their incomes in restaurants.
II) In general, the higher the income, the more the family spends in restaurants.
III) The line of best fit passes through 30% of the (income, restaurant$) data points.
A) II only
B) II and III only
C) I only
D) I, II, and III
E) III only
Question
Question
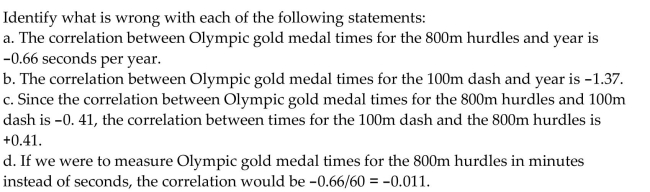
All but one of the statements below contain a mistake. Which one could be true? 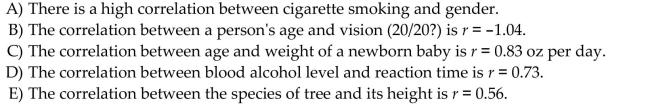
Question
If the point in the upper left corner of the scatterplot is removed, what will happen to the
Correlation (r) and the slope of the line of best fit (b)?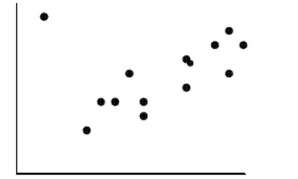
A) r will decrease and b will increase.
B) They will not change.
C) r will increase and b will decrease.
D) Both will increase.
E) Both will decrease.
Correlation (r) and the slope of the line of best fit (b)?
A) r will decrease and b will increase.
B) They will not change.
C) r will increase and b will decrease.
D) Both will increase.
E) Both will decrease.
Question
Question
Question
Question
Variables X and Y have  0.40. If we decrease each X value by 0.1, double each Y value, and then
Interchange them (put X on the Y-axis and vice versa) the new correlation will be
A) 0.15
B) 0.40
C) 0.60
D) 0.80
E) -0.40
0.40. If we decrease each X value by 0.1, double each Y value, and thenInterchange them (put X on the Y-axis and vice versa) the new correlation will be
A) 0.15
B) 0.40
C) 0.60
D) 0.80
E) -0.40
Question
Question
Question
Question
Question
The relationship between the number of hours a person practices a task and the time it takes them
To complete the task is calculated to have R
) The value of the correlation coefficient is
A) 0.753
B) 0.238
C) -0.238
D) -0.753
E) 2.38
To complete the task is calculated to have R
) The value of the correlation coefficient is
A) 0.753
B) 0.238
C) -0.238
D) -0.753
E) 2.38
Question
Question
Question
A regression analysis of students' AP* Statistics test scores and the number of hours they spent
Doing homework found
0)32 . Which of these is true?
I) 32% of student test scores can be correctly predicted with this model.
II) Homework accounts for 32% of your grade in AP* Stats.
III) There's a 32% chance that you'll get the score this model predicts for you.
A) I and II
B) none of these
C) II only
D) III only
E) I only
Question
Question
Question
This regression analysis examines the relationship between the number of years of formal
Education a person has and their annual income. According to this model, about how much more
Money do people who finish a 4-year college program earn each year, on average, than those with
Only a 2-year degree?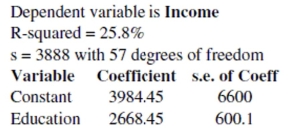
A) $2710
B) $9321
C) $2006
D) $5337
E) $7968
Education a person has and their annual income. According to this model, about how much more
Money do people who finish a 4-year college program earn each year, on average, than those with
Only a 2-year degree?
A) $2710
B) $9321
C) $2006
D) $5337
E) $7968
Question
Computer output in the scenario described in problem #8 reports that  . Which is the correct
Interpretation of this value?
A) The slope of the regression line is 2.3 lights per dollar.
B) The slope of the regression line is $2.30 per light.
C) The initial cost, even with no lights is $2.30
D) The correlation is 2.3.
E) The average prediction error of the regression line is $2.30.
. Which is the correctInterpretation of this value?
A) The slope of the regression line is 2.3 lights per dollar.
B) The slope of the regression line is $2.30 per light.
C) The initial cost, even with no lights is $2.30
D) The correlation is 2.3.
E) The average prediction error of the regression line is $2.30.
Question
Question
Question
Question
A scatterplot of log(Y) vs. log(X) reveals a linear pattern with very little scatter. It is probably true
That …
That …
Question
It's easy to measure the circumference of a tree's trunk, but not so easy to measure its height.
Foresters developed a model for ponderosa pines that they use to predict the tree's height (in feet)
From the circumference of its trunk (in inches): ln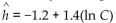
) ) A lumberjack finds a tree
With a circumference of 60"; how tall does this model estimate the tree to be?
A) 93'
B) 83'
C) 5'
D) 11'
E) 19'
Foresters developed a model for ponderosa pines that they use to predict the tree's height (in feet)
From the circumference of its trunk (in inches): ln
) ) A lumberjack finds a tree
With a circumference of 60"; how tall does this model estimate the tree to be?
A) 93'
B) 83'
C) 5'
D) 11'
E) 19'
Question
Question
Question
Question
Question
Question
The residuals plot for a linear model is shown. Which is true? 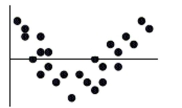
A) The linear model is no good since some residuals are large.
B) The linear model is no good because of the curve in the residuals.
C) The linear model is okay because the association between the two variables is fairly strong.
D) The linear model is okay because approximately the same number of points are above the line as below it.
E) The linear model is no good since the correlation is near 0.
Question
If r = -0.4 for the relationship between the time of day and amount of coffee in an office worker's
Mug, which are true?
I)
II) There is a linear relationship between time and amount of coffee.
III) 16% of the variability is correctly predicted by time of day.
A) II and III only
B) III
C) II
D) none of these
E) I
Mug, which are true?
I)
II) There is a linear relationship between time and amount of coffee.
III) 16% of the variability is correctly predicted by time of day.
A) II and III only
B) III
C) II
D) none of these
E) I
Question
Question
Question
The model 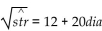 can be used to predict the breaking strength of a rope (in pounds) from
Its diameter (in inches). According to this model, how much force should a rope one-half inch in
Diameter be able to withstand?
A) 22 lbs
B) 484 lbs
C) 4.7 lbs
D) 256 lbs
E) 16 lbs
can be used to predict the breaking strength of a rope (in pounds) fromIts diameter (in inches). According to this model, how much force should a rope one-half inch in
Diameter be able to withstand?
A) 22 lbs
B) 484 lbs
C) 4.7 lbs
D) 256 lbs
E) 16 lbs
Question
In predicting the growth of the volume of a small bay by measuring the height of the water at a
Dock, a researcher is using a model of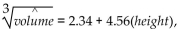
Where height is measured in m
And volume cubic miles. If the height rises to 3.45 m, what is the predicted volume?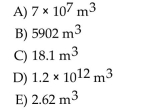
Dock, a researcher is using a model of
Where height is measured in m
And volume cubic miles. If the height rises to 3.45 m, what is the predicted volume?
Question
Which scatterplot shows a strong association between two variables even though the correlation is
Probably near zero?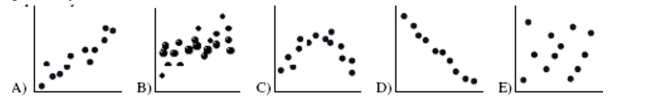
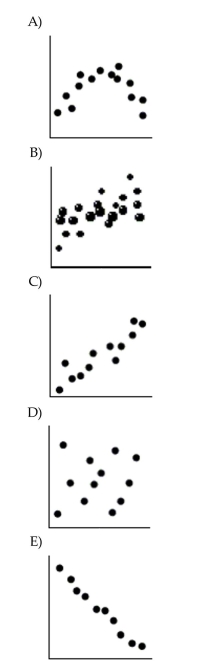
Probably near zero?
Question
Question
Question
Question
A regression model examining the amount of weight a football player can bench press found that
10 cm differences in chest size are associated with 8 kg differences in weight pressed. Which is
True?
I) The correlation between chest size and weight pressed is
II) As a player gets stronger and presses more weight his chest will get bigger.
III) A positive residual means that the player pressed more than predicted.
A) none
B) I only
C) III only
D) I and III
E) I and II
Question
The model 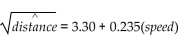 ) can be used to predict the stopping distance (in feet) for a
Car traveling at a specific speed (in mph). According to this model, about how much distance will a
Car going 65 mph need to stop?
A) 18.6 feet
B) 729.0 feet
C) 345.0 feet
D) 4.3 feet
E) 27.0 feet
) can be used to predict the stopping distance (in feet) for aCar traveling at a specific speed (in mph). According to this model, about how much distance will a
Car going 65 mph need to stop?
A) 18.6 feet
B) 729.0 feet
C) 345.0 feet
D) 4.3 feet
E) 27.0 feet
Question
Question
A least squares line of regression has been fitted to a scatterplot; the model's residuals plot is
Shown.
Which is true?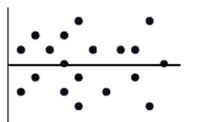
A) The linear model is poor because the correlation is near 0.
B) The linear model is appropriate.
C) A curved model would be better.
D) The linear model is poor because some residuals are large.
E) none of these
Shown.
Which is true?
A) The linear model is poor because the correlation is near 0.
B) The linear model is appropriate.
C) A curved model would be better.
D) The linear model is poor because some residuals are large.
E) none of these
Question
If the point in the upper right corner of this scatterplot is removed from the data set, then what will
Happen to the slope of the line of best fit (b) and to the correlation (r)?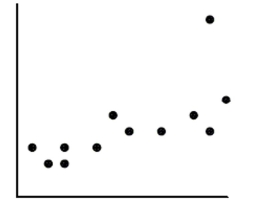
A) b will increase, and r will decrease.
B) b will decrease, and r will increase.
C) both will remain the same.
D) both will increase.
E) both will decrease.
Happen to the slope of the line of best fit (b) and to the correlation (r)?
A) b will increase, and r will decrease.
B) b will decrease, and r will increase.
C) both will remain the same.
D) both will increase.
E) both will decrease.
Question
Question
Question
A regression analysis of company profits and the amount of money the company spent on
Advertising found
0)72 . Which of these is true?
I) This model can correctly predict the profit for 72% of companies.
II) On average, about 72% of a company's profit results from advertising.
III) On average, companies spend about 72% of their profits on advertising.
A) I only
B) none of these
C) I and III
D) II only
E) III only
Question
Question
Question
Question
Baseball coaches use a radar gun to measure the speed of pitcher's fastball. They also record outcomes such as hits and
strikeouts. The scatterplot below shows the relationship between the average speed of a fastball and the average number of
strikeouts per nine innings for each pitcher on the Bulldogs, based on the past season.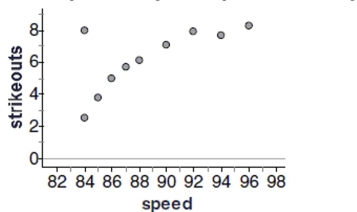
Do you think there is a pattern? Describe the association between speed and the number of
strikeouts.
Question
During a science lab, students heated water, allowed it to cool, and recorded the temperature over time. They computed the
difference between the water temperature and the room temperature. The results are in the table.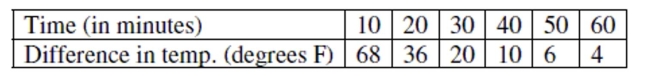
Write the equation of the least-squares regression line for the transformed data. Draw the
regression line on the scatterplot in question 2.
difference between the water temperature and the room temperature. The results are in the table.
Write the equation of the least-squares regression line for the transformed data. Draw the
regression line on the scatterplot in question 2.
Question
Question
Question
Question
Question
Which statement about correlation is true?
I) Regression based on data that are summary statistics tends to result in a higher correlation.
II) If
0)95, the response variable increases as the explanatory variable increases.
III) An outlier always decreases the correlation.
A) III only
B) II only
C) none of these
D) I, II, and III
E) I only
I) Regression based on data that are summary statistics tends to result in a higher correlation.
II) If
0)95, the response variable increases as the explanatory variable increases.
III) An outlier always decreases the correlation.
A) III only
B) II only
C) none of these
D) I, II, and III
E) I only
Question
Question
Question
A scatterplot of  vs. x shows a strong positive linear pattern. It is probably true that
A) accurate predictions can be made for Y even if extrapolation is involved.
B) the residuals plot for regression of Y on X shows a curved pattern.
C) large values of X are associated with large values of Y.
D) the correlation between X and Y is near +1.0.
E) the scatterplot of Y vs X also shows a linear pattern.
vs. x shows a strong positive linear pattern. It is probably true thatA) accurate predictions can be made for Y even if extrapolation is involved.
B) the residuals plot for regression of Y on X shows a curved pattern.
C) large values of X are associated with large values of Y.
D) the correlation between X and Y is near +1.0.
E) the scatterplot of Y vs X also shows a linear pattern.
Question
During a chemistry lab, students were asked to study a radioactive element which decays
over time. The results are in the table.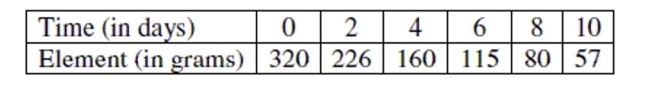
a. Model the remaining mass of the element.
b. Find the predicted amount of the element remaining after thirty minutes.
over time. The results are in the table.
a. Model the remaining mass of the element.
b. Find the predicted amount of the element remaining after thirty minutes.
Question
High Score The longer you play a video game, the higher score you can usually achieve.
An analysis of a popular game found the following relationship between the hours a
player has played a game and their corresponding high score on that game.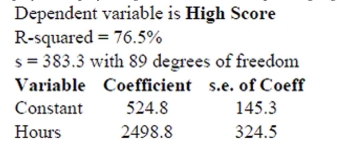
a. Write the regression equation and define the variables of your equation in context.
b. Interpret the slope in context.
c. Interpret the y-intercept in context.
d. Interpret s in context.
e. What is the correlation coefficient? Interpret this value in context.
Question
Halloween is a fun night. It seems that older children might get more candy because they can travel further while
trick-or-treating. But perhaps the youngest kids get extra candy because they are so cute. Here are some data that examine
this question, along with the regression output.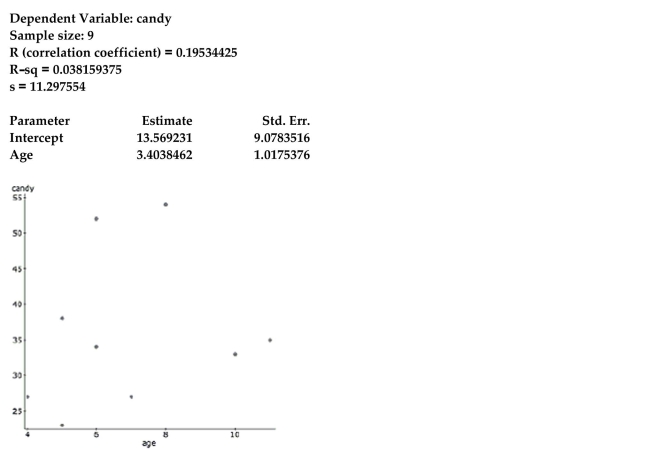
Based on the graph and the regression output, what conclusions do you draw regarding
the relationship between age and the number of pieces of candy a trick-or-treater collects?
Question
An article in the Journal of Statistics Education reported the price of diamonds of different sizes in Singapore dollars (SGD).
The following table contains a data set that is consistent with this data, adjusted to US dollars in 2004: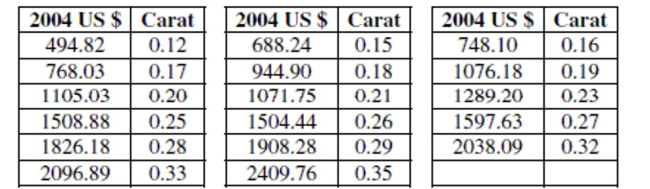
Would it be better for a customer buying a diamond to have a negative residual or a
positive residual from this model? Explain.
The following table contains a data set that is consistent with this data, adjusted to US dollars in 2004:
Would it be better for a customer buying a diamond to have a negative residual or a
positive residual from this model? Explain.
Question
A study examined the number of trees in a variety of orange groves and the corresponding number of oranges that each
grove produces in a given harvest year. Linear regression was calculated and the results are below.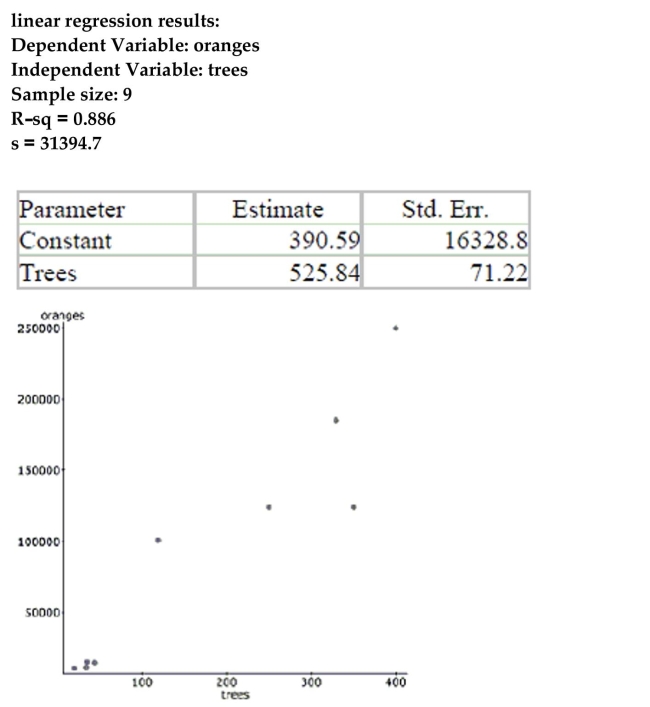
The farmer with 35 had 15,400 oranges; find the value of his residual. Show your work.
grove produces in a given harvest year. Linear regression was calculated and the results are below.
The farmer with 35 had 15,400 oranges; find the value of his residual. Show your work.

Unlock Deck
Sign up to unlock the cards in this deck!
Unlock Deck
Unlock Deck
1/165
Play
Full screen (f)
Deck 2: Exploring Relationships Between Variables
1
Education research consistently shows that students from wealthier families tend to have higher
SAT scores. The slope of the line that predicts SAT score from family income is 6.25 points per $1000,
And the correlation between the variables is 0.48. Then the slope of the line that predicts family
Income from SAT score (in $1000 per point) …
A) is 6.25
B) is 0.037
C) is 13.02
D) is 0.16
E) is 3.00
B
2
The relationship between the longevity of an animal's life and its gestation time is 0.70. If an animal
Is one standard deviation below average in life expectancy, the gestation time is predicted to be
__?__ below average.
A) 1 SD
B) 1.4 SD
C) 0.7 SD
D) none of these
E) 0.49 SD
Is one standard deviation below average in life expectancy, the gestation time is predicted to be
__?__ below average.
A) 1 SD
B) 1.4 SD
C) 0.7 SD
D) none of these
E) 0.49 SD
C
3
A lakeside restaurant found the correlation between the daily temperature and the number of
Meals they served to be 0.40. On a day when the temperature is two standard deviations above the
Mean, the number of meals they should plan on serving is _?_ the mean.
A) 0.8 SD above
B) 2.0 SD above
C) equal to
D) 0.4 SD above
E) 0.16 SD above
Meals they served to be 0.40. On a day when the temperature is two standard deviations above the
Mean, the number of meals they should plan on serving is _?_ the mean.
A) 0.8 SD above
B) 2.0 SD above
C) equal to
D) 0.4 SD above
E) 0.16 SD above
A
4
A residuals plot is useful because
I) it will help us to see whether our model is appropriate.
II) it might show a pattern in the data that was hard to see in the original scatterplot.
III) it will clearly identify influential points.
A) I and II only
B) I only
C) I, II, and III
D) I and III only
E) II only
I) it will help us to see whether our model is appropriate.
II) it might show a pattern in the data that was hard to see in the original scatterplot.
III) it will clearly identify influential points.
A) I and II only
B) I only
C) I, II, and III
D) I and III only
E) II only
Unlock Deck
Unlock for access to all 165 flashcards in this deck.
Unlock Deck
k this deck
5
It takes a while for new factory workers to master a complex assembly process. During the first
Month new employees work, the company tracks the number of days they have been on the job and
The length of time it takes them to complete an assembly. The correlation is most likely to be
Month new employees work, the company tracks the number of days they have been on the job and
The length of time it takes them to complete an assembly. The correlation is most likely to be
Unlock Deck
Unlock for access to all 165 flashcards in this deck.
Unlock Deck
k this deck
6
A business owner notes that for every extra hour his store is open, his total sales increase by a fixed
Amount. His most useful predictive model is probably...
A) linear
B) logarithmic
C) quadratic
D) exponential
E) power
Amount. His most useful predictive model is probably...
A) linear
B) logarithmic
C) quadratic
D) exponential
E) power
Unlock Deck
Unlock for access to all 165 flashcards in this deck.
Unlock Deck
k this deck
7
Two variables that are actually not related to each other may nonetheless have a very high
Correlation because they both result from some other, possibly hidden, factor. This is an example of
A) an outlier.
B) leverage.
C) regression.
D) extrapolation.
E) a lurking variable.
Correlation because they both result from some other, possibly hidden, factor. This is an example of
A) an outlier.
B) leverage.
C) regression.
D) extrapolation.
E) a lurking variable.
Unlock Deck
Unlock for access to all 165 flashcards in this deck.
Unlock Deck
k this deck
8
Which statement about residuals plots is true?
I) A curved pattern indicates nonlinear association between the variables.
II) A pattern of increasing spread indicates the predicted values become less reliable as the
Explanatory variable increases.
III) Randomness in the residuals indicates the model will predict accurately.
A) I and III only
B) II only
C) I, II, and III
D) I and II only
E) I only
Unlock Deck
Unlock for access to all 165 flashcards in this deck.
Unlock Deck
k this deck
9
A) is 0.35
B) cannot be determined.
C) is 0.70
D) is 0.90
E) is 0.50
Unlock Deck
Unlock for access to all 165 flashcards in this deck.
Unlock Deck
k this deck
10
Another company's sales increase by the same percent each year. This growth is . . .
A) exponential
B) logarithmic
C) linear
D) power
E) quadratic
A) exponential
B) logarithmic
C) linear
D) power
E) quadratic
Unlock Deck
Unlock for access to all 165 flashcards in this deck.
Unlock Deck
k this deck
11
researcher studied the relationship between family income and amount of money spent on an
Automobile. She calculated that
Which is the correct interpretaion?
A) 45% of the price of the car can be predicted by using income.
B) 45% of the variability in car price can be explained by using income.
C) The car price fluctuates 45% more than income.
D) The probability of predicting the correct price of a car is 45%.
E) None of these
Automobile. She calculated that
Which is the correct interpretaion?
A) 45% of the price of the car can be predicted by using income.
B) 45% of the variability in car price can be explained by using income.
C) The car price fluctuates 45% more than income.
D) The probability of predicting the correct price of a car is 45%.
E) None of these
Unlock Deck
Unlock for access to all 165 flashcards in this deck.
Unlock Deck
k this deck
12
A regression analysis of students' college grade point averages (GPAs) and their high school GPAs
Found
11) Which of these is true?
I) High school GPA accounts for 31.1% of college GPA.
II) 31.1% of college GPAs can be correctly predicted with this model.
III) 31.1% of the variance in college GPA can be accounted for by the model
A) I only
B) none of these
C) II only
D) III only
E) I and II
Found
11) Which of these is true?
I) High school GPA accounts for 31.1% of college GPA.
II) 31.1% of college GPAs can be correctly predicted with this model.
III) 31.1% of the variance in college GPA can be accounted for by the model
A) I only
B) none of these
C) II only
D) III only
E) I and II
Unlock Deck
Unlock for access to all 165 flashcards in this deck.
Unlock Deck
k this deck
13
A silly psychology student gathers data on the shoe size of 30 of his classmates and their GPA's.
The correlation coefficient between these two variables is most likely to be
The correlation coefficient between these two variables is most likely to be
Unlock Deck
Unlock for access to all 165 flashcards in this deck.
Unlock Deck
k this deck
14
The correlation coefficient between the hours that a person is awake during a 24-hour period and
The hours that same person is asleep during a 24-hour period is most likely to be
A) near +0.8
B) near 0
C) near -0.8
D) exactly -1.0
E) exactly +1.0
The hours that same person is asleep during a 24-hour period is most likely to be
A) near +0.8
B) near 0
C) near -0.8
D) exactly -1.0
E) exactly +1.0
Unlock Deck
Unlock for access to all 165 flashcards in this deck.
Unlock Deck
k this deck
15
The correlation between a family's weekly income and the amount they spend on restaurant meals
Is found to be
Which must be true?
I) Families tend to spend about 30% of their incomes in restaurants.
II) In general, the higher the income, the more the family spends in restaurants.
III) The line of best fit passes through 30% of the (income, restaurant$) data points.
A) II only
B) II and III only
C) I only
D) I, II, and III
E) III only
Is found to be
Which must be true?
I) Families tend to spend about 30% of their incomes in restaurants.
II) In general, the higher the income, the more the family spends in restaurants.
III) The line of best fit passes through 30% of the (income, restaurant$) data points.
A) II only
B) II and III only
C) I only
D) I, II, and III
E) III only
Unlock Deck
Unlock for access to all 165 flashcards in this deck.
Unlock Deck
k this deck
16
Which statement about re-expressing data is not true?
I) Unimodal distributions that are skewed to the left will be made more symmetric by taking the
Square root of the variable.
II) A curve in which the direction of the association changes from negative to positive
Will not benefit from re-expression.
III) One goal of re-expression may be to make the variability of the response variable more
Uniform.
A) III only
B) I, II, and III
C) II only
D) II and III
E) I only
Unlock Deck
Unlock for access to all 165 flashcards in this deck.
Unlock Deck
k this deck
17
All but one of the statements below contain a mistake. Which one could be true?
Unlock Deck
Unlock for access to all 165 flashcards in this deck.
Unlock Deck
k this deck
18
If the point in the upper left corner of the scatterplot is removed, what will happen to the
Correlation (r) and the slope of the line of best fit (b)?
A) r will decrease and b will increase.
B) They will not change.
C) r will increase and b will decrease.
D) Both will increase.
E) Both will decrease.
Correlation (r) and the slope of the line of best fit (b)?
A) r will decrease and b will increase.
B) They will not change.
C) r will increase and b will decrease.
D) Both will increase.
E) Both will decrease.
Unlock Deck
Unlock for access to all 165 flashcards in this deck.
Unlock Deck
k this deck
19
Another farmer has increased his wheat production by about the same percentage each year. His
Most useful predictive model is probably…
A) linear
B) exponential
C) quadratic
D) power
E) logarithmic
Most useful predictive model is probably…
A) linear
B) exponential
C) quadratic
D) power
E) logarithmic
Unlock Deck
Unlock for access to all 165 flashcards in this deck.
Unlock Deck
k this deck
20
A consumer group collected information on HDTVs . They created a linear model to estimate the
Cost of an HDTV (in $) based on the screen size (in inches). Which is the most likely value of the
Slope of the line of best fit?
A) 7
B) 7000
C) 70
D) 0.70
E) 700
Cost of an HDTV (in $) based on the screen size (in inches). Which is the most likely value of the
Slope of the line of best fit?
A) 7
B) 7000
C) 70
D) 0.70
E) 700
Unlock Deck
Unlock for access to all 165 flashcards in this deck.
Unlock Deck
k this deck
21
Which statement about influential points is true?
I) Removal of an influential point changes the regression line.
II) Data points that are outliers in the horizontal direction are more likely to be influential than
Points that are outliers in the vertical direction.
III) Influential points have large residuals.
A) I, II, and III
B) I only
C) II and III
D) I and III
E) I and II
Unlock Deck
Unlock for access to all 165 flashcards in this deck.
Unlock Deck
k this deck
22
Variables X and Y have 0.40. If we decrease each X value by 0.1, double each Y value, and then
Interchange them (put X on the Y-axis and vice versa) the new correlation will be
A) 0.15
B) 0.40
C) 0.60
D) 0.80
E) -0.40
0.40. If we decrease each X value by 0.1, double each Y value, and thenInterchange them (put X on the Y-axis and vice versa) the new correlation will be
A) 0.15
B) 0.40
C) 0.60
D) 0.80
E) -0.40
Unlock Deck
Unlock for access to all 165 flashcards in this deck.
Unlock Deck
k this deck
23
R-sq is a measure of ...
A) the probability that the regression line makes a correct prediction.
B) the initial predicted starting point of the response variable when x is zero.
C) the percentage of the accuracy of the regression equation.
D) the change in the y-variable that corresponds with the change in the x-variable.
E) the proportion of the variability in the response variable that is explained by the explanatory variable.
Unlock Deck
Unlock for access to all 165 flashcards in this deck.
Unlock Deck
k this deck
24
If a data point is influential it…
A) has a small residual.
B) none of these
C) is guaranteed to be extreme in the vertical direction.
D) is guaranteed to be extreme in the horizontal direction.
E) will change the slope of the regression equation.
A) has a small residual.
B) none of these
C) is guaranteed to be extreme in the vertical direction.
D) is guaranteed to be extreme in the horizontal direction.
E) will change the slope of the regression equation.
Unlock Deck
Unlock for access to all 165 flashcards in this deck.
Unlock Deck
k this deck
25
Suppose we collect data hoping to be able to estimate the prices of commonly owned new cars (in
$) from their lengths (in feet). Of these possibilities, the slope of the line of best fit is most likely to
Be
A) 300
B) 30
C) 30,000
D) 3
E) 3000
$) from their lengths (in feet). Of these possibilities, the slope of the line of best fit is most likely to
Be
A) 300
B) 30
C) 30,000
D) 3
E) 3000
Unlock Deck
Unlock for access to all 165 flashcards in this deck.
Unlock Deck
k this deck
26
Which of the following is not a source of caution in regression between two variables?
A) an outlier
B) extrapolation
C) subgroups with differences
D) All of these are potential problems.
E) a lurking variable
A) an outlier
B) extrapolation
C) subgroups with differences
D) All of these are potential problems.
E) a lurking variable
Unlock Deck
Unlock for access to all 165 flashcards in this deck.
Unlock Deck
k this deck
27
The relationship between the number of hours a person practices a task and the time it takes them
To complete the task is calculated to have R
) The value of the correlation coefficient is
A) 0.753
B) 0.238
C) -0.238
D) -0.753
E) 2.38
To complete the task is calculated to have R
) The value of the correlation coefficient is
A) 0.753
B) 0.238
C) -0.238
D) -0.753
E) 2.38
Unlock Deck
Unlock for access to all 165 flashcards in this deck.
Unlock Deck
k this deck
28
A regression model examining the amount of distance a long distance runner runs (in miles) to
Predict the amount of fluid the runner drinks (ounces) has a slope of 4.6. Which interpretation is
Appropriate?
A) A runner drinks a minimum of 4.6 oz.
B) We predict 4.6 miles for every ounce that is drunk.
C) Each mile adds 4.6 more ounces.
D) We predict for every mile run, the runner drinks 4.6 more ounces.
E) The correlation is needed to interpret this value.
Unlock Deck
Unlock for access to all 165 flashcards in this deck.
Unlock Deck
k this deck
29
All but one of the statements below contain a mistake. Which one could be true?
A) The number of apricots on a tree and the amount of fertilizer have a 1.12 correlation.
B) There is a strong correlation between type of preferred pet and income level.
C) The correlation between the height of a bean plant and the day is 0.78 in/day.
D) The correlation between your golf score and the number of hours you practice is -0.36.
E) The correlation between the time it takes to get ready in the morning and gender is 0.78.
Unlock Deck
Unlock for access to all 165 flashcards in this deck.
Unlock Deck
k this deck
30
A regression analysis of students' AP* Statistics test scores and the number of hours they spent
Doing homework found
0)32 . Which of these is true?
I) 32% of student test scores can be correctly predicted with this model.
II) Homework accounts for 32% of your grade in AP* Stats.
III) There's a 32% chance that you'll get the score this model predicts for you.
A) I and II
B) none of these
C) II only
D) III only
E) I only
Doing homework found
0)32 . Which of these is true?
I) 32% of student test scores can be correctly predicted with this model.
II) Homework accounts for 32% of your grade in AP* Stats.
III) There's a 32% chance that you'll get the score this model predicts for you.
A) I and II
B) none of these
C) II only
D) III only
E) I only
Unlock Deck
Unlock for access to all 165 flashcards in this deck.
Unlock Deck
k this deck
31
An 8th grade class develops a linear model that predicts the number of cheerios (a small round cereal) that fit on the
circumference of a plate by using the diameter in inches. Their model is chee^rios = 0.56 + 5.11(diameter).
If the diameter is increased from 4 inches to 14 inches, the predicted number of cheerios will
Increase by about…
A) 10
B) none of these
C) 21
D) 51
E) 72
circumference of a plate by using the diameter in inches. Their model is chee^rios = 0.56 + 5.11(diameter).
If the diameter is increased from 4 inches to 14 inches, the predicted number of cheerios will
Increase by about…
A) 10
B) none of these
C) 21
D) 51
E) 72
Unlock Deck
Unlock for access to all 165 flashcards in this deck.
Unlock Deck
k this deck
32
A medical researcher finds that the more overweight a person is, the higher his pulse rate tends to
Be) In fact, the model suggests that 12-pound differences in weight are associated with differences
In pulse rate of 4 beats per minute. Which is true?
I) The correlation between pulse rate and weight is 0.33
II) If you lose 6 pounds, your pulse rate will slow down 2 beats per minute.
III) A positive residual means a person's pulse rate is higher than the model predicts.
A) II only
B) none
C) II and III only
D) I only
E) III only
Unlock Deck
Unlock for access to all 165 flashcards in this deck.
Unlock Deck
k this deck
33
This regression analysis examines the relationship between the number of years of formal
Education a person has and their annual income. According to this model, about how much more
Money do people who finish a 4-year college program earn each year, on average, than those with
Only a 2-year degree?
A) $2710
B) $9321
C) $2006
D) $5337
E) $7968
Education a person has and their annual income. According to this model, about how much more
Money do people who finish a 4-year college program earn each year, on average, than those with
Only a 2-year degree?
A) $2710
B) $9321
C) $2006
D) $5337
E) $7968
Unlock Deck
Unlock for access to all 165 flashcards in this deck.
Unlock Deck
k this deck
34
Computer output in the scenario described in problem #8 reports that . Which is the correct
Interpretation of this value?
A) The slope of the regression line is 2.3 lights per dollar.
B) The slope of the regression line is $2.30 per light.
C) The initial cost, even with no lights is $2.30
D) The correlation is 2.3.
E) The average prediction error of the regression line is $2.30.
. Which is the correctInterpretation of this value?
A) The slope of the regression line is 2.3 lights per dollar.
B) The slope of the regression line is $2.30 per light.
C) The initial cost, even with no lights is $2.30
D) The correlation is 2.3.
E) The average prediction error of the regression line is $2.30.
Unlock Deck
Unlock for access to all 165 flashcards in this deck.
Unlock Deck
k this deck
35
Although there are annual ups and downs, over the long run, growth in the stock market averages
About 9% per year. A model that best describes the value of a stock portfolio is probably:
A) linear
B) logarithmic
C) quadratic
D) power
E) exponential
About 9% per year. A model that best describes the value of a stock portfolio is probably:
A) linear
B) logarithmic
C) quadratic
D) power
E) exponential
Unlock Deck
Unlock for access to all 165 flashcards in this deck.
Unlock Deck
k this deck
36
When using midterm exam scores to predict a student's final grade in a class, the student would
Prefer to have a
A) negative residual, because that means the students final grade is higher than we would predict with the model.
B) residual equal to zero, because that means the student's final grade is exactly what we would predict with the model.
C) positive residual, because that means the student's final grade is lower than we would predict with the model.
D) positive residual, because that means the student's final grade is higher than we would predict with the model.
E) negative residual, because that means the student's final grade is lower than we would predict with the model.
Unlock Deck
Unlock for access to all 165 flashcards in this deck.
Unlock Deck
k this deck
37
A correlation of zero between two quantitative variables means that
A) none of these
B) there is no association between the two variables.
C) there is no linear association between the two variables.
D) re-expressing the data will guarantee a linear association between the two variables.
E) we have done something wrong in our calculation of r.
A) none of these
B) there is no association between the two variables.
C) there is no linear association between the two variables.
D) re-expressing the data will guarantee a linear association between the two variables.
E) we have done something wrong in our calculation of r.
Unlock Deck
Unlock for access to all 165 flashcards in this deck.
Unlock Deck
k this deck
38
A scatterplot of log(Y) vs. log(X) reveals a linear pattern with very little scatter. It is probably true
That …
That …
Unlock Deck
Unlock for access to all 165 flashcards in this deck.
Unlock Deck
k this deck
39
It's easy to measure the circumference of a tree's trunk, but not so easy to measure its height.
Foresters developed a model for ponderosa pines that they use to predict the tree's height (in feet)
From the circumference of its trunk (in inches): ln
) ) A lumberjack finds a tree
With a circumference of 60"; how tall does this model estimate the tree to be?
A) 93'
B) 83'
C) 5'
D) 11'
E) 19'
Foresters developed a model for ponderosa pines that they use to predict the tree's height (in feet)
From the circumference of its trunk (in inches): ln
) ) A lumberjack finds a tree
With a circumference of 60"; how tall does this model estimate the tree to be?
A) 93'
B) 83'
C) 5'
D) 11'
E) 19'
Unlock Deck
Unlock for access to all 165 flashcards in this deck.
Unlock Deck
k this deck
40
If a data set has a relationship that is best described by a linear model, than the residual plot will
A) be an unknown shape.
B) have no pattern with a correlation near 0.
C) none of these
D) also have a linear pattern with a similar correlation.
E) have a curved pattern, like a parabola.
A) be an unknown shape.
B) have no pattern with a correlation near 0.
C) none of these
D) also have a linear pattern with a similar correlation.
E) have a curved pattern, like a parabola.
Unlock Deck
Unlock for access to all 165 flashcards in this deck.
Unlock Deck
k this deck
41
The auto insurance industry crashed some test vehicles into a cement barrier at speeds of 5 to 25
Mph to investigate the amount of damage to the cars. They found a correlation of r = 0.60 between
Speed (MPH) and damage ($). If the speed at which a car hit the barrier is 1.5 standard deviations
Above the mean speed, we expect the damage to be _?__ the mean damage.
A) equal to
B) 0.90 SD above
C) 1.5 SD above
D) 0.60 SD above
E) 0.36 SD above
Unlock Deck
Unlock for access to all 165 flashcards in this deck.
Unlock Deck
k this deck
42
A regression equation is found that predicts the increased cost of a home owner's electricity bill
Given the number of holiday lights they put on the outside of their house. The equation is dol^lars =
2)5 + 0.02(light). If a house has 400 lights and a $15 increase in their electricity cost, find their
Residual.
A) $5
B) $20
C) $15
D) -$15
E) -$5
Given the number of holiday lights they put on the outside of their house. The equation is dol^lars =
2)5 + 0.02(light). If a house has 400 lights and a $15 increase in their electricity cost, find their
Residual.
A) $5
B) $20
C) $15
D) -$15
E) -$5
Unlock Deck
Unlock for access to all 165 flashcards in this deck.
Unlock Deck
k this deck
43
A company's sales increase by the same amount each year. This growth is . . .
A) logarithmic
B) power
C) linear
D) exponential
E) quadratic
A) logarithmic
B) power
C) linear
D) exponential
E) quadratic
Unlock Deck
Unlock for access to all 165 flashcards in this deck.
Unlock Deck
k this deck
44
We can use the length of a man's hand span to predict his height, with a correlation coefficient of r
= 0)60. If change our measurements from cm to m, the new correlation will be
A) 6
B) none of these
C) 0.006
D) 0.06
E) 0.60
= 0)60. If change our measurements from cm to m, the new correlation will be
A) 6
B) none of these
C) 0.006
D) 0.06
E) 0.60
Unlock Deck
Unlock for access to all 165 flashcards in this deck.
Unlock Deck
k this deck
45
The residuals plot for a linear model is shown. Which is true?
A) The linear model is no good since some residuals are large.
B) The linear model is no good because of the curve in the residuals.
C) The linear model is okay because the association between the two variables is fairly strong.
D) The linear model is okay because approximately the same number of points are above the line as below it.
E) The linear model is no good since the correlation is near 0.
Unlock Deck
Unlock for access to all 165 flashcards in this deck.
Unlock Deck
k this deck
46
If r = -0.4 for the relationship between the time of day and amount of coffee in an office worker's
Mug, which are true?
I)
II) There is a linear relationship between time and amount of coffee.
III) 16% of the variability is correctly predicted by time of day.
A) II and III only
B) III
C) II
D) none of these
E) I
Mug, which are true?
I)
II) There is a linear relationship between time and amount of coffee.
III) 16% of the variability is correctly predicted by time of day.
A) II and III only
B) III
C) II
D) none of these
E) I
Unlock Deck
Unlock for access to all 165 flashcards in this deck.
Unlock Deck
k this deck
47
A residual plot that has no pattern is a sign that…
A) the original data is straight and the regression line is not a good model.
B) the original data is straight and the regression line is a good model.
C) the original data is curved and the regression line is a good model.
D) the original data is curved and the regression line is not a good model.
E) the model is not a good one, because there is no pattern.
Unlock Deck
Unlock for access to all 165 flashcards in this deck.
Unlock Deck
k this deck
48
For families who live in apartments the correlation between the family's income and the amount of
Rent they pay is r = 0.60. Which is true?
I) In general, families with higher incomes pay more in rent.
II) On average, families spend 60% of their income on rent.
III) The regression line passes through 60% of the (income$, rent$) data points.
A) I and III only
B) I, II, and III
C) I only
D) I and II only
E) II only
Unlock Deck
Unlock for access to all 165 flashcards in this deck.
Unlock Deck
k this deck
49
The model can be used to predict the breaking strength of a rope (in pounds) from
Its diameter (in inches). According to this model, how much force should a rope one-half inch in
Diameter be able to withstand?
A) 22 lbs
B) 484 lbs
C) 4.7 lbs
D) 256 lbs
E) 16 lbs
can be used to predict the breaking strength of a rope (in pounds) fromIts diameter (in inches). According to this model, how much force should a rope one-half inch in
Diameter be able to withstand?
A) 22 lbs
B) 484 lbs
C) 4.7 lbs
D) 256 lbs
E) 16 lbs
Unlock Deck
Unlock for access to all 165 flashcards in this deck.
Unlock Deck
k this deck
50
In predicting the growth of the volume of a small bay by measuring the height of the water at a
Dock, a researcher is using a model of
Where height is measured in m
And volume cubic miles. If the height rises to 3.45 m, what is the predicted volume?
Dock, a researcher is using a model of
Where height is measured in m
And volume cubic miles. If the height rises to 3.45 m, what is the predicted volume?
Unlock Deck
Unlock for access to all 165 flashcards in this deck.
Unlock Deck
k this deck
51
Which scatterplot shows a strong association between two variables even though the correlation is
Probably near zero?
Probably near zero?
Unlock Deck
Unlock for access to all 165 flashcards in this deck.
Unlock Deck
k this deck
52
The price of first class stamp has followed inflation over time and has increased at a constant
Percentage over time. The most useful predictive model is probably…
A) power
B) logarithmic
C) linear
D) quadratic
E) exponential
Percentage over time. The most useful predictive model is probably…
A) power
B) logarithmic
C) linear
D) quadratic
E) exponential
Unlock Deck
Unlock for access to all 165 flashcards in this deck.
Unlock Deck
k this deck
53
Researchers studying growth patterns of children collect data on the heights of fathers and sons.
The correlation between the fathers' heights and the heights of their 16 year-old sons is most likely
To be . . .
A) near +0.7
B) near +1.0
C) near -1.0
D) near 0
E) somewhat greater than 1.0
The correlation between the fathers' heights and the heights of their 16 year-old sons is most likely
To be . . .
A) near +0.7
B) near +1.0
C) near -1.0
D) near 0
E) somewhat greater than 1.0
Unlock Deck
Unlock for access to all 165 flashcards in this deck.
Unlock Deck
k this deck
54
The correlation coefficient between high school grade point average (GPA) and college GPA is
0)560. For a student with a high school GPA that is 2.5 standard deviations above the mean, we
Would expect that student to have a college GPA that is ______ the mean.
A) 2.5 SD above
B) 1.4 SD above
C) equal to
D) 0.56 SD above
0)560. For a student with a high school GPA that is 2.5 standard deviations above the mean, we
Would expect that student to have a college GPA that is ______ the mean.
A) 2.5 SD above
B) 1.4 SD above
C) equal to
D) 0.56 SD above
Unlock Deck
Unlock for access to all 165 flashcards in this deck.
Unlock Deck
k this deck
55
A regression model examining the amount of weight a football player can bench press found that
10 cm differences in chest size are associated with 8 kg differences in weight pressed. Which is
True?
I) The correlation between chest size and weight pressed is
II) As a player gets stronger and presses more weight his chest will get bigger.
III) A positive residual means that the player pressed more than predicted.
A) none
B) I only
C) III only
D) I and III
E) I and II
10 cm differences in chest size are associated with 8 kg differences in weight pressed. Which is
True?
I) The correlation between chest size and weight pressed is
II) As a player gets stronger and presses more weight his chest will get bigger.
III) A positive residual means that the player pressed more than predicted.
A) none
B) I only
C) III only
D) I and III
E) I and II
Unlock Deck
Unlock for access to all 165 flashcards in this deck.
Unlock Deck
k this deck
56
The model ) can be used to predict the stopping distance (in feet) for a
Car traveling at a specific speed (in mph). According to this model, about how much distance will a
Car going 65 mph need to stop?
A) 18.6 feet
B) 729.0 feet
C) 345.0 feet
D) 4.3 feet
E) 27.0 feet
) can be used to predict the stopping distance (in feet) for aCar traveling at a specific speed (in mph). According to this model, about how much distance will a
Car going 65 mph need to stop?
A) 18.6 feet
B) 729.0 feet
C) 345.0 feet
D) 4.3 feet
E) 27.0 feet
Unlock Deck
Unlock for access to all 165 flashcards in this deck.
Unlock Deck
k this deck
57
Residuals are . . .
A) variation in the data that is explained by the model.
B) possible models not explored by the researcher.
C) none of these
D) the difference between observed responses and values predicted by the model.
E) data collected from individuals that is not consistent with the rest of the group.
A) variation in the data that is explained by the model.
B) possible models not explored by the researcher.
C) none of these
D) the difference between observed responses and values predicted by the model.
E) data collected from individuals that is not consistent with the rest of the group.
Unlock Deck
Unlock for access to all 165 flashcards in this deck.
Unlock Deck
k this deck
58
A least squares line of regression has been fitted to a scatterplot; the model's residuals plot is
Shown.
Which is true?
A) The linear model is poor because the correlation is near 0.
B) The linear model is appropriate.
C) A curved model would be better.
D) The linear model is poor because some residuals are large.
E) none of these
Shown.
Which is true?
A) The linear model is poor because the correlation is near 0.
B) The linear model is appropriate.
C) A curved model would be better.
D) The linear model is poor because some residuals are large.
E) none of these
Unlock Deck
Unlock for access to all 165 flashcards in this deck.
Unlock Deck
k this deck
59
If the point in the upper right corner of this scatterplot is removed from the data set, then what will
Happen to the slope of the line of best fit (b) and to the correlation (r)?
A) b will increase, and r will decrease.
B) b will decrease, and r will increase.
C) both will remain the same.
D) both will increase.
E) both will decrease.
Happen to the slope of the line of best fit (b) and to the correlation (r)?
A) b will increase, and r will decrease.
B) b will decrease, and r will increase.
C) both will remain the same.
D) both will increase.
E) both will decrease.
Unlock Deck
Unlock for access to all 165 flashcards in this deck.
Unlock Deck
k this deck
60
Medical records indicate that people with more education tend to live longer; the correlation is 0.48.
The slope of the linear model that predicts lifespan from years of education suggests that on average
People tend to live 0.8 extra years for each additional year of education they have. The slope of the
Line that would predict years of education from lifespan is
A) 0.384
B) 1.67
C) 0.8
D) 1.25
E) 0.288
Unlock Deck
Unlock for access to all 165 flashcards in this deck.
Unlock Deck
k this deck
61
Math and Verbal Suppose the correlation between SAT Verbal scores and Math scores is
0.57 and that these scores are normally distributed. If a student's Verbal score places her at
the 90th percentile, at what percentile would you predict her Math score to be?
(SHOW WORK)
0.57 and that these scores are normally distributed. If a student's Verbal score places her at
the 90th percentile, at what percentile would you predict her Math score to be?
(SHOW WORK)
Unlock Deck
Unlock for access to all 165 flashcards in this deck.
Unlock Deck
k this deck
62
A regression analysis of company profits and the amount of money the company spent on
Advertising found
0)72 . Which of these is true?
I) This model can correctly predict the profit for 72% of companies.
II) On average, about 72% of a company's profit results from advertising.
III) On average, companies spend about 72% of their profits on advertising.
A) I only
B) none of these
C) I and III
D) II only
E) III only
Advertising found
0)72 . Which of these is true?
I) This model can correctly predict the profit for 72% of companies.
II) On average, about 72% of a company's profit results from advertising.
III) On average, companies spend about 72% of their profits on advertising.
A) I only
B) none of these
C) I and III
D) II only
E) III only
Unlock Deck
Unlock for access to all 165 flashcards in this deck.
Unlock Deck
k this deck
63
Using the equation in number #8 again, if a homeowner doubles the number of lights he uses from
500 to 1000, how much do we predict he will increase his electric bill by?
A) $22.50
B) $35
C) $12.50
D) $2
E) $10
500 to 1000, how much do we predict he will increase his electric bill by?
A) $22.50
B) $35
C) $12.50
D) $2
E) $10
Unlock Deck
Unlock for access to all 165 flashcards in this deck.
Unlock Deck
k this deck
64
An 8th grade class develops a linear model that predicts the number of cheerios (a small round cereal) that fit on the
circumference of a plate by using the diameter in inches. Their model is chee^rios = 0.56 + 5.11(diameter).
The slope of this model is best interpreted in context as…
A) For every 1 inch of diameter, the circumference holds about 0.56 more cheerios.
B) For every 1 inch of diameter, the circumference holds about 5.11 more cheerios.
C) For every 5.11 inches of diameter, the circumference is about 1 cheerio bigger.
D) It takes 5.11 cheerios to fill a plate's circumference.
E) A mistake, because π is about 3.14 and that should be the slope.
Unlock Deck
Unlock for access to all 165 flashcards in this deck.
Unlock Deck
k this deck
65
All but one of these statements contain a mistake. Which could be true?
A) The correlation between the amount of fertilizer used and the yield of beans is 0.42.
B) There is a correlation of 0.63 between gender and political party.
C) The correlation between a football player's weight and the position he plays is 0.54.
D) There is a high correlation (1.09) between height of a corn stalk and its age in weeks.
E) The correlation between a car's length and its fuel efficiency is 0.71 miles per gallon.
Unlock Deck
Unlock for access to all 165 flashcards in this deck.
Unlock Deck
k this deck
66
Baseball coaches use a radar gun to measure the speed of pitcher's fastball. They also record outcomes such as hits and
strikeouts. The scatterplot below shows the relationship between the average speed of a fastball and the average number of
strikeouts per nine innings for each pitcher on the Bulldogs, based on the past season.
Do you think there is a pattern? Describe the association between speed and the number of
strikeouts.
strikeouts. The scatterplot below shows the relationship between the average speed of a fastball and the average number of
strikeouts per nine innings for each pitcher on the Bulldogs, based on the past season.
Do you think there is a pattern? Describe the association between speed and the number of
strikeouts.
Unlock Deck
Unlock for access to all 165 flashcards in this deck.
Unlock Deck
k this deck
67
During a science lab, students heated water, allowed it to cool, and recorded the temperature over time. They computed the
difference between the water temperature and the room temperature. The results are in the table.
Write the equation of the least-squares regression line for the transformed data. Draw the
regression line on the scatterplot in question 2.
difference between the water temperature and the room temperature. The results are in the table.
Write the equation of the least-squares regression line for the transformed data. Draw the
regression line on the scatterplot in question 2.
Unlock Deck
Unlock for access to all 165 flashcards in this deck.
Unlock Deck
k this deck
68
Which is true?
I) Random scatter in the residuals indicates a model with high predictive power.
II) If two variables are very strongly associated, then the correlation between them will be near +1.0
Or -1.0.
III) The higher the correlation between two variables the more likely the association is based in
Cause and effect.
A) I, II, and III
B) I and II
C) I only
D) II only
E) none
Unlock Deck
Unlock for access to all 165 flashcards in this deck.
Unlock Deck
k this deck
69
All but one of the statements below contain a mistake. Which one could be true?
A) If the correlation between blood alcohol level and reaction time is 0.73, then the correlation between reaction time and blood alcohol level is -0.73.
B) The correlation between gender and age is -0.171.
C) The correlation between height and weight is 0.568 inches per pound.
D) The correlation between weight and length of foot is 0.488.
E) The correlation between the breed of a dog and its weight is 0.435.
Unlock Deck
Unlock for access to all 165 flashcards in this deck.
Unlock Deck
k this deck
70
Unlock Deck
Unlock for access to all 165 flashcards in this deck.
Unlock Deck
k this deck
71
Over the past decade a farmer has been able to increase his wheat production by about the same
Number of bushels each year. His most useful predictive model is probably…
A) logarithmic
B) power
C) exponential
D) quadratic
E) linear
Number of bushels each year. His most useful predictive model is probably…
A) logarithmic
B) power
C) exponential
D) quadratic
E) linear
Unlock Deck
Unlock for access to all 165 flashcards in this deck.
Unlock Deck
k this deck
72
Which statement about correlation is true?
I) Regression based on data that are summary statistics tends to result in a higher correlation.
II) If
0)95, the response variable increases as the explanatory variable increases.
III) An outlier always decreases the correlation.
A) III only
B) II only
C) none of these
D) I, II, and III
E) I only
I) Regression based on data that are summary statistics tends to result in a higher correlation.
II) If
0)95, the response variable increases as the explanatory variable increases.
III) An outlier always decreases the correlation.
A) III only
B) II only
C) none of these
D) I, II, and III
E) I only
Unlock Deck
Unlock for access to all 165 flashcards in this deck.
Unlock Deck
k this deck
73
After conducting a marketing study to see what consumers thought about a new tinted
contact lens they were developing, an eyewear company reported, "Consumer satisfaction
is strongly correlated with eye color." Comment on this observation.
contact lens they were developing, an eyewear company reported, "Consumer satisfaction
is strongly correlated with eye color." Comment on this observation.
Unlock Deck
Unlock for access to all 165 flashcards in this deck.
Unlock Deck
k this deck
74
Which of the following is not a goal of re-expressing data?
A) All of these are goals of re-expressing data.
B) Make the distribution of a variable more symmetric.
C) Make the spread of several groups more alike.
D) Make the scatter in a scatterplot spread out evenly rather than following a fan shape.
E) Make the form of a scatterplot more nearly linear.
A) All of these are goals of re-expressing data.
B) Make the distribution of a variable more symmetric.
C) Make the spread of several groups more alike.
D) Make the scatter in a scatterplot spread out evenly rather than following a fan shape.
E) Make the form of a scatterplot more nearly linear.
Unlock Deck
Unlock for access to all 165 flashcards in this deck.
Unlock Deck
k this deck
75
A scatterplot of vs. x shows a strong positive linear pattern. It is probably true that
A) accurate predictions can be made for Y even if extrapolation is involved.
B) the residuals plot for regression of Y on X shows a curved pattern.
C) large values of X are associated with large values of Y.
D) the correlation between X and Y is near +1.0.
E) the scatterplot of Y vs X also shows a linear pattern.
vs. x shows a strong positive linear pattern. It is probably true thatA) accurate predictions can be made for Y even if extrapolation is involved.
B) the residuals plot for regression of Y on X shows a curved pattern.
C) large values of X are associated with large values of Y.
D) the correlation between X and Y is near +1.0.
E) the scatterplot of Y vs X also shows a linear pattern.
Unlock Deck
Unlock for access to all 165 flashcards in this deck.
Unlock Deck
k this deck
76
During a chemistry lab, students were asked to study a radioactive element which decays
over time. The results are in the table.
a. Model the remaining mass of the element.
b. Find the predicted amount of the element remaining after thirty minutes.
over time. The results are in the table.
a. Model the remaining mass of the element.
b. Find the predicted amount of the element remaining after thirty minutes.
Unlock Deck
Unlock for access to all 165 flashcards in this deck.
Unlock Deck
k this deck
77
High Score The longer you play a video game, the higher score you can usually achieve.
An analysis of a popular game found the following relationship between the hours a
player has played a game and their corresponding high score on that game.
a. Write the regression equation and define the variables of your equation in context.
b. Interpret the slope in context.
c. Interpret the y-intercept in context.
d. Interpret s in context.
e. What is the correlation coefficient? Interpret this value in context.
An analysis of a popular game found the following relationship between the hours a
player has played a game and their corresponding high score on that game.
a. Write the regression equation and define the variables of your equation in context.
b. Interpret the slope in context.
c. Interpret the y-intercept in context.
d. Interpret s in context.
e. What is the correlation coefficient? Interpret this value in context.
Unlock Deck
Unlock for access to all 165 flashcards in this deck.
Unlock Deck
k this deck
78
Halloween is a fun night. It seems that older children might get more candy because they can travel further while
trick-or-treating. But perhaps the youngest kids get extra candy because they are so cute. Here are some data that examine
this question, along with the regression output.
Based on the graph and the regression output, what conclusions do you draw regarding
the relationship between age and the number of pieces of candy a trick-or-treater collects?
trick-or-treating. But perhaps the youngest kids get extra candy because they are so cute. Here are some data that examine
this question, along with the regression output.
Based on the graph and the regression output, what conclusions do you draw regarding
the relationship between age and the number of pieces of candy a trick-or-treater collects?
Unlock Deck
Unlock for access to all 165 flashcards in this deck.
Unlock Deck
k this deck
79
An article in the Journal of Statistics Education reported the price of diamonds of different sizes in Singapore dollars (SGD).
The following table contains a data set that is consistent with this data, adjusted to US dollars in 2004:
Would it be better for a customer buying a diamond to have a negative residual or a
positive residual from this model? Explain.
The following table contains a data set that is consistent with this data, adjusted to US dollars in 2004:
Would it be better for a customer buying a diamond to have a negative residual or a
positive residual from this model? Explain.
Unlock Deck
Unlock for access to all 165 flashcards in this deck.
Unlock Deck
k this deck
80
A study examined the number of trees in a variety of orange groves and the corresponding number of oranges that each
grove produces in a given harvest year. Linear regression was calculated and the results are below.
The farmer with 35 had 15,400 oranges; find the value of his residual. Show your work.
grove produces in a given harvest year. Linear regression was calculated and the results are below.
The farmer with 35 had 15,400 oranges; find the value of his residual. Show your work.
Unlock Deck
Unlock for access to all 165 flashcards in this deck.
Unlock Deck
k this deck
Unlock Deck
Unlock for access to all 165 flashcards in this deck.


