Deck 8: Regression, Associations, and Predictive Modeling
Full screen (f)
Question
On the axes below, sketch a scatterplot described:
a. a strong negative association
b. a strong association but r is near 0
c. a weak but positive association
a. a strong negative association
b. a strong association but r is near 0
c. a weak but positive association
Question
A common objective for many school administrators is to increase the number of students
taking SAT and ACT tests from their school. The data from each state from 2003 are
reflected in the scatterplot.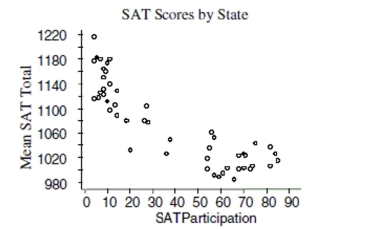
a. Write a few sentences describing the association.
b. Estimate the correlation.
c. If the point in the top left corner (4, 1215) were removed, would the correlation become
stronger, weaker, or remain about the same? Explain briefly.
d. If the point in the very middle (38, 1049) were removed, would the correlation become
stronger, weaker, or remain about the same? Explain briefly.
Question
Question
Identify what is wrong with each of the following statements:
a. The correlation between Olympic gold medal times for the 800m hurdles and year is
-0.66 seconds per year.
b. The correlation between Olympic gold medal times for the 100m dash and year is -1.37.
c. Since the correlation between Olympic gold medal times for the 800m hurdles and 100m
dash is -0. 41, the correlation between times for the 100m dash and the 800m hurdles is
+0.41.
d. If we were to measure Olympic gold medal times for the 800m hurdles in minutes
instead of seconds, the correlation would be
Question
Question
The following scatterplot shows the relationship between the time (in seconds) it took men
to run the 1500m race for the gold medal and the year of the Olympics that the race was
run in: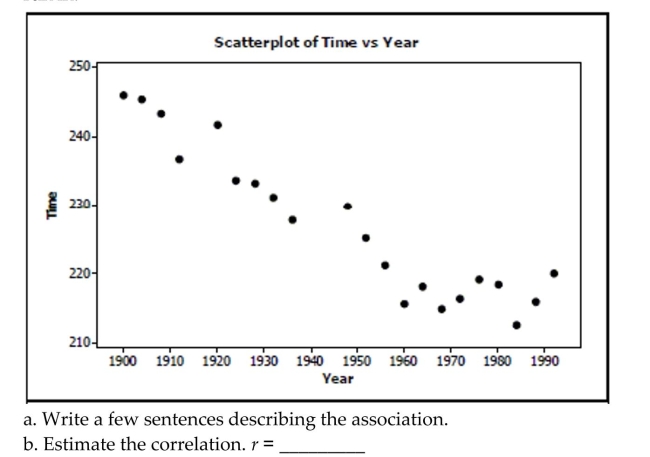
to run the 1500m race for the gold medal and the year of the Olympics that the race was
run in:
Question
Question
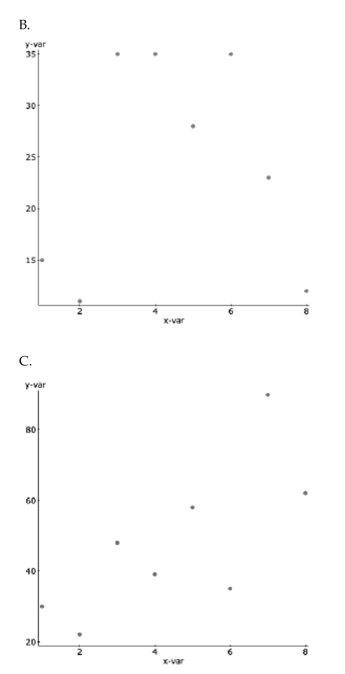
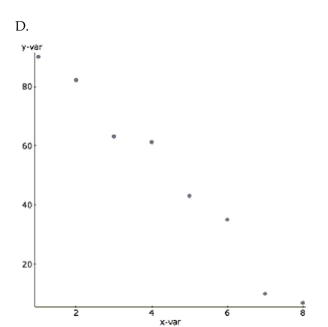
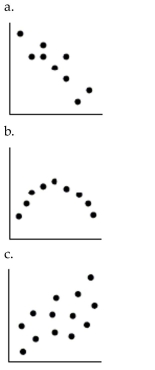
Match each graph with the appropriate correlation coefficient. 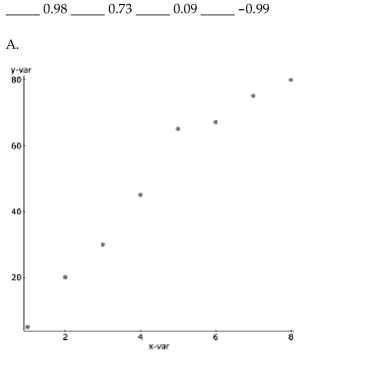
Question
Question
Question
Question
Question
Question
Question
Question
Question
Question
Researchers investigating the association between the size and strength of muscles
measured the forearm circumference (in inches) of 20 teenage boys. Then they measured
the strength of the boys' grips (in pounds). Their data are plotted.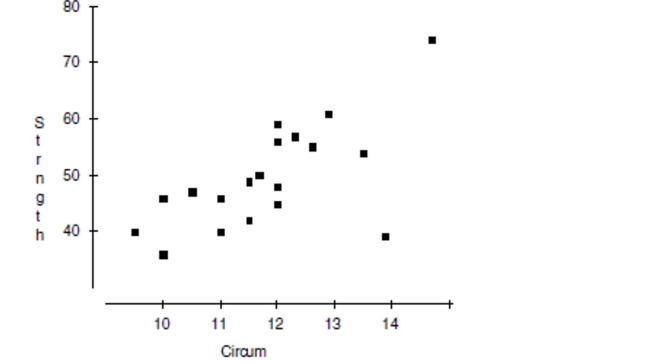
a. Write a few sentences describing the association.
b. Estimate the correlation. r = ________
c. If the point in the lower right corner (at about 14" and 38 lbs.) were removed, how would
the correlation become stronger, weaker, or remain about the same?
d. If the point in the upper right corner (at about 15" and 75 lbs.) were removed, would the
correlation become stronger, weaker, or remain about the same?
Question
Question
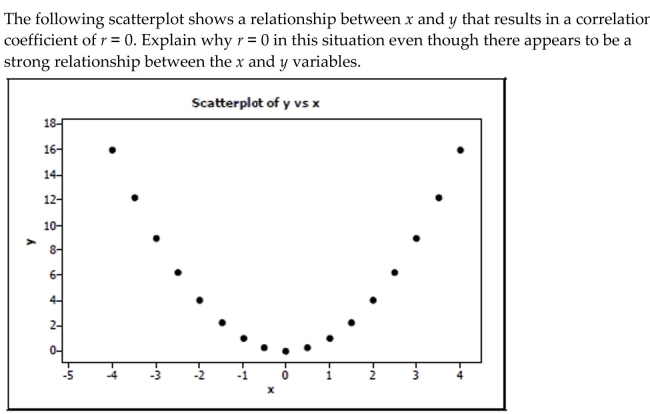
Which scatterplot shows a strong association between two variables even though the correlation is
Probably near zero?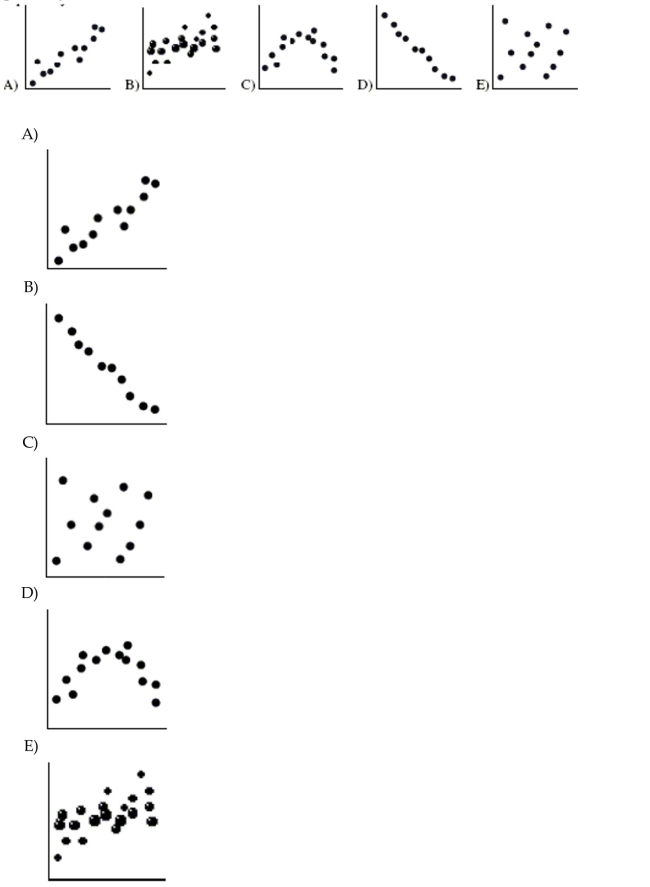
Probably near zero?
Question
The correlation between  alue, decrease each Y by 0.20, and
Interchange the variables (put X on the Y-axis and vice versa), the new correlation
A) is 0.50
B) is 0.35
C) is 0.90
D) cannot be determined.
E) is 0.70
alue, decrease each Y by 0.20, andInterchange the variables (put X on the Y-axis and vice versa), the new correlation
A) is 0.50
B) is 0.35
C) is 0.90
D) cannot be determined.
E) is 0.70
Question
Question
Question
A regression model examining the amount of weight a football player can bench press found that
10 cm differences in chest size are associated with 8 kg differences in weight pressed. Which is
True?
I) The correlation between chest size and weight pressed is
II) As a player gets stronger and presses more weight his chest will get bigger.
III) A positive residual means that the player pressed more than predicted.
A) I and III
B) none
C) I and II
D) III only
E) I only
Question
Question
Question
Assembly line Your new job at Panasony is to do the final assembly of camcorders. As you
learn how, you get faster. The company tells you that you will qualify for a raise if after 13
weeks your assembly time averages under 20 minutes. The data shows your average
assembly time during each of your first 10 weeks.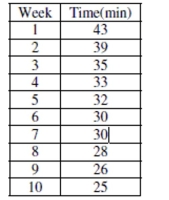
a. Which is the explanatory variable?
b. What is the correlation between these variables?
c. You want to predict whether or not you will qualify for that raise. Would it be
appropriate to use a linear model? Explain.
Question
Question
Question
The residuals plot for a linear model is shown. Which is true? 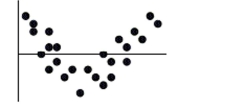
A) The linear model is okay because the association between the two variables is fairly strong.
B) The linear model is okay because approximately the same number of points are above the line as below it.
C) The linear model is no good since some residuals are large.
D) The linear model is no good because of the curve in the residuals.
E) The linear model is no good since the correlation is near 0.
Question
It takes a while for new factory workers to master a complex assembly process. During the first
Month new employees work, the company tracks the number of days they have been on the job and
The length of time it takes them to complete an assembly. The correlation is most likely to be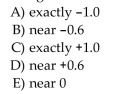
Month new employees work, the company tracks the number of days they have been on the job and
The length of time it takes them to complete an assembly. The correlation is most likely to be
Question
A) I only
B) none of these
C) I and II
D) III only
E) II only
Question
Question
Gas mileage again In the Data Desk lab last week you analyzed the association between a
car's fuel economy and its weight. Another important factor in the amount of gasoline a car
uses is the size of the engine. Called "displacement", engine size measures the volume of
the cylinders in cubic inches. The regression analysis is shown.
a. How many cars were included in this analysis?
b. What is the correlation between engine size and fuel economy?
c. A car you are thinking of buying is available with two different size engines, 190 cubic
inches or 240 cubic inches. How much difference might this make in your gas mileage?
(Show work)
Question
Question
Question
Question
Question
A least squares line of regression has been fitted to a scatterplot; the model's residuals plot is
Shown.
Which is true?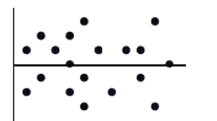
A) The linear model is poor because some residuals are large.
B) A curved model would be better.
C) The linear model is appropriate.
D) The linear model is poor because the correlation is near 0.
E) none of these
Shown.
Which is true?
A) The linear model is poor because some residuals are large.
B) A curved model would be better.
C) The linear model is appropriate.
D) The linear model is poor because the correlation is near 0.
E) none of these
Question
Question
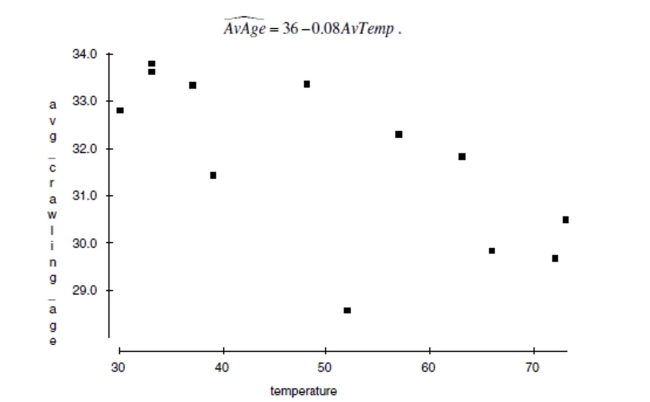
a. Draw the line of best fit on the graph. (Show your method clearly.)
b. Describe the association in context.
c. Explain (in context) what the slope of the line means.
d. Explain (in context) what the y-intercept of the line means.
e. Explain (in context) what

means.
f. In this context, what does a negative residual indicate?
Question
Taxi tires A taxi company monitoring the safety of its cabs kept track of the number of
miles tires had been driven (in thousands) and the depth of the tread remaining (in mm).
Their data are displayed in the scatterplot. They found the equation of the least squares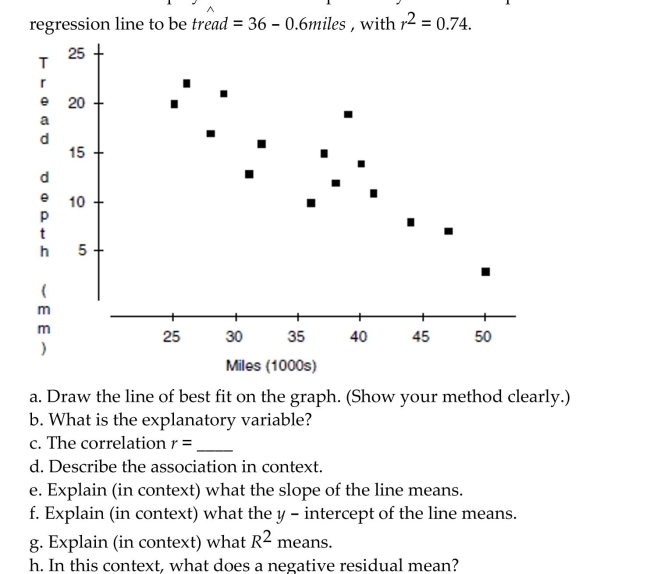
miles tires had been driven (in thousands) and the depth of the tread remaining (in mm).
Their data are displayed in the scatterplot. They found the equation of the least squares
Question
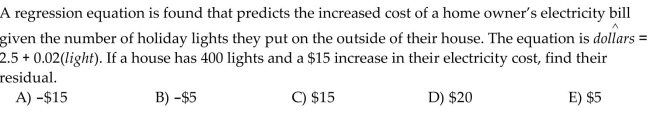
Computer output in the scenario described in problem #8 reports that  . Which is the correct
Interpretation of this value?
A) The slope of the regression line is $2.30 per light.
B) The slope of the regression line is 2.3 lights per dollar.
C) The initial cost, even with no lights is $2.30
D) The average prediction error of the regression line is $2.30.
E) The correlation is 2.3.
. Which is the correctInterpretation of this value?
A) The slope of the regression line is $2.30 per light.
B) The slope of the regression line is 2.3 lights per dollar.
C) The initial cost, even with no lights is $2.30
D) The average prediction error of the regression line is $2.30.
E) The correlation is 2.3.
Question
Question
Question
Time Wasted A group of students decide to see if there is link between wasting time on the
internet and GPA. They don't expect to find an extremely strong association, but they're
hoping for at least a weak relationship. Here are the findings.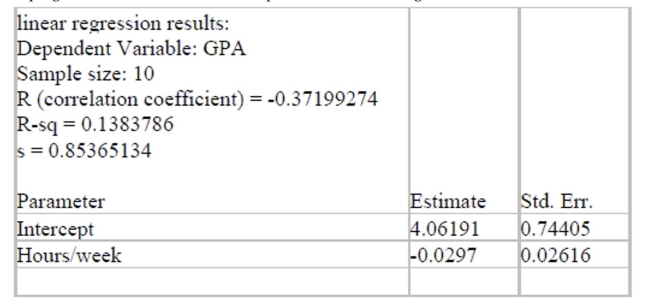
a. How strong is the relationship the students found? Describe in context with statistical
justification.
One student is concerned that the relationship is so weak, there may not actually be any
relationship at all. To test this concern, he runs a simulation where the 10 GPA's are
randomly matched with the 10 hours/week. After each random assignment, the correlation
is calculated. This process is repeated 100 times. Here is a histogram of the 100 correlations.
The correlation coefficient of -0.371 is indicated with a vertical line.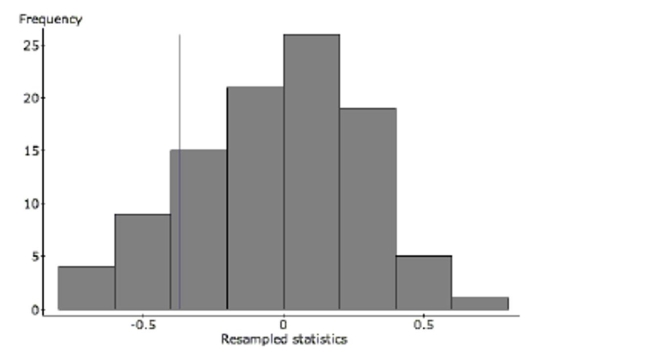
b. Do the results of this simulation confirm the suspicion that there may not be any
relationship? Refer specifically to the graph in your explanation.
Question
A) none of these
B) I
C) II
D) III
E) II and III only
Question
This regression analysis examines the relationship between the number of years of formal
Education a person has and their annual income. According to this model, about how much more
Money do people who finish a 4-year college program earn each year, on average, than those with
Only a 2-year degree?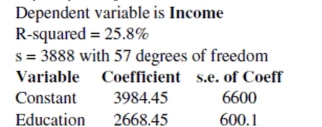
A) $7968
B) $5337
C) $9321
D) $2006
E) $2710
Education a person has and their annual income. According to this model, about how much more
Money do people who finish a 4-year college program earn each year, on average, than those with
Only a 2-year degree?
A) $7968
B) $5337
C) $9321
D) $2006
E) $2710
Question
Question
High Score The longer you play a video game, the higher score you can usually achieve.
An analysis of a popular game found the following relationship between the hours a
player has played a game and their corresponding high score on that game.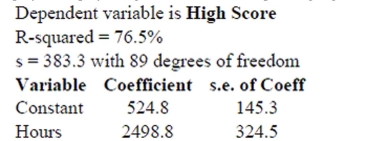
a. Write the regression equation and define the variables of your equation in context.
b. Interpret the slope in context.
c. Interpret the y-intercept in context.
d. Interpret s in context.
e. What is the correlation coefficient? Interpret this value in context.
Question
researcher studied the relationship between family income and amount of money spent on an
Automobile. She calculated that
Which is the correct interpretaion?
A) 45% of the variability in car price can be explained by using income.
B) None of these
C) The probability of predicting the correct price of a car is 45%.
D) 45% of the price of the car can be predicted by using income.
E) The car price fluctuates 45% more than income.
Question
Question

A) 6
B) 0.06
C) 0.60
D) 0.006
E) none of these
Question
Question
A silly psychology student gathers data on the shoe size of 30 of his classmates and their GPA's.
The correlation coefficient between these two variables is most likely to be
The correlation coefficient between these two variables is most likely to be
Question
Question
Question
Question
Question
Question
Question
Question
Question
Question
Question
Question
Explain the meaning of 
in the context of this problem.
in the context of this problem.
Question
Question
Question
Explain the meaning of 
in the context of this problem.
in the context of this problem.
Question
Question
Question
Question
Question
Question
Question
Question
Question
Question

Unlock Deck
Sign up to unlock the cards in this deck!
Unlock Deck
Unlock Deck
1/793
Play
Full screen (f)
Deck 8: Regression, Associations, and Predictive Modeling
1
On the axes below, sketch a scatterplot described:
a. a strong negative association
b. a strong association but r is near 0
c. a weak but positive association
a. a strong negative association
b. a strong association but r is near 0
c. a weak but positive association
2
A common objective for many school administrators is to increase the number of students
taking SAT and ACT tests from their school. The data from each state from 2003 are
reflected in the scatterplot.
a. Write a few sentences describing the association.
b. Estimate the correlation.
c. If the point in the top left corner (4, 1215) were removed, would the correlation become
stronger, weaker, or remain about the same? Explain briefly.
d. If the point in the very middle (38, 1049) were removed, would the correlation become
stronger, weaker, or remain about the same? Explain briefly.
taking SAT and ACT tests from their school. The data from each state from 2003 are
reflected in the scatterplot.
a. Write a few sentences describing the association.
b. Estimate the correlation.
c. If the point in the top left corner (4, 1215) were removed, would the correlation become
stronger, weaker, or remain about the same? Explain briefly.
d. If the point in the very middle (38, 1049) were removed, would the correlation become
stronger, weaker, or remain about the same? Explain briefly.
a. There is a moderate, negative, linear association between the percent of students
taking the SAT test and the total SAT score. It appears that the states with a larger
percentage of students taking the SAT test have lower average total scores.
b. r = -0.76 (answers between -0.6 and -0.9 are acceptable)
c. If the point in the top left corner (4, 1215) were removed, the correlation would
become stronger because the remaining points show a pattern with slightly less
scatter.
d. If the point in the very middle (38, 1049) were removed, the correlation would
remain about the same; this point does not contribute much to the scatter.
3
A consumer group collected information on HDTVs . They created a linear model to estimate the
Cost of an HDTV (in $) based on the screen size (in inches). Which is the most likely value of the
Slope of the line of best fit?
A) 70
B) 0.70
C) 7000
D) 7
E) 700
Cost of an HDTV (in $) based on the screen size (in inches). Which is the most likely value of the
Slope of the line of best fit?
A) 70
B) 0.70
C) 7000
D) 7
E) 700
A
4
Identify what is wrong with each of the following statements:
a. The correlation between Olympic gold medal times for the 800m hurdles and year is
-0.66 seconds per year.
b. The correlation between Olympic gold medal times for the 100m dash and year is -1.37.
c. Since the correlation between Olympic gold medal times for the 800m hurdles and 100m
dash is -0. 41, the correlation between times for the 100m dash and the 800m hurdles is
+0.41.
d. If we were to measure Olympic gold medal times for the 800m hurdles in minutes
instead of seconds, the correlation would be
a. The correlation between Olympic gold medal times for the 800m hurdles and year is
-0.66 seconds per year.
b. The correlation between Olympic gold medal times for the 100m dash and year is -1.37.
c. Since the correlation between Olympic gold medal times for the 800m hurdles and 100m
dash is -0. 41, the correlation between times for the 100m dash and the 800m hurdles is
+0.41.
d. If we were to measure Olympic gold medal times for the 800m hurdles in minutes
instead of seconds, the correlation would be
Unlock Deck
Unlock for access to all 793 flashcards in this deck.
Unlock Deck
k this deck
5
After conducting a survey at a pet store to see what impact having a pet had on the
condition of the yard, a news reporter stated "There appears to be a strong correlation
between the owning a pet and the condition of the yard." Comment on this observation.
condition of the yard, a news reporter stated "There appears to be a strong correlation
between the owning a pet and the condition of the yard." Comment on this observation.
Unlock Deck
Unlock for access to all 793 flashcards in this deck.
Unlock Deck
k this deck
6
The following scatterplot shows the relationship between the time (in seconds) it took men
to run the 1500m race for the gold medal and the year of the Olympics that the race was
run in:
to run the 1500m race for the gold medal and the year of the Olympics that the race was
run in:
Unlock Deck
Unlock for access to all 793 flashcards in this deck.
Unlock Deck
k this deck
7
The auto insurance industry crashed some test vehicles into a cement barrier at speeds of 5 to 25
Mph to investigate the amount of damage to the cars. They found a correlation of r = 0.60 between
Speed (MPH) and damage ($). If the speed at which a car hit the barrier is 1.5 standard deviations
Above the mean speed, we expect the damage to be _?__ the mean damage.
A) 0.90 SD above
B) 1.5 SD above
C) equal to
D) 0.36 SD above
E) 0.60 SD above
Unlock Deck
Unlock for access to all 793 flashcards in this deck.
Unlock Deck
k this deck
8
Match each graph with the appropriate correlation coefficient.
Unlock Deck
Unlock for access to all 793 flashcards in this deck.
Unlock Deck
k this deck
9
Match the following descriptions with the most likely correlation coefficient.
____ The number of hours you study and your exam score.
____ The number of siblings you have and your GPA.
____ The number of hours you practice a task and the number of minutes it takes you to
complete it.
____ The number of hours you use a pencil and its length.
A. -0.78
B. 0.13
C. 0.46
D. 0.89
____ The number of hours you study and your exam score.
____ The number of siblings you have and your GPA.
____ The number of hours you practice a task and the number of minutes it takes you to
complete it.
____ The number of hours you use a pencil and its length.
A. -0.78
B. 0.13
C. 0.46
D. 0.89
Unlock Deck
Unlock for access to all 793 flashcards in this deck.
Unlock Deck
k this deck
10
One of your classmates is reading through the program for Friday night''s football game.
Among other things, the program lists the players'' positions and their weights. Your
classmate comments, "There is a strong correlation between a player's position and their
weight."
a. Explain why your classmate's statement is in error.
b. What other variable might be listed in the program that could be used to correctly
identify a correlation with weight?
Unlock Deck
Unlock for access to all 793 flashcards in this deck.
Unlock Deck
k this deck
11
Unlock Deck
Unlock for access to all 793 flashcards in this deck.
Unlock Deck
k this deck
12
A school board study found a moderately strong negative association between the number
of hours high school seniors worked at part-time jobs after school hours and the students'
grade point averages.
a. Explain in this context what "negative association" means.
b. Hoping to improve student performance, the school board passed a resolution urging
parents to limit the number of hours students be allowed to work. Do you agree or
disagree with the school board's reasoning. Explain.
Unlock Deck
Unlock for access to all 793 flashcards in this deck.
Unlock Deck
k this deck
13
After conducting a survey of his students, a professor reported that "There appears to be a
strong correlation between grade point average and whether or not a student works."
Comment on this observation.
strong correlation between grade point average and whether or not a student works."
Comment on this observation.
Unlock Deck
Unlock for access to all 793 flashcards in this deck.
Unlock Deck
k this deck
14
Researchers studying growth patterns of children collect data on the heights of fathers and sons.
The correlation between the fathers' heights and the heights of their 16 year-old sons is most likely
To be . . .
A) near +1.0
B) somewhat greater than 1.0
C) near -1.0
D) near +0.7
E) near 0
The correlation between the fathers' heights and the heights of their 16 year-old sons is most likely
To be . . .
A) near +1.0
B) somewhat greater than 1.0
C) near -1.0
D) near +0.7
E) near 0
Unlock Deck
Unlock for access to all 793 flashcards in this deck.
Unlock Deck
k this deck
15
A researcher notes that there is a positive correlation between the temperature on a
summer day and the number of bees that he can count in his garden over a 5-minute time
span.
a. Describe what the researcher means by a positive correlation.
b. If the researcher calculates the correlation coefficient using degrees Fahrenheit instead of
Celsius, will the value be different?
summer day and the number of bees that he can count in his garden over a 5-minute time
span.
a. Describe what the researcher means by a positive correlation.
b. If the researcher calculates the correlation coefficient using degrees Fahrenheit instead of
Celsius, will the value be different?
Unlock Deck
Unlock for access to all 793 flashcards in this deck.
Unlock Deck
k this deck
16
One your classmates is working on a science project for a unit on weather. She tracks the
temperature one day, beginning at sunrise and finishing at sunset. Given that you are
know for being the stats expert, she asks you about calculating the correlation for her data.
What is the best advice you could give her?
temperature one day, beginning at sunrise and finishing at sunset. Given that you are
know for being the stats expert, she asks you about calculating the correlation for her data.
What is the best advice you could give her?
Unlock Deck
Unlock for access to all 793 flashcards in this deck.
Unlock Deck
k this deck
17
After conducting a marketing study to see what consumers thought about a new tinted
contact lens they were developing, an eyewear company reported, "Consumer satisfaction
is strongly correlated with eye color." Comment on this observation.
contact lens they were developing, an eyewear company reported, "Consumer satisfaction
is strongly correlated with eye color." Comment on this observation.
Unlock Deck
Unlock for access to all 793 flashcards in this deck.
Unlock Deck
k this deck
18
Researchers investigating the association between the size and strength of muscles
measured the forearm circumference (in inches) of 20 teenage boys. Then they measured
the strength of the boys' grips (in pounds). Their data are plotted.
a. Write a few sentences describing the association.
b. Estimate the correlation. r = ________
c. If the point in the lower right corner (at about 14" and 38 lbs.) were removed, how would
the correlation become stronger, weaker, or remain about the same?
d. If the point in the upper right corner (at about 15" and 75 lbs.) were removed, would the
correlation become stronger, weaker, or remain about the same?
measured the forearm circumference (in inches) of 20 teenage boys. Then they measured
the strength of the boys' grips (in pounds). Their data are plotted.
a. Write a few sentences describing the association.
b. Estimate the correlation. r = ________
c. If the point in the lower right corner (at about 14" and 38 lbs.) were removed, how would
the correlation become stronger, weaker, or remain about the same?
d. If the point in the upper right corner (at about 15" and 75 lbs.) were removed, would the
correlation become stronger, weaker, or remain about the same?
Unlock Deck
Unlock for access to all 793 flashcards in this deck.
Unlock Deck
k this deck
19
A study by a prominent psychologist found a moderately strong positive association
between the number of hours of sleep a person gets and the person's ability to memorize
information.
a. Explain in the context of this problem what "positive association" means.
b. Hoping to improve academic performance, the psychologist recommended the school
board allow students to take a nap prior to any assessment. Discuss the psychologist's
recommendations.
Unlock Deck
Unlock for access to all 793 flashcards in this deck.
Unlock Deck
k this deck
19
Which scatterplot shows a strong association between two variables even though the correlation is
Probably near zero?
Probably near zero?
Unlock Deck
Unlock for access to all 793 flashcards in this deck.
Unlock Deck
k this deck
20
The correlation between alue, decrease each Y by 0.20, and
Interchange the variables (put X on the Y-axis and vice versa), the new correlation
A) is 0.50
B) is 0.35
C) is 0.90
D) cannot be determined.
E) is 0.70
alue, decrease each Y by 0.20, andInterchange the variables (put X on the Y-axis and vice versa), the new correlation
A) is 0.50
B) is 0.35
C) is 0.90
D) cannot be determined.
E) is 0.70
Unlock Deck
Unlock for access to all 793 flashcards in this deck.
Unlock Deck
k this deck
21
A medical researcher finds that the more overweight a person is, the higher his pulse rate tends to
Be) In fact, the model suggests that 12-pound differences in weight are associated with differences
In pulse rate of 4 beats per minute. Which is true?
I) The correlation between pulse rate and weight is 0.33
II) If you lose 6 pounds, your pulse rate will slow down 2 beats per minute.
III) A positive residual means a person's pulse rate is higher than the model predicts.
A) I only
B) II and III only
C) none
D) III only
E) II only
Unlock Deck
Unlock for access to all 793 flashcards in this deck.
Unlock Deck
k this deck
22
Associations For each pair of variables, indicate what association you expect: positive(+),
negative(-), curved(C), or none(N).
a. power level setting of a microwave; number of minutes it takes to boil water
b. number of days it rained in a month (during the summer); number of times you mowed
your lawn that month
c. number of hours a person has been up past a normal bedtime; number of minutes it
takes the person to do a crossword puzzle
d. number of hockey games played in Minnesota during a week; sales of suntan lotion in
Minnesota during that week
e. length of a student's hair; number of credits the student earned last year
Unlock Deck
Unlock for access to all 793 flashcards in this deck.
Unlock Deck
k this deck
23
A regression model examining the amount of weight a football player can bench press found that
10 cm differences in chest size are associated with 8 kg differences in weight pressed. Which is
True?
I) The correlation between chest size and weight pressed is
II) As a player gets stronger and presses more weight his chest will get bigger.
III) A positive residual means that the player pressed more than predicted.
A) I and III
B) none
C) I and II
D) III only
E) I only
10 cm differences in chest size are associated with 8 kg differences in weight pressed. Which is
True?
I) The correlation between chest size and weight pressed is
II) As a player gets stronger and presses more weight his chest will get bigger.
III) A positive residual means that the player pressed more than predicted.
A) I and III
B) none
C) I and II
D) III only
E) I only
Unlock Deck
Unlock for access to all 793 flashcards in this deck.
Unlock Deck
k this deck
24
Suppose we collect data hoping to be able to estimate the prices of commonly owned new cars (in
$) from their lengths (in feet). Of these possibilities, the slope of the line of best fit is most likely to
Be
A) 3
B) 30
C) 30,000
D) 300
E) 3000
$) from their lengths (in feet). Of these possibilities, the slope of the line of best fit is most likely to
Be
A) 3
B) 30
C) 30,000
D) 300
E) 3000
Unlock Deck
Unlock for access to all 793 flashcards in this deck.
Unlock Deck
k this deck
25
For families who live in apartments the correlation between the family's income and the amount of
Rent they pay is r = 0.60. Which is true?
I) In general, families with higher incomes pay more in rent.
II) On average, families spend 60% of their income on rent.
III) The regression line passes through 60% of the (income$, rent$) data points.
A) I and III only
B) I, II, and III
C) II only
D) I only
E) I and II only
Unlock Deck
Unlock for access to all 793 flashcards in this deck.
Unlock Deck
k this deck
26
Assembly line Your new job at Panasony is to do the final assembly of camcorders. As you
learn how, you get faster. The company tells you that you will qualify for a raise if after 13
weeks your assembly time averages under 20 minutes. The data shows your average
assembly time during each of your first 10 weeks.
a. Which is the explanatory variable?
b. What is the correlation between these variables?
c. You want to predict whether or not you will qualify for that raise. Would it be
appropriate to use a linear model? Explain.
learn how, you get faster. The company tells you that you will qualify for a raise if after 13
weeks your assembly time averages under 20 minutes. The data shows your average
assembly time during each of your first 10 weeks.
a. Which is the explanatory variable?
b. What is the correlation between these variables?
c. You want to predict whether or not you will qualify for that raise. Would it be
appropriate to use a linear model? Explain.
Unlock Deck
Unlock for access to all 793 flashcards in this deck.
Unlock Deck
k this deck
27
Education research consistently shows that students from wealthier families tend to have higher
SAT scores. The slope of the line that predicts SAT score from family income is 6.25 points per $1000,
And the correlation between the variables is 0.48. Then the slope of the line that predicts family
Income from SAT score (in $1000 per point) …
A) is 3.00
B) is 6.25
C) is 13.02
D) is 0.037
E) is 0.16
Unlock Deck
Unlock for access to all 793 flashcards in this deck.
Unlock Deck
k this deck
28
A lakeside restaurant found the correlation between the daily temperature and the number of
Meals they served to be 0.40. On a day when the temperature is two standard deviations above the
Mean, the number of meals they should plan on serving is _?_ the mean.
A) 0.8 SD above
B) equal to
C) 0.4 SD above
D) 2.0 SD above
E) 0.16 SD above
Meals they served to be 0.40. On a day when the temperature is two standard deviations above the
Mean, the number of meals they should plan on serving is _?_ the mean.
A) 0.8 SD above
B) equal to
C) 0.4 SD above
D) 2.0 SD above
E) 0.16 SD above
Unlock Deck
Unlock for access to all 793 flashcards in this deck.
Unlock Deck
k this deck
29
The residuals plot for a linear model is shown. Which is true?
A) The linear model is okay because the association between the two variables is fairly strong.
B) The linear model is okay because approximately the same number of points are above the line as below it.
C) The linear model is no good since some residuals are large.
D) The linear model is no good because of the curve in the residuals.
E) The linear model is no good since the correlation is near 0.
Unlock Deck
Unlock for access to all 793 flashcards in this deck.
Unlock Deck
k this deck
30
It takes a while for new factory workers to master a complex assembly process. During the first
Month new employees work, the company tracks the number of days they have been on the job and
The length of time it takes them to complete an assembly. The correlation is most likely to be
Month new employees work, the company tracks the number of days they have been on the job and
The length of time it takes them to complete an assembly. The correlation is most likely to be
Unlock Deck
Unlock for access to all 793 flashcards in this deck.
Unlock Deck
k this deck
31
A) I only
B) none of these
C) I and II
D) III only
E) II only
Unlock Deck
Unlock for access to all 793 flashcards in this deck.
Unlock Deck
k this deck
32
Variables X and Y have r = 0.40. If we decrease each X value by 0.1, double each Y value, and then
Interchange them (put X on the Y-axis and vice versa) the new correlation will be
A) -0.40
B) 0.80
C) 0.60
D) 0.40
E) 0.15
Interchange them (put X on the Y-axis and vice versa) the new correlation will be
A) -0.40
B) 0.80
C) 0.60
D) 0.40
E) 0.15
Unlock Deck
Unlock for access to all 793 flashcards in this deck.
Unlock Deck
k this deck
33
Gas mileage again In the Data Desk lab last week you analyzed the association between a
car's fuel economy and its weight. Another important factor in the amount of gasoline a car
uses is the size of the engine. Called "displacement", engine size measures the volume of
the cylinders in cubic inches. The regression analysis is shown.
a. How many cars were included in this analysis?
b. What is the correlation between engine size and fuel economy?
c. A car you are thinking of buying is available with two different size engines, 190 cubic
inches or 240 cubic inches. How much difference might this make in your gas mileage?
(Show work)
car's fuel economy and its weight. Another important factor in the amount of gasoline a car
uses is the size of the engine. Called "displacement", engine size measures the volume of
the cylinders in cubic inches. The regression analysis is shown.
a. How many cars were included in this analysis?
b. What is the correlation between engine size and fuel economy?
c. A car you are thinking of buying is available with two different size engines, 190 cubic
inches or 240 cubic inches. How much difference might this make in your gas mileage?
(Show work)
Unlock Deck
Unlock for access to all 793 flashcards in this deck.
Unlock Deck
k this deck
34
The correlation between a family's weekly income and the amount they spend on restaurant meals
Is found to be r = 0.30. Which must be true?
I) Families tend to spend about 30% of their incomes in restaurants.
II) In general, the higher the income, the more the family spends in restaurants.
III) The line of best fit passes through 30% of the (income, restaurant$) data points.
A) III only
B) I only
C) II and III only
D) I, II, and III
E) II only
Unlock Deck
Unlock for access to all 793 flashcards in this deck.
Unlock Deck
k this deck
35
Music and grades (True Story) A couple of years ago, a local newspaper published
research results claiming a positive association between the number of years high school
children had taken instrumental music lessons and their performances in school (GPA).
a. What does "positive association" mean in this context?
b. A group of parents then went to the School Board demanding more funding for music
programs as a way to improve student chances for academic success in high school. As a
statistician, do you agree or disagree with their reasoning? Explain briefly.
Unlock Deck
Unlock for access to all 793 flashcards in this deck.
Unlock Deck
k this deck
36
Medical records indicate that people with more education tend to live longer; the correlation is 0.48.
The slope of the linear model that predicts lifespan from years of education suggests that on average
People tend to live 0.8 extra years for each additional year of education they have. The slope of the
Line that would predict years of education from lifespan is
A) 0.384
B) 1.25
C) 0.288
D) 0.8
E) 1.67
Unlock Deck
Unlock for access to all 793 flashcards in this deck.
Unlock Deck
k this deck
37
A regression analysis of company profits and the amount of money the company spent on
Advertising found r2 = 0.72 . Which of these is true?
I) This model can correctly predict the profit for 72% of companies.
II) On average, about 72% of a company's profit results from advertising.
III) On average, companies spend about 72% of their profits on advertising.
A) II only
B) I and III
C) none of these
D) III only
E) I only
Unlock Deck
Unlock for access to all 793 flashcards in this deck.
Unlock Deck
k this deck
38
A least squares line of regression has been fitted to a scatterplot; the model's residuals plot is
Shown.
Which is true?
A) The linear model is poor because some residuals are large.
B) A curved model would be better.
C) The linear model is appropriate.
D) The linear model is poor because the correlation is near 0.
E) none of these
Shown.
Which is true?
A) The linear model is poor because some residuals are large.
B) A curved model would be better.
C) The linear model is appropriate.
D) The linear model is poor because the correlation is near 0.
E) none of these
Unlock Deck
Unlock for access to all 793 flashcards in this deck.
Unlock Deck
k this deck
39
Earning power A college's job placement office collected data about students' GPAs and
the salaries they earned in their first jobs after graduation. The mean GPA was 2.9 with a
standard deviation of 0.4. Starting salaries had a mean of $47,200 with a SD of $8500. The
correlation between the two variables was r = 0.72. The association appeared to be linear in
the scatterplot. (Show work)
a. Write an equation of the model that can predict salary based on GPA.
b. Do you think these predictions will be reliable? Explain.
c. Your brother just graduated from that college with a GPA of 3.30. He tells you that based
on this model the residual for his pay is -$1880. What salary is he earning?
Unlock Deck
Unlock for access to all 793 flashcards in this deck.
Unlock Deck
k this deck
40
a. Draw the line of best fit on the graph. (Show your method clearly.)
b. Describe the association in context.
c. Explain (in context) what the slope of the line means.
d. Explain (in context) what the y-intercept of the line means.
e. Explain (in context) what
means.
f. In this context, what does a negative residual indicate?
Unlock Deck
Unlock for access to all 793 flashcards in this deck.
Unlock Deck
k this deck
41
Taxi tires A taxi company monitoring the safety of its cabs kept track of the number of
miles tires had been driven (in thousands) and the depth of the tread remaining (in mm).
Their data are displayed in the scatterplot. They found the equation of the least squares
miles tires had been driven (in thousands) and the depth of the tread remaining (in mm).
Their data are displayed in the scatterplot. They found the equation of the least squares
Unlock Deck
Unlock for access to all 793 flashcards in this deck.
Unlock Deck
k this deck
42
Computer output in the scenario described in problem #8 reports that . Which is the correct
Interpretation of this value?
A) The slope of the regression line is $2.30 per light.
B) The slope of the regression line is 2.3 lights per dollar.
C) The initial cost, even with no lights is $2.30
D) The average prediction error of the regression line is $2.30.
E) The correlation is 2.3.
. Which is the correctInterpretation of this value?
A) The slope of the regression line is $2.30 per light.
B) The slope of the regression line is 2.3 lights per dollar.
C) The initial cost, even with no lights is $2.30
D) The average prediction error of the regression line is $2.30.
E) The correlation is 2.3.
Unlock Deck
Unlock for access to all 793 flashcards in this deck.
Unlock Deck
k this deck
43
Unlock Deck
Unlock for access to all 793 flashcards in this deck.
Unlock Deck
k this deck
44
Put to Work Some students have to work part time jobs to pay for college expenses. A
researcher examined the academic performance of students with jobs versus those without.
He found a positive association between the number of hours worked and GPA. Explain
what "positive association" means in this context.
researcher examined the academic performance of students with jobs versus those without.
He found a positive association between the number of hours worked and GPA. Explain
what "positive association" means in this context.
Unlock Deck
Unlock for access to all 793 flashcards in this deck.
Unlock Deck
k this deck
45
Time Wasted A group of students decide to see if there is link between wasting time on the
internet and GPA. They don't expect to find an extremely strong association, but they're
hoping for at least a weak relationship. Here are the findings.
a. How strong is the relationship the students found? Describe in context with statistical
justification.
One student is concerned that the relationship is so weak, there may not actually be any
relationship at all. To test this concern, he runs a simulation where the 10 GPA's are
randomly matched with the 10 hours/week. After each random assignment, the correlation
is calculated. This process is repeated 100 times. Here is a histogram of the 100 correlations.
The correlation coefficient of -0.371 is indicated with a vertical line.
b. Do the results of this simulation confirm the suspicion that there may not be any
relationship? Refer specifically to the graph in your explanation.
internet and GPA. They don't expect to find an extremely strong association, but they're
hoping for at least a weak relationship. Here are the findings.
a. How strong is the relationship the students found? Describe in context with statistical
justification.
One student is concerned that the relationship is so weak, there may not actually be any
relationship at all. To test this concern, he runs a simulation where the 10 GPA's are
randomly matched with the 10 hours/week. After each random assignment, the correlation
is calculated. This process is repeated 100 times. Here is a histogram of the 100 correlations.
The correlation coefficient of -0.371 is indicated with a vertical line.
b. Do the results of this simulation confirm the suspicion that there may not be any
relationship? Refer specifically to the graph in your explanation.
Unlock Deck
Unlock for access to all 793 flashcards in this deck.
Unlock Deck
k this deck
46
A) none of these
B) I
C) II
D) III
E) II and III only
Unlock Deck
Unlock for access to all 793 flashcards in this deck.
Unlock Deck
k this deck
47
This regression analysis examines the relationship between the number of years of formal
Education a person has and their annual income. According to this model, about how much more
Money do people who finish a 4-year college program earn each year, on average, than those with
Only a 2-year degree?
A) $7968
B) $5337
C) $9321
D) $2006
E) $2710
Education a person has and their annual income. According to this model, about how much more
Money do people who finish a 4-year college program earn each year, on average, than those with
Only a 2-year degree?
A) $7968
B) $5337
C) $9321
D) $2006
E) $2710
Unlock Deck
Unlock for access to all 793 flashcards in this deck.
Unlock Deck
k this deck
48
A regression model examining the amount of distance a long distance runner runs (in miles) to
Predict the amount of fluid the runner drinks (ounces) has a slope of 4.6. Which interpretation is
Appropriate?
A) We predict 4.6 miles for every ounce that is drunk.
B) The correlation is needed to interpret this value.
C) We predict for every mile run, the runner drinks 4.6 more ounces.
D) Each mile adds 4.6 more ounces.
E) A runner drinks a minimum of 4.6 oz.
Unlock Deck
Unlock for access to all 793 flashcards in this deck.
Unlock Deck
k this deck
49
High Score The longer you play a video game, the higher score you can usually achieve.
An analysis of a popular game found the following relationship between the hours a
player has played a game and their corresponding high score on that game.
a. Write the regression equation and define the variables of your equation in context.
b. Interpret the slope in context.
c. Interpret the y-intercept in context.
d. Interpret s in context.
e. What is the correlation coefficient? Interpret this value in context.
An analysis of a popular game found the following relationship between the hours a
player has played a game and their corresponding high score on that game.
a. Write the regression equation and define the variables of your equation in context.
b. Interpret the slope in context.
c. Interpret the y-intercept in context.
d. Interpret s in context.
e. What is the correlation coefficient? Interpret this value in context.
Unlock Deck
Unlock for access to all 793 flashcards in this deck.
Unlock Deck
k this deck
50
researcher studied the relationship between family income and amount of money spent on an
Automobile. She calculated that
Which is the correct interpretaion?
A) 45% of the variability in car price can be explained by using income.
B) None of these
C) The probability of predicting the correct price of a car is 45%.
D) 45% of the price of the car can be predicted by using income.
E) The car price fluctuates 45% more than income.
Automobile. She calculated that
Which is the correct interpretaion?
A) 45% of the variability in car price can be explained by using income.
B) None of these
C) The probability of predicting the correct price of a car is 45%.
D) 45% of the price of the car can be predicted by using income.
E) The car price fluctuates 45% more than income.
Unlock Deck
Unlock for access to all 793 flashcards in this deck.
Unlock Deck
k this deck
51
If a data set has a relationship that is best described by a linear model, than the residual plot will
A) none of these
B) also have a linear pattern with a similar correlation.
C) have no pattern with a correlation near 0.
D) be an unknown shape.
E) have a curved pattern, like a parabola.
A) none of these
B) also have a linear pattern with a similar correlation.
C) have no pattern with a correlation near 0.
D) be an unknown shape.
E) have a curved pattern, like a parabola.
Unlock Deck
Unlock for access to all 793 flashcards in this deck.
Unlock Deck
k this deck
52
A) 6
B) 0.06
C) 0.60
D) 0.006
E) none of these
Unlock Deck
Unlock for access to all 793 flashcards in this deck.
Unlock Deck
k this deck
53
Associations For each pair of variables, indicate what association you expect: positive
linear(+), negative linear(-), curved(C), or none(N).
a. the number of hours in the sun; the number of mold cultures on a piece of bread
b. the number of hours a store is open; the number of sales the store has
c. the number of hours you practice golf; your golf score
d. the price of gasoline; the number of families that take summer road trips
e. the size of a front lawn; the number of children who live in the house
Unlock Deck
Unlock for access to all 793 flashcards in this deck.
Unlock Deck
k this deck
54
A silly psychology student gathers data on the shoe size of 30 of his classmates and their GPA's.
The correlation coefficient between these two variables is most likely to be
The correlation coefficient between these two variables is most likely to be
Unlock Deck
Unlock for access to all 793 flashcards in this deck.
Unlock Deck
k this deck
55
Email At CPU every student gets a college email address. Data collected by the college
showed a negative association between student grades and the number of emails the
student sent during the semester.
a. Briefly explain what "negative association" means in this context.
b. After seeing this study the college proposes trying to improve academic performance by
limiting the amount of email students can send through the college address. As a
statistician, what do you think of this plan? Explain briefly.
Unlock Deck
Unlock for access to all 793 flashcards in this deck.
Unlock Deck
k this deck
56
The relationship between the longevity of an animal's life and its gestation time is 0.70. If an animal
Is one standard deviation below average in life expectancy, the gestation time is predicted to be
__?__ below average.
A) 0.49 SD
B) none of these
C) 1.4 SD
D) 0.7 SD
E) 1 SD
Is one standard deviation below average in life expectancy, the gestation time is predicted to be
__?__ below average.
A) 0.49 SD
B) none of these
C) 1.4 SD
D) 0.7 SD
E) 1 SD
Unlock Deck
Unlock for access to all 793 flashcards in this deck.
Unlock Deck
k this deck
57
Car commercials A car dealer investigated the association between the number of TV
commercials he ran each week and the number of cars he sold the following weekend. He
found the correlation to be r = 0.56. During the time he collected the data he ran an average
of 12.4 commercials a week with a standard deviation of 1.8, and sold an average of 30.5
cars with a standard deviation of 4.2. Next weekend he is planning a sale, hoping to sell 40
cars. Create a linear model to estimate the number of commercials he should run this week.
Write a sentence explaining your recommendation.
Unlock Deck
Unlock for access to all 793 flashcards in this deck.
Unlock Deck
k this deck
58
Associations For each pair of variables, indicate what association you expect: positive
linear(+), negative linear(-), curved(C), or none(N).
a. the number of miles a student lives from school; the student's GPA
b. a person's blood alcohol level; time it takes the person to solve a maze
c. weekly sales of hot chocolate at a Montana diner; the number of auto accidents that week
in that town
d. the price charged for fund-raising candy bars; number of candy bars sold
e. the amount of rainfall during growing season; the crop yield (bushels per acre)
Unlock Deck
Unlock for access to all 793 flashcards in this deck.
Unlock Deck
k this deck
59
Make a scatterplot and describe the association between the size of the diamond (carat) and
the cost (in US dollars).
the cost (in US dollars).
Unlock Deck
Unlock for access to all 793 flashcards in this deck.
Unlock Deck
k this deck
60
Using the equation in number #8 again, if a homeowner doubles the number of lights he uses from
500 to 1000, how much do we predict he will increase his electric bill by?
A) $12.50
B) $35
C) $10
D) $22.50
E) $2
500 to 1000, how much do we predict he will increase his electric bill by?
A) $12.50
B) $35
C) $10
D) $22.50
E) $2
Unlock Deck
Unlock for access to all 793 flashcards in this deck.
Unlock Deck
k this deck
61
Does the value of s concern you? How might you deal with this data differently to address
this problem?
this problem?
Unlock Deck
Unlock for access to all 793 flashcards in this deck.
Unlock Deck
k this deck
62
Interpret the intercept of your model in context.
Unlock Deck
Unlock for access to all 793 flashcards in this deck.
Unlock Deck
k this deck
63
Do you think a linear model is appropriate here? Explain.
Unlock Deck
Unlock for access to all 793 flashcards in this deck.
Unlock Deck
k this deck
64
Would it be better for a customer buying a diamond to have a negative residual or a
positive residual from this model? Explain.
positive residual from this model? Explain.
Unlock Deck
Unlock for access to all 793 flashcards in this deck.
Unlock Deck
k this deck
65
Create a model to predict diamond costs from the size of the diamond.
Unlock Deck
Unlock for access to all 793 flashcards in this deck.
Unlock Deck
k this deck
66
Explain the meaning of
in the context of this problem.
in the context of this problem.
Unlock Deck
Unlock for access to all 793 flashcards in this deck.
Unlock Deck
k this deck
67
Write the regression equation. Define all variables used in your equation.
Unlock Deck
Unlock for access to all 793 flashcards in this deck.
Unlock Deck
k this deck
68
Interpret the slope of your model in context.
Unlock Deck
Unlock for access to all 793 flashcards in this deck.
Unlock Deck
k this deck
69
Explain the meaning of
in the context of this problem.
in the context of this problem.
Unlock Deck
Unlock for access to all 793 flashcards in this deck.
Unlock Deck
k this deck
70
Would it be better for customers for a year to have a negative residual or a positive
residual from this model? Explain.
residual from this model? Explain.
Unlock Deck
Unlock for access to all 793 flashcards in this deck.
Unlock Deck
k this deck
71
Interpret the slope of your model in context.
Unlock Deck
Unlock for access to all 793 flashcards in this deck.
Unlock Deck
k this deck
72
What is the correlation between year and postal rate?
Unlock Deck
Unlock for access to all 793 flashcards in this deck.
Unlock Deck
k this deck
73
What is the correlation between cost and size?
Unlock Deck
Unlock for access to all 793 flashcards in this deck.
Unlock Deck
k this deck
74
Interpret the slope in context.
Unlock Deck
Unlock for access to all 793 flashcards in this deck.
Unlock Deck
k this deck
75
Do you think a linear model is appropriate here? Explain.
Unlock Deck
Unlock for access to all 793 flashcards in this deck.
Unlock Deck
k this deck
76
Interpret the intercept of your model in context.
Unlock Deck
Unlock for access to all 793 flashcards in this deck.
Unlock Deck
k this deck
77
Interpret s in context.
Unlock Deck
Unlock for access to all 793 flashcards in this deck.
Unlock Deck
k this deck
78
Since r2 is not 100%, there must be other factors in influencing the number of oranges
harvested. What percentage is that and what is another factor you think might be
involved?
harvested. What percentage is that and what is another factor you think might be
involved?
Unlock Deck
Unlock for access to all 793 flashcards in this deck.
Unlock Deck
k this deck
79
Create a model to predict postal rates from the year.
Unlock Deck
Unlock for access to all 793 flashcards in this deck.
Unlock Deck
k this deck
Unlock Deck
Unlock for access to all 793 flashcards in this deck.


