Deck 2: Displaying and Describing Data
Full screen (f)
Question
The following table shows representative recent closing share prices for a small sample of companies based in India in January 2019.  The standard deviation in closing share prices is
A)$163.5.
B)$25.8.
C)$136.6.
D)$62.7.
E)$267.6.
The standard deviation in closing share prices isA)$163.5.
B)$25.8.
C)$136.6.
D)$62.7.
E)$267.6.
Question
The following table shows representative recent closing share prices for a small sample of companies based in India in January 2019. 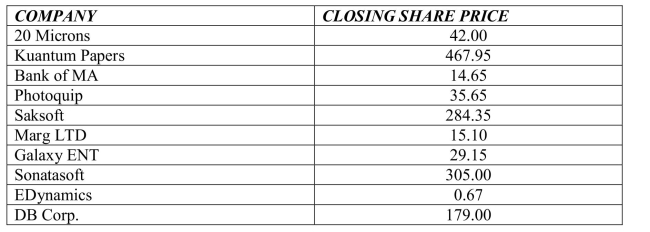 The mean closing share prices is
A)$12.78
B)$ 137.35
C)$ 38.83
D)$ 284.35
E)$ 163.50
The mean closing share prices isA)$12.78
B)$ 137.35
C)$ 38.83
D)$ 284.35
E)$ 163.50
Question
The following table shows total assets ($ billion) for a small sample of U.S.banks in the 4th quarter of 2018. 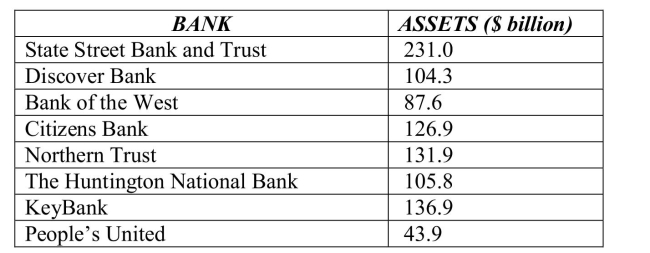 The standard deviation for these data is
A)$ 53.55 billion.
B)$ 100.35 billion.
C)$ 75.68 billion.
D)$ 84.21 billion.
E)$ 89.79 billion.
The standard deviation for these data isA)$ 53.55 billion.
B)$ 100.35 billion.
C)$ 75.68 billion.
D)$ 84.21 billion.
E)$ 89.79 billion.
Question
Below is a histogram of salaries (in $) for a sample of U.S.marketing managers.  The most appropriate measure of central tendency for these data is the
A)median.
B)mean.
C)mode.
D)range.
E)standard deviation.
The most appropriate measure of central tendency for these data is theA)median.
B)mean.
C)mode.
D)range.
E)standard deviation.
Question
A automobile marketing firm conducts a study to see what types of cars people owned before buying an American car.The results are shown below. 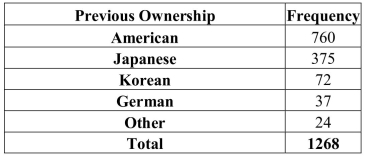 The relative frequency of those who owned Japanese cars previously who now bought
American cars is
A)59.9 %
B)29.6%
C)5.7%
D)14.9%
E)2.9%
The relative frequency of those who owned Japanese cars previously who now boughtAmerican cars is
A)59.9 %
B)29.6%
C)5.7%
D)14.9%
E)2.9%
Question
Below is a histogram of salaries (in $) for a sample of U.S.marketing managers. 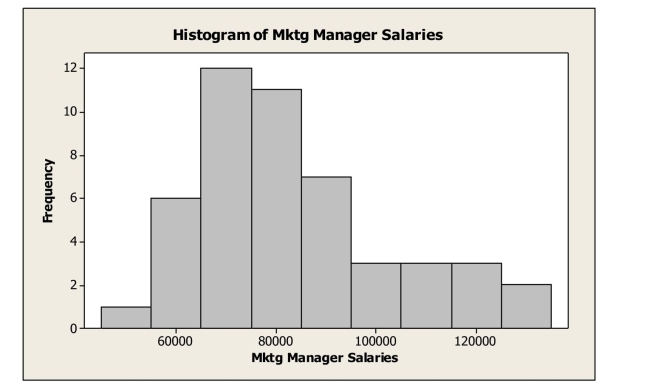 The shape of this distribution is
A)symmetric.
B)bimodal.
C)right skewed.
D)left skewed.
E)normal.
The shape of this distribution isA)symmetric.
B)bimodal.
C)right skewed.
D)left skewed.
E)normal.
Question
A restaurant uses comment cards to get feedback from its customers about newly added items to the menu.It recently introduced homemade organic veggie burgers.Customers who tried
The new burger were asked if they would order it again.The data are summarized in the table
Below.What percentage of customers would most likely or definitely order the veggie burger
Again?
A)10%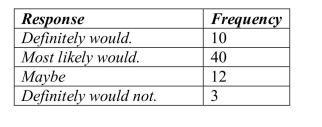
B)15%
C)40%
D)50%
E)77%
The new burger were asked if they would order it again.The data are summarized in the table
Below.What percentage of customers would most likely or definitely order the veggie burger
Again?
A)10%
B)15%
C)40%
D)50%
E)77%
Question
Consider the five number summary of hourly wages ($) for a sample of sales managers. 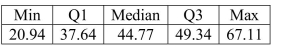 The IQR for these data is
A)$11.70
B)$46.17
C)$67.11
D)$20.94
The IQR for these data isA)$11.70
B)$46.17
C)$67.11
D)$20.94
Question
Consider the five number summary of hourly wages ($) for a sample of sales managers. 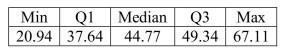 The range for these data is
A)$11.70
B)$46.17
C)$67.11
D)$20.94
E)$44.77
The range for these data isA)$11.70
B)$46.17
C)$67.11
D)$20.94
E)$44.77
Question
Consider the five number summary of hourly wages ($) for a sample of sales managers. Suppose the mean hourly wage is $38.50.What can we say about the shape of the
Distribution?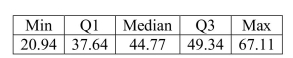
A)The distribution of hourly wages for sales managers is symmetric.
B)The distribution of hourly wages for sales managers is skewed right.
C)The distribution of hourly wages for sales managers is skewed left.
D)The distribution of hourly wages for sales managers is bimodal.
E)None of the above.
Question
A clothing store uses comment cards to get feedback from its customers about newly added items.It recently introduced plus size fashion wear.Customers who purchased the items
Were asked to fill out an online comment survey giving 10% off the next purchase.The data
Are summarized in the table below.What percentage of customers were less than fully
Satisfied?
A)26.2%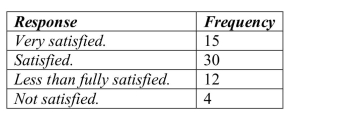
B)6.5%
C)75.4%
D)49.2%
E)19.6%
Were asked to fill out an online comment survey giving 10% off the next purchase.The data
Are summarized in the table below.What percentage of customers were less than fully
Satisfied?
A)26.2%
B)6.5%
C)75.4%
D)49.2%
E)19.6%
Question
The following table shows data for total assets ($ billion) for a small sample of U.S.banks (4th quarter 2018). 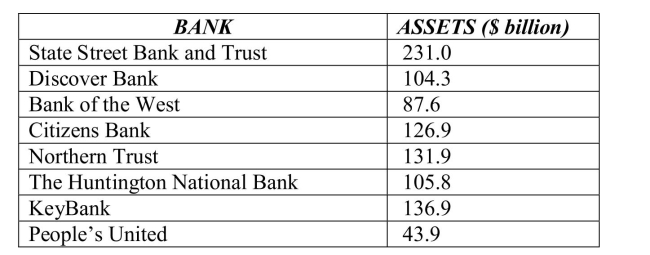 The mean for the total assets data ($ billion) is
A)$98.7.
B)$76.3.
C)$135.6.
D)$121.0.
E)$62.4.
The mean for the total assets data ($ billion) isA)$98.7.
B)$76.3.
C)$135.6.
D)$121.0.
E)$62.4.
Question
A restaurant uses comment cards to get feedback from its customers about newly added items to the menu.It recently introduced homemade organic veggie burgers.Customers who tried
The new burger were asked if they would order it again.The data are summarized in the table
Below.What percentage of customers would definitely order the veggie burger again?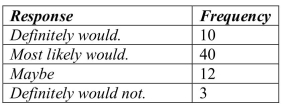
A)10%
B)15%
C)20%
D)40%
E)77%
The new burger were asked if they would order it again.The data are summarized in the table
Below.What percentage of customers would definitely order the veggie burger again?
A)10%
B)15%
C)20%
D)40%
E)77%
Question
A clothing store uses comment cards to get feedback from its customers about newly added items.It recently introduced plus size fashion wear.Customers who purchased the items
Were asked to fill out an online comment survey giving 10% off the next purchase.The data
Are summarized in the table below.What percentage of customers were at least satisfied with
The item(s) purchased (Satisfied or Very satisfied)?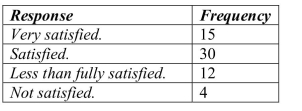
A)49.2%
B)73.8%
C)24.6%
D)26.2%
E)68.9%
Were asked to fill out an online comment survey giving 10% off the next purchase.The data
Are summarized in the table below.What percentage of customers were at least satisfied with
The item(s) purchased (Satisfied or Very satisfied)?
A)49.2%
B)73.8%
C)24.6%
D)26.2%
E)68.9%
Question
Consider the five number summary of hourly wages ($) for a sample of advertising / promotion managers. 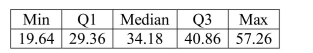 Suppose there had been an error and that the lowest hourly wage was $15.50 instead of
$19)64.This would result in
A)an increase in the median.
B)an increase in the standard deviation.
C)a decrease in the range.
D)a decrease in the IQR.
E)an increase in the mean.
Suppose there had been an error and that the lowest hourly wage was $15.50 instead of$19)64.This would result in
A)an increase in the median.
B)an increase in the standard deviation.
C)a decrease in the range.
D)a decrease in the IQR.
E)an increase in the mean.
Question
Here is the five number summary for salaries of U.S.marketing managers. The IQR is 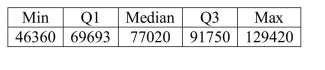
A)$83,060.
B)$22.057.
C)$69,693.
D)$77.020.
E)$14,566.
A)$83,060.
B)$22.057.
C)$69,693.
D)$77.020.
E)$14,566.

Unlock Deck
Sign up to unlock the cards in this deck!
Unlock Deck
Unlock Deck
1/16
Play
Full screen (f)
Deck 2: Displaying and Describing Data
1
The following table shows representative recent closing share prices for a small sample of companies based in India in January 2019. The standard deviation in closing share prices is
A)$163.5.
B)$25.8.
C)$136.6.
D)$62.7.
E)$267.6.
The standard deviation in closing share prices isA)$163.5.
B)$25.8.
C)$136.6.
D)$62.7.
E)$267.6.
A
2
The following table shows representative recent closing share prices for a small sample of companies based in India in January 2019. The mean closing share prices is
A)$12.78
B)$ 137.35
C)$ 38.83
D)$ 284.35
E)$ 163.50
The mean closing share prices isA)$12.78
B)$ 137.35
C)$ 38.83
D)$ 284.35
E)$ 163.50
B
3
The following table shows total assets ($ billion) for a small sample of U.S.banks in the 4th quarter of 2018. The standard deviation for these data is
A)$ 53.55 billion.
B)$ 100.35 billion.
C)$ 75.68 billion.
D)$ 84.21 billion.
E)$ 89.79 billion.
The standard deviation for these data isA)$ 53.55 billion.
B)$ 100.35 billion.
C)$ 75.68 billion.
D)$ 84.21 billion.
E)$ 89.79 billion.
A
4
Below is a histogram of salaries (in $) for a sample of U.S.marketing managers. The most appropriate measure of central tendency for these data is the
A)median.
B)mean.
C)mode.
D)range.
E)standard deviation.
The most appropriate measure of central tendency for these data is theA)median.
B)mean.
C)mode.
D)range.
E)standard deviation.
Unlock Deck
Unlock for access to all 16 flashcards in this deck.
Unlock Deck
k this deck
5
A automobile marketing firm conducts a study to see what types of cars people owned before buying an American car.The results are shown below. The relative frequency of those who owned Japanese cars previously who now bought
American cars is
A)59.9 %
B)29.6%
C)5.7%
D)14.9%
E)2.9%
The relative frequency of those who owned Japanese cars previously who now boughtAmerican cars is
A)59.9 %
B)29.6%
C)5.7%
D)14.9%
E)2.9%
Unlock Deck
Unlock for access to all 16 flashcards in this deck.
Unlock Deck
k this deck
6
Below is a histogram of salaries (in $) for a sample of U.S.marketing managers. The shape of this distribution is
A)symmetric.
B)bimodal.
C)right skewed.
D)left skewed.
E)normal.
The shape of this distribution isA)symmetric.
B)bimodal.
C)right skewed.
D)left skewed.
E)normal.
Unlock Deck
Unlock for access to all 16 flashcards in this deck.
Unlock Deck
k this deck
7
A restaurant uses comment cards to get feedback from its customers about newly added items to the menu.It recently introduced homemade organic veggie burgers.Customers who tried
The new burger were asked if they would order it again.The data are summarized in the table
Below.What percentage of customers would most likely or definitely order the veggie burger
Again?
A)10%
B)15%
C)40%
D)50%
E)77%
The new burger were asked if they would order it again.The data are summarized in the table
Below.What percentage of customers would most likely or definitely order the veggie burger
Again?
A)10%
B)15%
C)40%
D)50%
E)77%
Unlock Deck
Unlock for access to all 16 flashcards in this deck.
Unlock Deck
k this deck
8
Consider the five number summary of hourly wages ($) for a sample of sales managers. The IQR for these data is
A)$11.70
B)$46.17
C)$67.11
D)$20.94
The IQR for these data isA)$11.70
B)$46.17
C)$67.11
D)$20.94
Unlock Deck
Unlock for access to all 16 flashcards in this deck.
Unlock Deck
k this deck
9
Consider the five number summary of hourly wages ($) for a sample of sales managers. The range for these data is
A)$11.70
B)$46.17
C)$67.11
D)$20.94
E)$44.77
The range for these data isA)$11.70
B)$46.17
C)$67.11
D)$20.94
E)$44.77
Unlock Deck
Unlock for access to all 16 flashcards in this deck.
Unlock Deck
k this deck
10
Consider the five number summary of hourly wages ($) for a sample of sales managers. Suppose the mean hourly wage is $38.50.What can we say about the shape of the
Distribution?
A)The distribution of hourly wages for sales managers is symmetric.
B)The distribution of hourly wages for sales managers is skewed right.
C)The distribution of hourly wages for sales managers is skewed left.
D)The distribution of hourly wages for sales managers is bimodal.
E)None of the above.
Distribution?
A)The distribution of hourly wages for sales managers is symmetric.
B)The distribution of hourly wages for sales managers is skewed right.
C)The distribution of hourly wages for sales managers is skewed left.
D)The distribution of hourly wages for sales managers is bimodal.
E)None of the above.
Unlock Deck
Unlock for access to all 16 flashcards in this deck.
Unlock Deck
k this deck
11
A clothing store uses comment cards to get feedback from its customers about newly added items.It recently introduced plus size fashion wear.Customers who purchased the items
Were asked to fill out an online comment survey giving 10% off the next purchase.The data
Are summarized in the table below.What percentage of customers were less than fully
Satisfied?
A)26.2%
B)6.5%
C)75.4%
D)49.2%
E)19.6%
Were asked to fill out an online comment survey giving 10% off the next purchase.The data
Are summarized in the table below.What percentage of customers were less than fully
Satisfied?
A)26.2%
B)6.5%
C)75.4%
D)49.2%
E)19.6%
Unlock Deck
Unlock for access to all 16 flashcards in this deck.
Unlock Deck
k this deck
12
The following table shows data for total assets ($ billion) for a small sample of U.S.banks (4th quarter 2018). The mean for the total assets data ($ billion) is
A)$98.7.
B)$76.3.
C)$135.6.
D)$121.0.
E)$62.4.
The mean for the total assets data ($ billion) isA)$98.7.
B)$76.3.
C)$135.6.
D)$121.0.
E)$62.4.
Unlock Deck
Unlock for access to all 16 flashcards in this deck.
Unlock Deck
k this deck
13
A restaurant uses comment cards to get feedback from its customers about newly added items to the menu.It recently introduced homemade organic veggie burgers.Customers who tried
The new burger were asked if they would order it again.The data are summarized in the table
Below.What percentage of customers would definitely order the veggie burger again?
A)10%
B)15%
C)20%
D)40%
E)77%
The new burger were asked if they would order it again.The data are summarized in the table
Below.What percentage of customers would definitely order the veggie burger again?
A)10%
B)15%
C)20%
D)40%
E)77%
Unlock Deck
Unlock for access to all 16 flashcards in this deck.
Unlock Deck
k this deck
14
A clothing store uses comment cards to get feedback from its customers about newly added items.It recently introduced plus size fashion wear.Customers who purchased the items
Were asked to fill out an online comment survey giving 10% off the next purchase.The data
Are summarized in the table below.What percentage of customers were at least satisfied with
The item(s) purchased (Satisfied or Very satisfied)?
A)49.2%
B)73.8%
C)24.6%
D)26.2%
E)68.9%
Were asked to fill out an online comment survey giving 10% off the next purchase.The data
Are summarized in the table below.What percentage of customers were at least satisfied with
The item(s) purchased (Satisfied or Very satisfied)?
A)49.2%
B)73.8%
C)24.6%
D)26.2%
E)68.9%
Unlock Deck
Unlock for access to all 16 flashcards in this deck.
Unlock Deck
k this deck
15
Consider the five number summary of hourly wages ($) for a sample of advertising / promotion managers. Suppose there had been an error and that the lowest hourly wage was $15.50 instead of
$19)64.This would result in
A)an increase in the median.
B)an increase in the standard deviation.
C)a decrease in the range.
D)a decrease in the IQR.
E)an increase in the mean.
Suppose there had been an error and that the lowest hourly wage was $15.50 instead of$19)64.This would result in
A)an increase in the median.
B)an increase in the standard deviation.
C)a decrease in the range.
D)a decrease in the IQR.
E)an increase in the mean.
Unlock Deck
Unlock for access to all 16 flashcards in this deck.
Unlock Deck
k this deck
16
Here is the five number summary for salaries of U.S.marketing managers. The IQR is
A)$83,060.
B)$22.057.
C)$69,693.
D)$77.020.
E)$14,566.
A)$83,060.
B)$22.057.
C)$69,693.
D)$77.020.
E)$14,566.
Unlock Deck
Unlock for access to all 16 flashcards in this deck.
Unlock Deck
k this deck
Unlock Deck
Unlock for access to all 16 flashcards in this deck.


