Deck 4: Understanding and Comparing Distributions
Full screen (f)
Question
The side-by-side boxplots show the cumulative college GPAs for sophomores, juniors, and seniors taking an intro stats course in Autumn 2003. 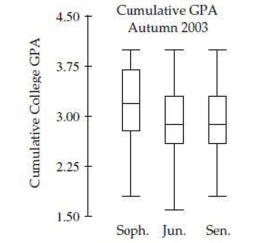 Which class has the most skewed set of GPAs?
A)Sophomore
B)Junior
C)Senior
D)Both Junior and Senior
E)Both Sophomore and Junior
Which class has the most skewed set of GPAs?A)Sophomore
B)Junior
C)Senior
D)Both Junior and Senior
E)Both Sophomore and Junior
Question
The boxplots show prices of used cars (in thousands of dollars) advertised for sale at three different car dealers.Which dealer has the smallest price range, and what is it? 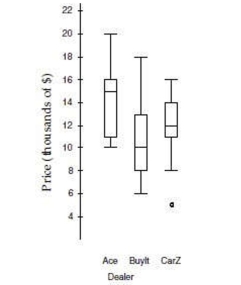
A)CarZ: $8000.
B)CarZ: $11000.
C)Ace: $10000.
D)BuyIt: $5000.
E)Cannot say from boxplots only.
A)CarZ: $8000.
B)CarZ: $11000.
C)Ace: $10000.
D)BuyIt: $5000.
E)Cannot say from boxplots only.
Question
The side-by-side boxplots show the cumulative college GPAs for sophomores, juniors, and seniors taking an intro stats course in Autumn 2003. 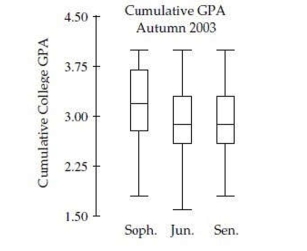 Which class has the largest range for GPA?
A)Sophomore
B)Junior
C)Senior
D)Both Junior and Senior
E)Both Sophomore and Junior
Which class has the largest range for GPA?A)Sophomore
B)Junior
C)Senior
D)Both Junior and Senior
E)Both Sophomore and Junior
Question
The following boxplots show monthly sales revenue figures ($ thousands) for a discount office supply company with locations in three different regions of the U.S.(Northeast,
Southeast, and West).Which of the following statements is false?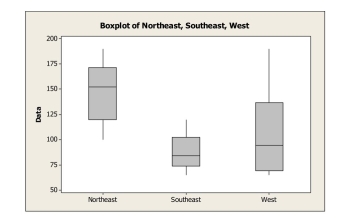
A)The West has the most variable sales revenues.
B)The West has the largest IQR.
C)The Southeast has the smallest IQR.
D)The Northeast has the most variable sales revenues.
E)The Southeast has the least variable sales revenues.
Southeast, and West).Which of the following statements is false?
A)The West has the most variable sales revenues.
B)The West has the largest IQR.
C)The Southeast has the smallest IQR.
D)The Northeast has the most variable sales revenues.
E)The Southeast has the least variable sales revenues.
Question
One thousand students from a local university were sampled to gather information such as gender, high school GPA, college GPA, and total SAT scores.The results were used to create
Histograms displaying high school grade point averages (GPAs) for both males and females.
Compare the grade distribution of males and females.Check all that apply.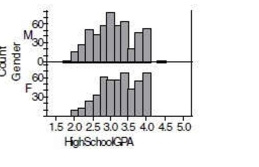
A)Both distributions are skewed to the left.
B)Both distributions appear to be centered at a GPA of about 3.0.
C)The distributions are skewed in different directions.
D)The distributions are differ strongly in center.
E)The distribution of male GPA appears slightly more spread out than the distribution of female GPA
Question
The following boxplots show monthly sales revenue figures ($ thousands) for a discount office supply company with locations in three different regions of the U.S.(Northeast,
Southeast, and West).Which of the following statements is true?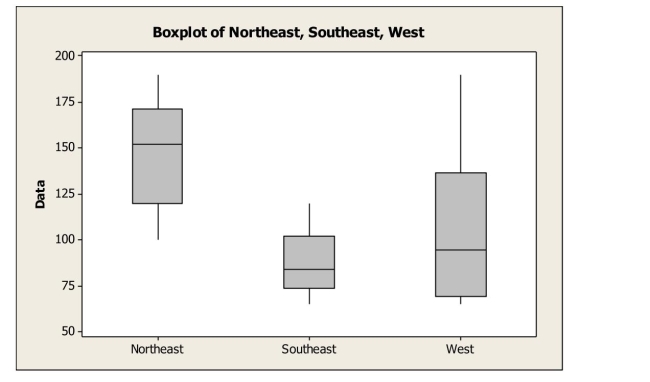
A)The Northeast has the lowest mean sales revenue.
B)The Southeast has the lowest median sales revenue.
C)The West has the lowest mean sales revenue.
D)The West has the lowest median sales revenue.
E)None of the above.
Southeast, and West).Which of the following statements is true?
A)The Northeast has the lowest mean sales revenue.
B)The Southeast has the lowest median sales revenue.
C)The West has the lowest mean sales revenue.
D)The West has the lowest median sales revenue.
E)None of the above.
Question
The boxplots show prices of used cars (in thousands of dollars) advertised for sale at three different car dealers.Which dealer's prices have the smallest IQR, and what is it? 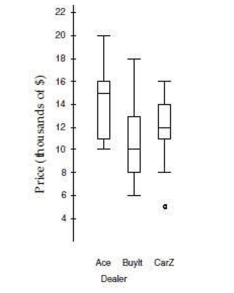
A)CarZ: $3000.
B)CarZ: $8000.
C)Ace: $5000.
D)BuyIt: $5000.
E)Cannot say from boxplots only.
A)CarZ: $3000.
B)CarZ: $8000.
C)Ace: $5000.
D)BuyIt: $5000.
E)Cannot say from boxplots only.
Question
The side-by-side boxplots show the cumulative college GPAs for sophomores, juniors, and seniors taking an intro stats course in Autumn 2003. 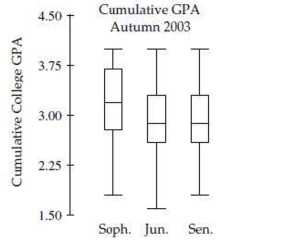 Which class has the highest median GPA?
A)Sophomore
B)Junior
C)Senior
D)Both Junior and Senior
E)Both Sophomore and Junior
Which class has the highest median GPA?A)Sophomore
B)Junior
C)Senior
D)Both Junior and Senior
E)Both Sophomore and Junior
Question
The boxplots show prices of used cars (in thousands of dollars) advertised for sale at three different car dealers.Which dealer offers the cheapest car offered, and at what price? 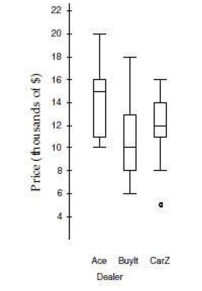
A)Car Z: $5000.
B)BuyIt: $6000.
C)Ace: $10000.
D)BuyIt: $10000.
E)Cannot say from boxplots only.
A)Car Z: $5000.
B)BuyIt: $6000.
C)Ace: $10000.
D)BuyIt: $10000.
E)Cannot say from boxplots only.
Question
The side-by-side boxplots show the cumulative college GPAs for sophomores, juniors, and seniors taking an intro stats course in Autumn 2003. 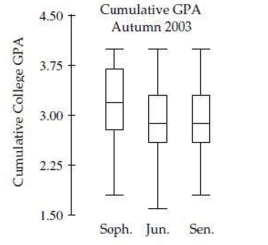 What is approximately the GPA of the class with the highest median GPA?
A)2.6
B)2.8
C)3.2
D)3.6
E)3.8
What is approximately the GPA of the class with the highest median GPA?A)2.6
B)2.8
C)3.2
D)3.6
E)3.8
Question
The boxplots show prices of used cars (in thousands of dollars) advertised for sale at three different car dealers.Which dealer has the lowest median price, and how much is it?
A)Ace: $15000.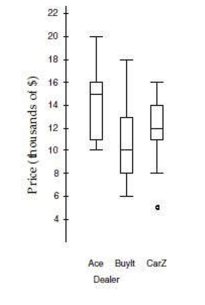
B)BuyIt: $8000.
C)CarZ: $12000.
D)BuyIt: $10000.
A)Ace: $15000.
B)BuyIt: $8000.
C)CarZ: $12000.
D)BuyIt: $10000.
Question
How do sports salaries compare? Two sets of histograms below show the distributions of salaries for Major League Baseball and the National Football League.What set of histograms
Makes it easier to compare the distributions? And for what reasons? Check all that apply.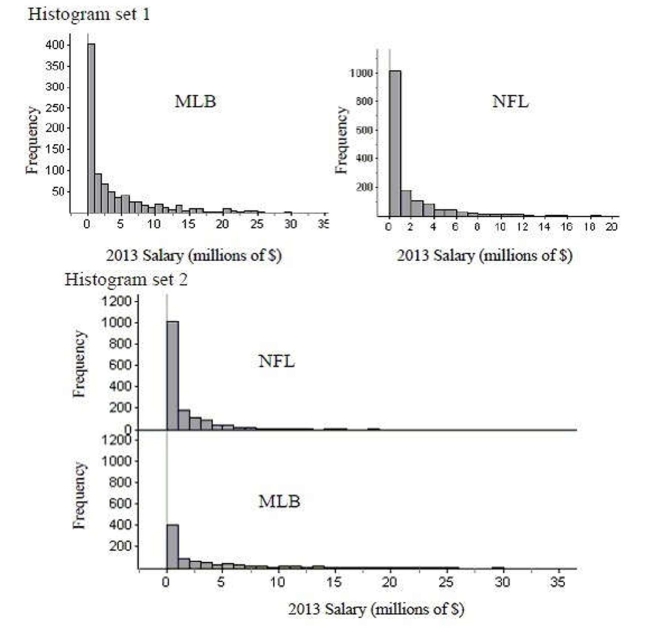
A)Both allow equal comparison.
B)The first set of histograms, because it uses different scales on the axes.
C)The second set of histograms, because it uses the same scales on the axes.
D)The first set of histograms, because it is stacked horizontally.
E)The second set of histograms, because it is stacked vertically.
Question
The side-by-side boxplots show the cumulative college GPAs for sophomores, juniors, and seniors taking an intro stats course in Autumn 2003. 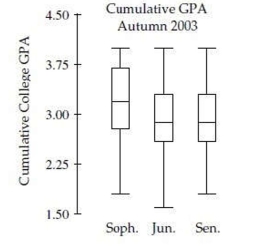 What is the approximate value of the largest range for GPA?
A)0.8
B)1.0
C)1.4
D)2.4
E)3.0
What is the approximate value of the largest range for GPA?A)0.8
B)1.0
C)1.4
D)2.4
E)3.0
Question
At www.census.gov you can create a "population pyramid" for any country.These pyramids are back-to-back histograms.This pyramid shows Mexico's 2000 female population and the
Census bureau's projection for 2050.Check all that apply.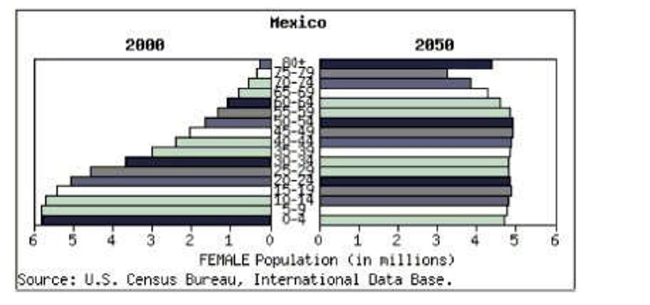
A)The expected mean age in 2050 is higher than the mean age in 2000.
B)The expected median age in 2050 is higher than the median age in 2000.
C)The expected mean age in 2050 is lower than the mean age in 2000.
D)The expected median age in 2050 is lower than the median age in 2000.
E)The IQR of the distribution of projected ages in 2050 is larger than the IQR of the distribution of ages in 2000.
Question
At www.census.gov you can create a "population pyramid" for any country.These pyramids are back-to-back histograms.This pyramid shows Mexico's 2000 female population and the
Census bureau's projection for 2050.Check all that apply.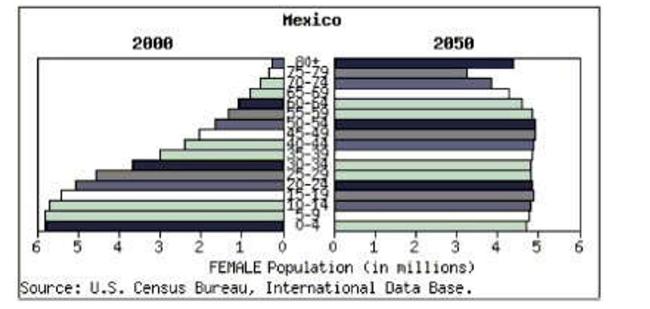
A)The distribution of ages in 2000 is strongly skewed to the left.
B)The distribution of ages in 2000 is strongly skewed to the right.
C)The distribution of projected ages in 2050 is strongly skewed to the left.
D)The distribution of projected ages in 2050 is strongly skewed to the right.
E)The distribution of projected ages in 2050 is approximately uniform.
Question
The side-by-side boxplots show the cumulative college GPAs for sophomores, juniors, and seniors taking an intro stats course in Autumn 2003. 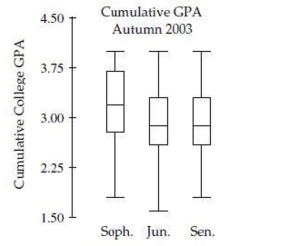 What is the approximate value of that GPA of the lowest scoring student?
A)1.6
B)1.8
C)2.6
D)2.8
E)3.0
What is the approximate value of that GPA of the lowest scoring student?A)1.6
B)1.8
C)2.6
D)2.8
E)3.0

Unlock Deck
Sign up to unlock the cards in this deck!
Unlock Deck
Unlock Deck
1/16
Play
Full screen (f)
Deck 4: Understanding and Comparing Distributions
1
The side-by-side boxplots show the cumulative college GPAs for sophomores, juniors, and seniors taking an intro stats course in Autumn 2003. Which class has the most skewed set of GPAs?
A)Sophomore
B)Junior
C)Senior
D)Both Junior and Senior
E)Both Sophomore and Junior
Which class has the most skewed set of GPAs?A)Sophomore
B)Junior
C)Senior
D)Both Junior and Senior
E)Both Sophomore and Junior
A
2
The boxplots show prices of used cars (in thousands of dollars) advertised for sale at three different car dealers.Which dealer has the smallest price range, and what is it?
A)CarZ: $8000.
B)CarZ: $11000.
C)Ace: $10000.
D)BuyIt: $5000.
E)Cannot say from boxplots only.
A)CarZ: $8000.
B)CarZ: $11000.
C)Ace: $10000.
D)BuyIt: $5000.
E)Cannot say from boxplots only.
C
3
The side-by-side boxplots show the cumulative college GPAs for sophomores, juniors, and seniors taking an intro stats course in Autumn 2003. Which class has the largest range for GPA?
A)Sophomore
B)Junior
C)Senior
D)Both Junior and Senior
E)Both Sophomore and Junior
Which class has the largest range for GPA?A)Sophomore
B)Junior
C)Senior
D)Both Junior and Senior
E)Both Sophomore and Junior
B
4
The following boxplots show monthly sales revenue figures ($ thousands) for a discount office supply company with locations in three different regions of the U.S.(Northeast,
Southeast, and West).Which of the following statements is false?
A)The West has the most variable sales revenues.
B)The West has the largest IQR.
C)The Southeast has the smallest IQR.
D)The Northeast has the most variable sales revenues.
E)The Southeast has the least variable sales revenues.
Southeast, and West).Which of the following statements is false?
A)The West has the most variable sales revenues.
B)The West has the largest IQR.
C)The Southeast has the smallest IQR.
D)The Northeast has the most variable sales revenues.
E)The Southeast has the least variable sales revenues.
Unlock Deck
Unlock for access to all 16 flashcards in this deck.
Unlock Deck
k this deck
5
One thousand students from a local university were sampled to gather information such as gender, high school GPA, college GPA, and total SAT scores.The results were used to create
Histograms displaying high school grade point averages (GPAs) for both males and females.
Compare the grade distribution of males and females.Check all that apply.
A)Both distributions are skewed to the left.
B)Both distributions appear to be centered at a GPA of about 3.0.
C)The distributions are skewed in different directions.
D)The distributions are differ strongly in center.
E)The distribution of male GPA appears slightly more spread out than the distribution of female GPA
Histograms displaying high school grade point averages (GPAs) for both males and females.
Compare the grade distribution of males and females.Check all that apply.
A)Both distributions are skewed to the left.
B)Both distributions appear to be centered at a GPA of about 3.0.
C)The distributions are skewed in different directions.
D)The distributions are differ strongly in center.
E)The distribution of male GPA appears slightly more spread out than the distribution of female GPA
Unlock Deck
Unlock for access to all 16 flashcards in this deck.
Unlock Deck
k this deck
6
The following boxplots show monthly sales revenue figures ($ thousands) for a discount office supply company with locations in three different regions of the U.S.(Northeast,
Southeast, and West).Which of the following statements is true?
A)The Northeast has the lowest mean sales revenue.
B)The Southeast has the lowest median sales revenue.
C)The West has the lowest mean sales revenue.
D)The West has the lowest median sales revenue.
E)None of the above.
Southeast, and West).Which of the following statements is true?
A)The Northeast has the lowest mean sales revenue.
B)The Southeast has the lowest median sales revenue.
C)The West has the lowest mean sales revenue.
D)The West has the lowest median sales revenue.
E)None of the above.
Unlock Deck
Unlock for access to all 16 flashcards in this deck.
Unlock Deck
k this deck
7
The boxplots show prices of used cars (in thousands of dollars) advertised for sale at three different car dealers.Which dealer's prices have the smallest IQR, and what is it?
A)CarZ: $3000.
B)CarZ: $8000.
C)Ace: $5000.
D)BuyIt: $5000.
E)Cannot say from boxplots only.
A)CarZ: $3000.
B)CarZ: $8000.
C)Ace: $5000.
D)BuyIt: $5000.
E)Cannot say from boxplots only.
Unlock Deck
Unlock for access to all 16 flashcards in this deck.
Unlock Deck
k this deck
8
The side-by-side boxplots show the cumulative college GPAs for sophomores, juniors, and seniors taking an intro stats course in Autumn 2003. Which class has the highest median GPA?
A)Sophomore
B)Junior
C)Senior
D)Both Junior and Senior
E)Both Sophomore and Junior
Which class has the highest median GPA?A)Sophomore
B)Junior
C)Senior
D)Both Junior and Senior
E)Both Sophomore and Junior
Unlock Deck
Unlock for access to all 16 flashcards in this deck.
Unlock Deck
k this deck
9
The boxplots show prices of used cars (in thousands of dollars) advertised for sale at three different car dealers.Which dealer offers the cheapest car offered, and at what price?
A)Car Z: $5000.
B)BuyIt: $6000.
C)Ace: $10000.
D)BuyIt: $10000.
E)Cannot say from boxplots only.
A)Car Z: $5000.
B)BuyIt: $6000.
C)Ace: $10000.
D)BuyIt: $10000.
E)Cannot say from boxplots only.
Unlock Deck
Unlock for access to all 16 flashcards in this deck.
Unlock Deck
k this deck
10
The side-by-side boxplots show the cumulative college GPAs for sophomores, juniors, and seniors taking an intro stats course in Autumn 2003. What is approximately the GPA of the class with the highest median GPA?
A)2.6
B)2.8
C)3.2
D)3.6
E)3.8
What is approximately the GPA of the class with the highest median GPA?A)2.6
B)2.8
C)3.2
D)3.6
E)3.8
Unlock Deck
Unlock for access to all 16 flashcards in this deck.
Unlock Deck
k this deck
11
The boxplots show prices of used cars (in thousands of dollars) advertised for sale at three different car dealers.Which dealer has the lowest median price, and how much is it?
A)Ace: $15000.
B)BuyIt: $8000.
C)CarZ: $12000.
D)BuyIt: $10000.
A)Ace: $15000.
B)BuyIt: $8000.
C)CarZ: $12000.
D)BuyIt: $10000.
Unlock Deck
Unlock for access to all 16 flashcards in this deck.
Unlock Deck
k this deck
12
How do sports salaries compare? Two sets of histograms below show the distributions of salaries for Major League Baseball and the National Football League.What set of histograms
Makes it easier to compare the distributions? And for what reasons? Check all that apply.
A)Both allow equal comparison.
B)The first set of histograms, because it uses different scales on the axes.
C)The second set of histograms, because it uses the same scales on the axes.
D)The first set of histograms, because it is stacked horizontally.
E)The second set of histograms, because it is stacked vertically.
Makes it easier to compare the distributions? And for what reasons? Check all that apply.
A)Both allow equal comparison.
B)The first set of histograms, because it uses different scales on the axes.
C)The second set of histograms, because it uses the same scales on the axes.
D)The first set of histograms, because it is stacked horizontally.
E)The second set of histograms, because it is stacked vertically.
Unlock Deck
Unlock for access to all 16 flashcards in this deck.
Unlock Deck
k this deck
13
The side-by-side boxplots show the cumulative college GPAs for sophomores, juniors, and seniors taking an intro stats course in Autumn 2003. What is the approximate value of the largest range for GPA?
A)0.8
B)1.0
C)1.4
D)2.4
E)3.0
What is the approximate value of the largest range for GPA?A)0.8
B)1.0
C)1.4
D)2.4
E)3.0
Unlock Deck
Unlock for access to all 16 flashcards in this deck.
Unlock Deck
k this deck
14
At www.census.gov you can create a "population pyramid" for any country.These pyramids are back-to-back histograms.This pyramid shows Mexico's 2000 female population and the
Census bureau's projection for 2050.Check all that apply.
A)The expected mean age in 2050 is higher than the mean age in 2000.
B)The expected median age in 2050 is higher than the median age in 2000.
C)The expected mean age in 2050 is lower than the mean age in 2000.
D)The expected median age in 2050 is lower than the median age in 2000.
E)The IQR of the distribution of projected ages in 2050 is larger than the IQR of the distribution of ages in 2000.
Unlock Deck
Unlock for access to all 16 flashcards in this deck.
Unlock Deck
k this deck
15
At www.census.gov you can create a "population pyramid" for any country.These pyramids are back-to-back histograms.This pyramid shows Mexico's 2000 female population and the
Census bureau's projection for 2050.Check all that apply.
A)The distribution of ages in 2000 is strongly skewed to the left.
B)The distribution of ages in 2000 is strongly skewed to the right.
C)The distribution of projected ages in 2050 is strongly skewed to the left.
D)The distribution of projected ages in 2050 is strongly skewed to the right.
E)The distribution of projected ages in 2050 is approximately uniform.
Unlock Deck
Unlock for access to all 16 flashcards in this deck.
Unlock Deck
k this deck
16
The side-by-side boxplots show the cumulative college GPAs for sophomores, juniors, and seniors taking an intro stats course in Autumn 2003. What is the approximate value of that GPA of the lowest scoring student?
A)1.6
B)1.8
C)2.6
D)2.8
E)3.0
What is the approximate value of that GPA of the lowest scoring student?A)1.6
B)1.8
C)2.6
D)2.8
E)3.0
Unlock Deck
Unlock for access to all 16 flashcards in this deck.
Unlock Deck
k this deck
Unlock Deck
Unlock for access to all 16 flashcards in this deck.


