Deck 17: Confidence Intervals for Means
Full screen (f)
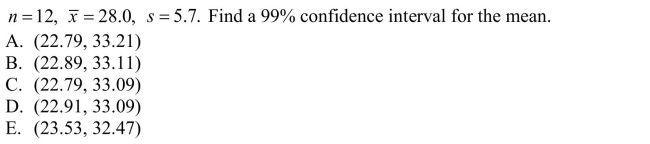
Question
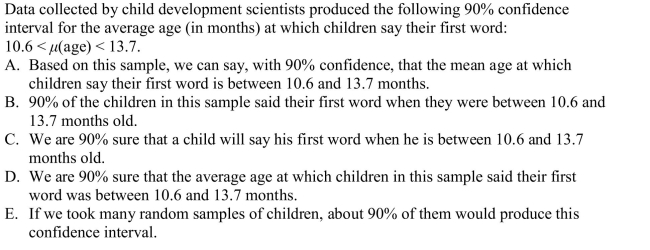
Question
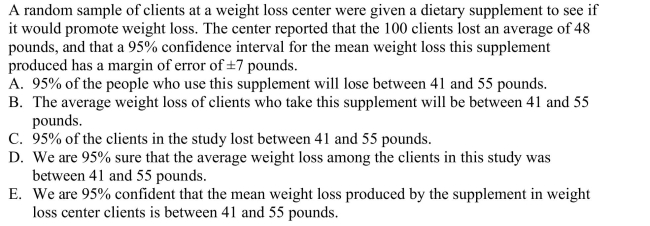
Question
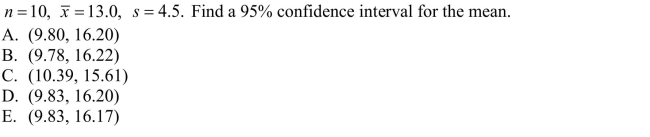
Question
The amounts (in ounces) of juice in eight randomly selected juice bottles are: 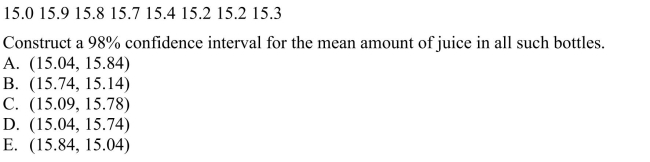
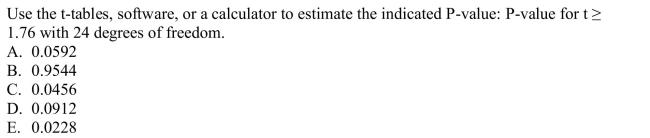
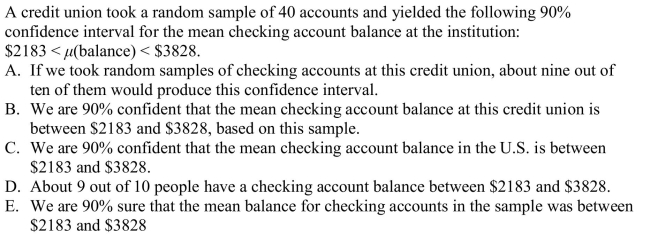
Question
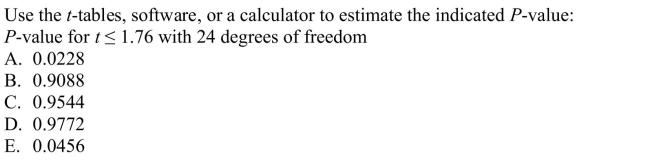
Question
Question
Question
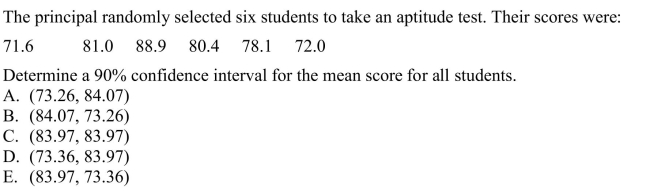
Question
Question
Question
Question
Question
Question
Question
Question

Question

Unlock Deck
Sign up to unlock the cards in this deck!
Unlock Deck
Unlock Deck
1/17
Play
Full screen (f)
Deck 17: Confidence Intervals for Means
1
Based on a sample of 30 randomly selected years, a 90% confidence interval for the mean annual precipitation in one city is from 48.7 inches to 51.3 inches.Find the margin of error.
A)0.39 inches
B)0.10 inches
C)2.6 inches
D)1.3 inches
E)There is not enough information to find the margin of error.
A)0.39 inches
B)0.10 inches
C)2.6 inches
D)1.3 inches
E)There is not enough information to find the margin of error.
D
2
C
3
C
4
The amounts (in ounces) of juice in eight randomly selected juice bottles are:
Unlock Deck
Unlock for access to all 17 flashcards in this deck.
Unlock Deck
k this deck
5
Using the t-tables, software, or a calculator, estimate the critical value of t for the given confidence interval and degrees of freedom: 80% confidence interval with df = 11
A)1.372
B)2.718
C)1.280
D)1.356
E)1.363
A)1.372
B)2.718
C)1.280
D)1.356
E)1.363
Unlock Deck
Unlock for access to all 17 flashcards in this deck.
Unlock Deck
k this deck
6
Using the t-tables, software, or a calculator, estimate the critical value of t for the given confidence interval and degrees of freedom: 90% confidence interval with df = 4.
A)1.645
B)1.533
C)2.353
D)2.132
E)4.604
A)1.645
B)1.533
C)2.353
D)2.132
E)4.604
Unlock Deck
Unlock for access to all 17 flashcards in this deck.
Unlock Deck
k this deck
7
Unlock Deck
Unlock for access to all 17 flashcards in this deck.
Unlock Deck
k this deck
8
Based on a sample of size 49, a 95% confidence interval for the mean score of all students, μ, on an aptitude test is from 59.2 to 64.8.Find the margin of error.
A)5.6
B)0.78
C)0.05
D)2.8
E)There is not enough information to find the margin of error.
A)5.6
B)0.78
C)0.05
D)2.8
E)There is not enough information to find the margin of error.
Unlock Deck
Unlock for access to all 17 flashcards in this deck.
Unlock Deck
k this deck
9
Unlock Deck
Unlock for access to all 17 flashcards in this deck.
Unlock Deck
k this deck
10
Unlock Deck
Unlock for access to all 17 flashcards in this deck.
Unlock Deck
k this deck
11
Unlock Deck
Unlock for access to all 17 flashcards in this deck.
Unlock Deck
k this deck
12
Unlock Deck
Unlock for access to all 17 flashcards in this deck.
Unlock Deck
k this deck
13
Thirty randomly selected students took the calculus final.If the sample mean was 95 and the standard deviation was 6.4, construct a 99% confidence interval for the mean score of all
Students.
A)(92.12, 97.88)
B)(91.78, 98.22)
C)(93.01, 98.21)
D)(93.01, 96.99)
E)(91.79, 98.21)
Students.
A)(92.12, 97.88)
B)(91.78, 98.22)
C)(93.01, 98.21)
D)(93.01, 96.99)
E)(91.79, 98.21)
Unlock Deck
Unlock for access to all 17 flashcards in this deck.
Unlock Deck
k this deck
14
A sociologist develops a test to measure attitudes about public transportation, and 27 randomly selected subjects are given the test.Their mean score is 76.2 and their standard
Deviation is 21.4.Construct the 95% confidence interval for the mean score of all such
Subjects.
A)(64.2, 83.2)
B)(64.2, 88.2)
C)(74.6, 77.8)
D)(69.2, 83.2)
E)(67.7, 84.7)
Deviation is 21.4.Construct the 95% confidence interval for the mean score of all such
Subjects.
A)(64.2, 83.2)
B)(64.2, 88.2)
C)(74.6, 77.8)
D)(69.2, 83.2)
E)(67.7, 84.7)
Unlock Deck
Unlock for access to all 17 flashcards in this deck.
Unlock Deck
k this deck
15
Unlock Deck
Unlock for access to all 17 flashcards in this deck.
Unlock Deck
k this deck
16
Unlock Deck
Unlock for access to all 17 flashcards in this deck.
Unlock Deck
k this deck
17
A certain population is strongly skewed to the right.We want to estimate its mean, so we will collect a sample.Which should be true if we use a large sample rather than a small one?
I)The distribution of our sample data will be closer to normal.
II)The sampling model of the sample means will be closer to normal.
III)The variability of the sample means will be greater.
A)I only
B)II only
C)III only
D)I and III only
E)II and III only
I)The distribution of our sample data will be closer to normal.
II)The sampling model of the sample means will be closer to normal.
III)The variability of the sample means will be greater.
A)I only
B)II only
C)III only
D)I and III only
E)II and III only
Unlock Deck
Unlock for access to all 17 flashcards in this deck.
Unlock Deck
k this deck
Unlock Deck
Unlock for access to all 17 flashcards in this deck.


