Deck 7: Linear Regression
Full screen (f)
Question
Question
Question
Question
Question
Question
Question
Question
Question
If the point in the upper right corner of this scatterplot is removed from the data set, then what will happen to the slope of the line of best fit (b) and to the correlation (r)? 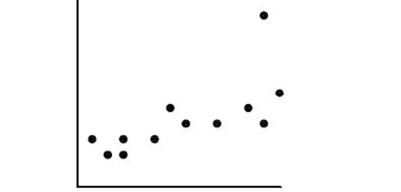
A)b will increase, and r will decrease.
B)b will decrease, and r will increase.
C)both will decrease.
D)both will increase.
E)both will remain the same.
A)b will increase, and r will decrease.
B)b will decrease, and r will increase.
C)both will decrease.
D)both will increase.
E)both will remain the same.
Question
Question
A small independent organic food store offers a variety of specialty coffees.To determine whether price has an impact on sales, the managers kept track of how many pounds of each
Variety of coffee were sold last month.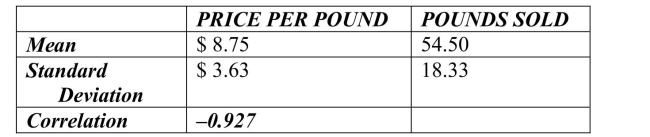 Based on the summary statistics shown below, what percent of the variability in the number
Of pounds of coffee sold per week can be explained by price?
A)95.47%
B)100%
C)85.9%
D)55.6%
E)4.68%
Variety of coffee were sold last month.
Based on the summary statistics shown below, what percent of the variability in the numberOf pounds of coffee sold per week can be explained by price?
A)95.47%
B)100%
C)85.9%
D)55.6%
E)4.68%
Question
A small independent organic food store offers a variety of specialty coffees.To determine whether price has an impact on sales, the managers kept track of how many pounds of each
Variety of coffee were sold last month.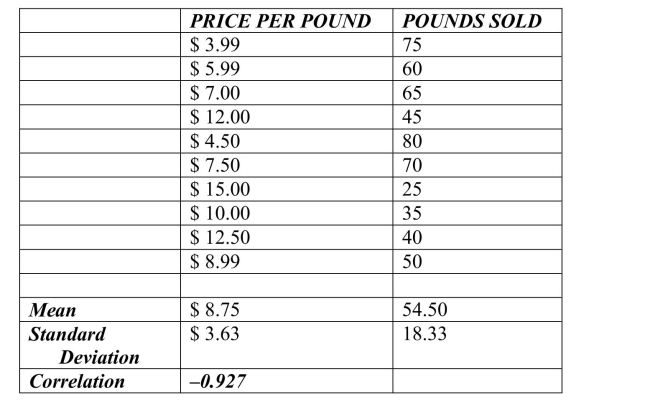 Based on the data and summary statistics shown below, the slope of the estimated regression
Line that relates the response variable (monthly sales) to the predictor variable (price per
Pound) is
A)95.459.
B).858.
C)-4.681.
D)-.858.
E)-8.999.
Variety of coffee were sold last month.
Based on the data and summary statistics shown below, the slope of the estimated regressionLine that relates the response variable (monthly sales) to the predictor variable (price per
Pound) is
A)95.459.
B).858.
C)-4.681.
D)-.858.
E)-8.999.
Question
Question
Question
A small independent organic food store offers a variety of specialty coffees.To determine whether price has an impact on sales, the managers kept track of how many pounds of each
Variety of coffee were sold last month.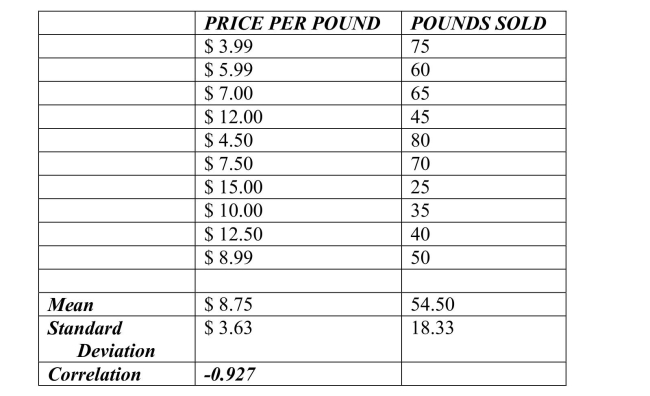 Based on the data and summary statistics, the intercept of the estimated regression line that
Relates the response variable (monthly sales) to the predictor variable (price per pound) is
A)95.459.
B).858.
C)-4.684.
D)-.858.
E)-8.999.
Variety of coffee were sold last month.
Based on the data and summary statistics, the intercept of the estimated regression line thatRelates the response variable (monthly sales) to the predictor variable (price per pound) is
A)95.459.
B).858.
C)-4.684.
D)-.858.
E)-8.999.
Question
Question
Question
If the point in the upper left corner of the scatterplot is removed, what will happen to the correlation (r) and the slope of the line of best fit (b)? 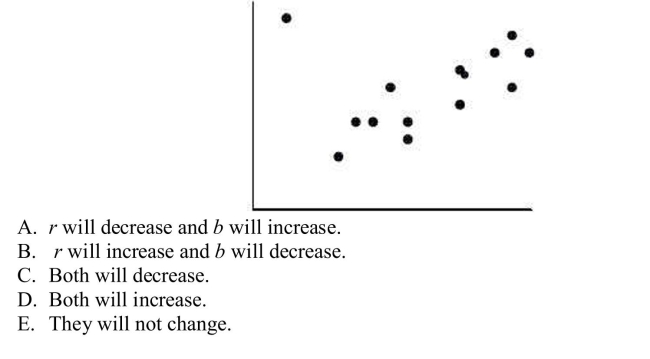

Unlock Deck
Sign up to unlock the cards in this deck!
Unlock Deck
Unlock Deck
1/18
Play
Full screen (f)
Deck 7: Linear Regression
1
E
2
Suppose the correlation, r, between two variables x and y is -0.44.What percentage of the variability in y cannot be explained by x?
A)19%
B)44%
C)81%
D)88%
E)12%
A)19%
B)44%
C)81%
D)88%
E)12%
A
3
R-sq is a measure of ...
A)the change in the y-variable that corresponds with the change in the x-variable.
B)the probability that the regression line makes a correct prediction.
C)the percentage of the accuracy of the regression equation.
D)the initial predicted starting point of the response variable when x is zero.
E)the proportion of the variability in the response variable that is explained by the explanatory variable.
E
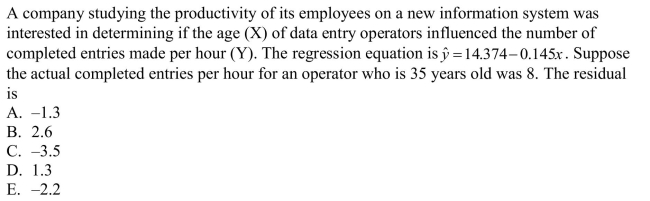
4
Residuals are …
A)the difference between observed responses and values predicted by the model.
B)data collected from individuals that is not consistent with the rest of the group.
C)none of these
D)possible models not explored by the researcher.
E)variation in the data that is explained by the model.
A)the difference between observed responses and values predicted by the model.
B)data collected from individuals that is not consistent with the rest of the group.
C)none of these
D)possible models not explored by the researcher.
E)variation in the data that is explained by the model.
Unlock Deck
Unlock for access to all 18 flashcards in this deck.
Unlock Deck
k this deck
5
An 8th grade class develops a linear model that predicts the number of cheerios (a small round cereal) that fit on the circumference of a plate by using the diameter in inches.Their
Model is cheerios = 0.56 + 5.11(diameter).
The slope of this model is best interpreted in context as…
A)For every 5.11 inches of diameter, the circumference is about 1 cheerio bigger.
B)For every 1 inch of diameter, the circumference holds about 0.56 more cheerios.
C)It takes 5.11 cheerios to fill a plate' s circumference.
D)For every 1 inch of diameter, the circumference holds about 5.11 more cheerios.
E)A mistake, because π is about 3.14 and that should be the slope.
Unlock Deck
Unlock for access to all 18 flashcards in this deck.
Unlock Deck
k this deck
6
Unlock Deck
Unlock for access to all 18 flashcards in this deck.
Unlock Deck
k this deck
7
An 8th grade class develops a linear model that predicts the number of cheerios (a small round cereal) that fit on the circumference of a plate by using the diameter in inches.Their
Model is cheerios = 0.56 + 5.11(diameter).
If the diameter is increased from 4 inches to 14 inches, the predicted number of cheerios will
Increase by about…
A)72
B)51
C)10
D)21
E)none of these above
Model is cheerios = 0.56 + 5.11(diameter).
If the diameter is increased from 4 inches to 14 inches, the predicted number of cheerios will
Increase by about…
A)72
B)51
C)10
D)21
E)none of these above
Unlock Deck
Unlock for access to all 18 flashcards in this deck.
Unlock Deck
k this deck
8
The correlation coefficient between high school grade point average (GPA) and college GPA is 0.560.For a student with a high school GPA that is 2.5 standard deviations above the
Mean, we would expect that student to have a college GPA that is ______ the mean.
A)0.56 SD above
B)1.94 SD above
C)2.5 SD above
D)equal to
E)1.4 SD above
Mean, we would expect that student to have a college GPA that is ______ the mean.
A)0.56 SD above
B)1.94 SD above
C)2.5 SD above
D)equal to
E)1.4 SD above
Unlock Deck
Unlock for access to all 18 flashcards in this deck.
Unlock Deck
k this deck
9
If the point in the upper right corner of this scatterplot is removed from the data set, then what will happen to the slope of the line of best fit (b) and to the correlation (r)?
A)b will increase, and r will decrease.
B)b will decrease, and r will increase.
C)both will decrease.
D)both will increase.
E)both will remain the same.
A)b will increase, and r will decrease.
B)b will decrease, and r will increase.
C)both will decrease.
D)both will increase.
E)both will remain the same.
Unlock Deck
Unlock for access to all 18 flashcards in this deck.
Unlock Deck
k this deck
10
Suppose the correlation, r, between two variables x and y is -0.44.What would you predict about a y value if the x value is 2 standard deviations above its mean?
A)It will be .88 standard deviations below its mean.
B)It will be .88 standard deviations above its mean.
C)It will be 2 standard deviations below its mean.
D)It will be .44 standard deviations below its mean.
E)It will be .44 standard deviations above its mean.
A)It will be .88 standard deviations below its mean.
B)It will be .88 standard deviations above its mean.
C)It will be 2 standard deviations below its mean.
D)It will be .44 standard deviations below its mean.
E)It will be .44 standard deviations above its mean.
Unlock Deck
Unlock for access to all 18 flashcards in this deck.
Unlock Deck
k this deck
11
A small independent organic food store offers a variety of specialty coffees.To determine whether price has an impact on sales, the managers kept track of how many pounds of each
Variety of coffee were sold last month. Based on the summary statistics shown below, what percent of the variability in the number
Of pounds of coffee sold per week can be explained by price?
A)95.47%
B)100%
C)85.9%
D)55.6%
E)4.68%
Variety of coffee were sold last month.
Based on the summary statistics shown below, what percent of the variability in the numberOf pounds of coffee sold per week can be explained by price?
A)95.47%
B)100%
C)85.9%
D)55.6%
E)4.68%
Unlock Deck
Unlock for access to all 18 flashcards in this deck.
Unlock Deck
k this deck
12
A small independent organic food store offers a variety of specialty coffees.To determine whether price has an impact on sales, the managers kept track of how many pounds of each
Variety of coffee were sold last month. Based on the data and summary statistics shown below, the slope of the estimated regression
Line that relates the response variable (monthly sales) to the predictor variable (price per
Pound) is
A)95.459.
B).858.
C)-4.681.
D)-.858.
E)-8.999.
Variety of coffee were sold last month.
Based on the data and summary statistics shown below, the slope of the estimated regressionLine that relates the response variable (monthly sales) to the predictor variable (price per
Pound) is
A)95.459.
B).858.
C)-4.681.
D)-.858.
E)-8.999.
Unlock Deck
Unlock for access to all 18 flashcards in this deck.
Unlock Deck
k this deck
13
Unlock Deck
Unlock for access to all 18 flashcards in this deck.
Unlock Deck
k this deck
14
Unlock Deck
Unlock for access to all 18 flashcards in this deck.
Unlock Deck
k this deck
15
A small independent organic food store offers a variety of specialty coffees.To determine whether price has an impact on sales, the managers kept track of how many pounds of each
Variety of coffee were sold last month. Based on the data and summary statistics, the intercept of the estimated regression line that
Relates the response variable (monthly sales) to the predictor variable (price per pound) is
A)95.459.
B).858.
C)-4.684.
D)-.858.
E)-8.999.
Variety of coffee were sold last month.
Based on the data and summary statistics, the intercept of the estimated regression line thatRelates the response variable (monthly sales) to the predictor variable (price per pound) is
A)95.459.
B).858.
C)-4.684.
D)-.858.
E)-8.999.
Unlock Deck
Unlock for access to all 18 flashcards in this deck.
Unlock Deck
k this deck
16
Unlock Deck
Unlock for access to all 18 flashcards in this deck.
Unlock Deck
k this deck
17
Unlock Deck
Unlock for access to all 18 flashcards in this deck.
Unlock Deck
k this deck
18
If the point in the upper left corner of the scatterplot is removed, what will happen to the correlation (r) and the slope of the line of best fit (b)?
Unlock Deck
Unlock for access to all 18 flashcards in this deck.
Unlock Deck
k this deck
Unlock Deck
Unlock for access to all 18 flashcards in this deck.


