Deck 14: Statistical Process Control
Full screen (f)
Question
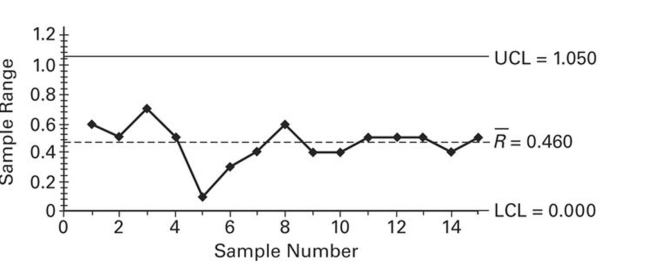
Construct an R chart and determine whether the process variation is within statistical control. 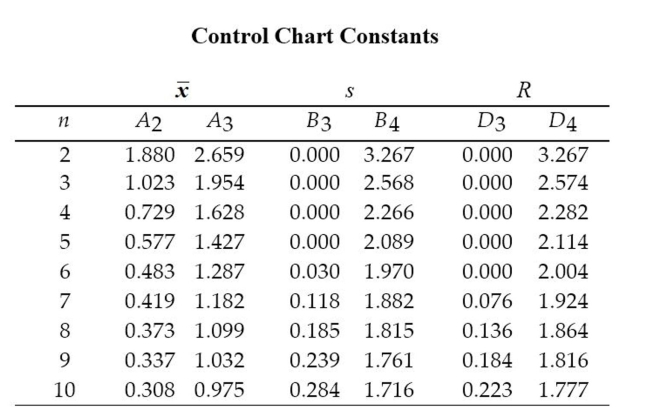 A machine is supposed to fill cans that contain 12 ounces. Each hour, a sample of four cans is tested; the results of 15
consecutive hours are given below.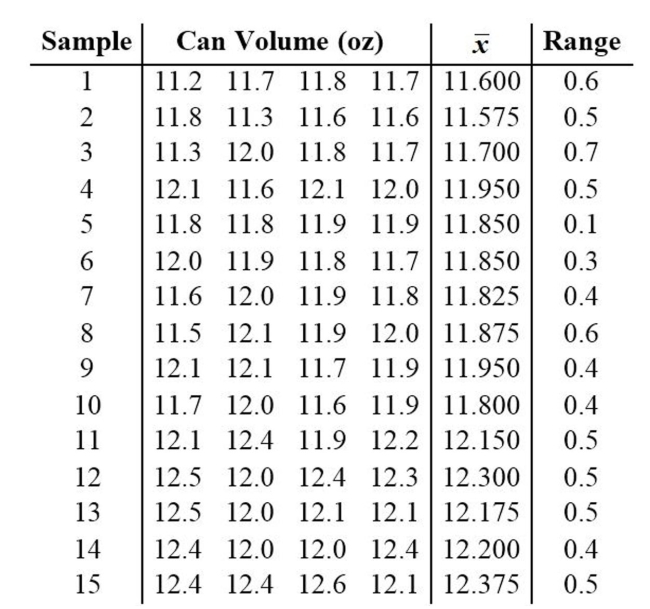
A machine is supposed to fill cans that contain 12 ounces. Each hour, a sample of four cans is tested; the results of 15consecutive hours are given below.
Question
Question
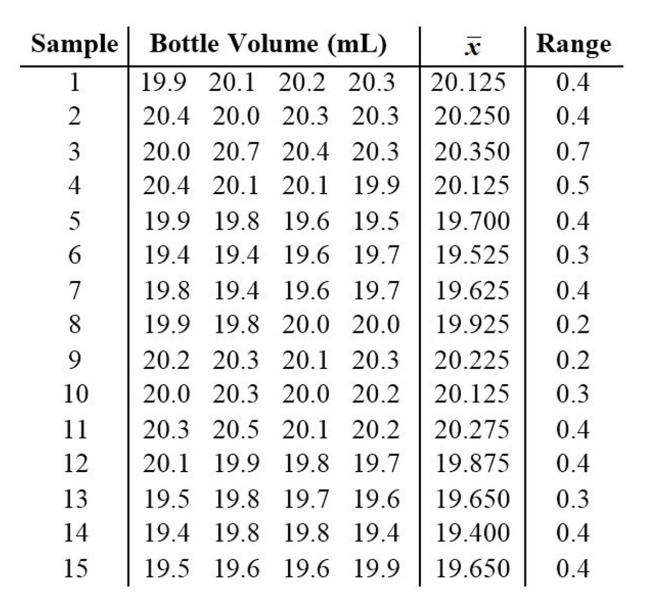
Construct an R chart and determine whether the process variation is within statistical control. 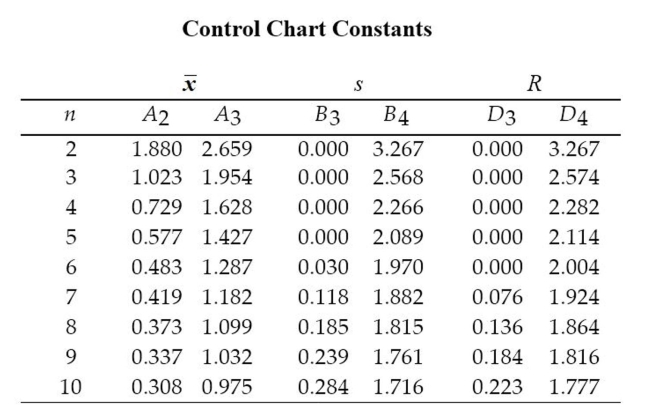 A machine that is supposed to fill small bottles to contain 20 milliliters yields the following data from a test of 4 bottles
every hour.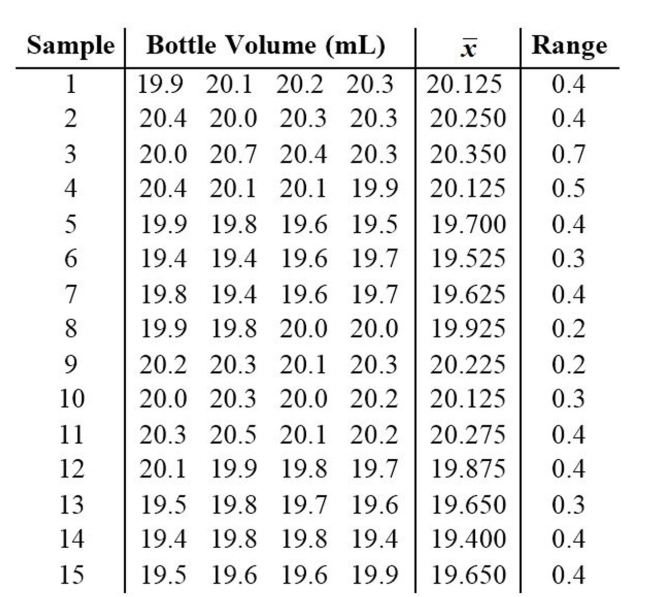
A machine that is supposed to fill small bottles to contain 20 milliliters yields the following data from a test of 4 bottlesevery hour.
Question
Question
Question
Examine the given run chart or control chart and determine whether the process is within statistical control. If it
is not, identify which of the three out-of-statistical-control criteria apply.
is not, identify which of the three out-of-statistical-control criteria apply.
Question
A control chart for R is shown below. Determine whether the process variation is within statistical control. If it
is not, identify which of the three out-of-control criteria lead to rejection of statistically stable variation.
is not, identify which of the three out-of-control criteria lead to rejection of statistically stable variation.
Question
Question
Question
Question
Question
Use the given process data to construct a control chart for p. If the weight of cereal in a particular packet is less than
14 ounces, the packet is considered nonconforming. Each week, the manufacturer randomly selects 1,000 cereal packets
and determines the number that are nonconforming. The results for 12 consecutive weeks are shown below.
14 ounces, the packet is considered nonconforming. Each week, the manufacturer randomly selects 1,000 cereal packets
and determines the number that are nonconforming. The results for 12 consecutive weeks are shown below.
Question
Question
Examine the given run chart or control chart and determine whether the process is within statistical control. If it
is not, identify which of the three out-of-statistical-control criteria apply.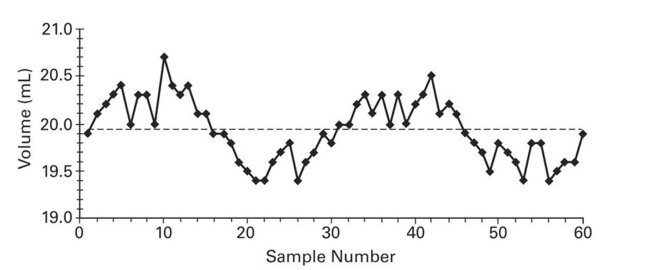
is not, identify which of the three out-of-statistical-control criteria apply.
Question
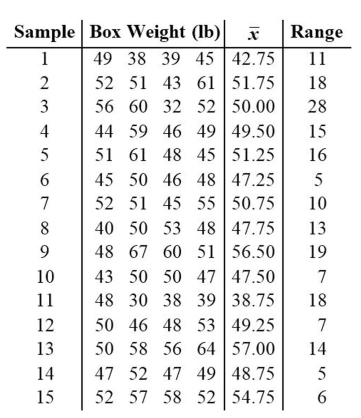
Construct a run chart for individual values corresponding to the given data. A machine is supposed to fill boxes
to a weight of 50 pounds. Every 30 minutes a sample of four boxes is tested; the results are given below.
to a weight of 50 pounds. Every 30 minutes a sample of four boxes is tested; the results are given below.
Question
Examine the given run chart or control chart and determine whether the process is within statistical control. If it
is not, identity which of the three out-of-statistical-control criteria apply. A run chart for individual values W is
shown below. Does there appear to be a pattern suggesting that the process is not within statistical control? If
so, describe the pattern.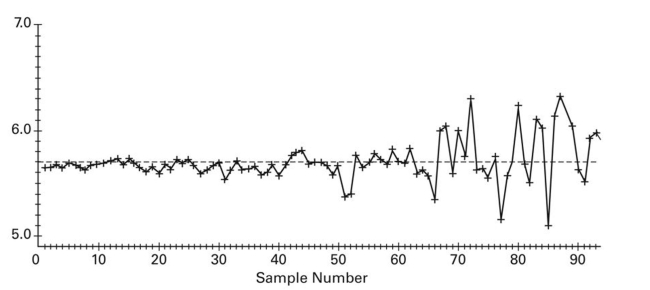
is not, identity which of the three out-of-statistical-control criteria apply. A run chart for individual values W is
shown below. Does there appear to be a pattern suggesting that the process is not within statistical control? If
so, describe the pattern.
Question
Use the given process data to construct a control chart for p. A manufacturer monitors the level of defects in the
television sets that it produces. Each week, 200 television sets are randomly selected and tested and the number of
defects is recorded. The results for 12 consecutive weeks are shown below.
television sets that it produces. Each week, 200 television sets are randomly selected and tested and the number of
defects is recorded. The results for 12 consecutive weeks are shown below.
Question
Question
 A machine is supposed to fill boxes to a weight of 50 pounds. Every 30 minutes a sample of four boxes is tested; the
results are given below.
Question
Question
Question
Examine the given run chart or control chart and determine whether the process is within statistical control. If it
is not, identify which of the three out-of-statistical-control criteria apply.
is not, identify which of the three out-of-statistical-control criteria apply.
Question
Use the given process data to construct a control chart for p. A drugstore considers a wait of more than 5 minutes to
be a defect. Each week 100 customers are randomly selected and timed at the checkout line. The numbers of defects for
20 consecutive weeks are given below.
be a defect. Each week 100 customers are randomly selected and timed at the checkout line. The numbers of defects for
20 consecutive weeks are given below.
Question
Question
A control chart for R is shown below. Determine whether the process variation is within statistical control. If it
is not, identify which of the three out-of-control criteria lead to rejection of statistically stable variation.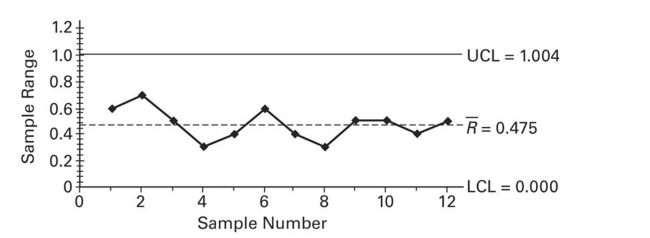
is not, identify which of the three out-of-control criteria lead to rejection of statistically stable variation.
Question
Question
Question
Question
Construct an R chart and determine whether the process variation is within statistical control. 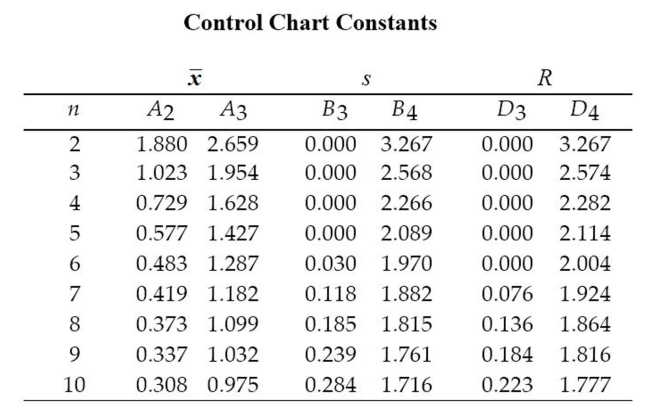 A machine that is supposed to produce ball bearings with a diameter of 7 millimeters yields the following data from a
test of 5 ball bearings every 20 minutes.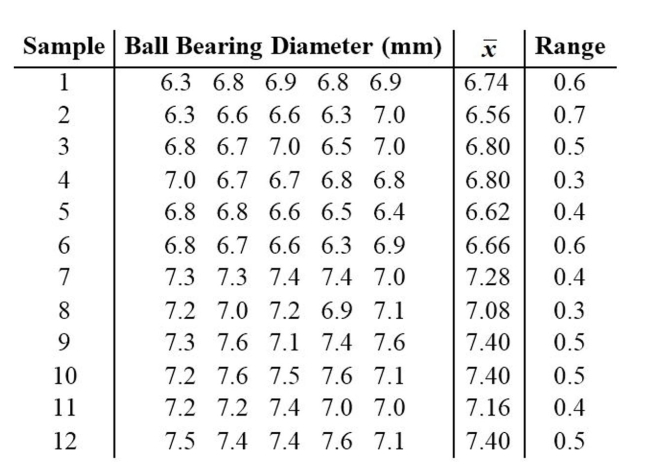
A machine that is supposed to produce ball bearings with a diameter of 7 millimeters yields the following data from atest of 5 ball bearings every 20 minutes.
Question
Construct a run chart for individual values corresponding to the given data. A machine that is supposed to
produce ball bearings with a diameter of 7 millimeters yields the following data from a test of 5 ball bearings
every 20 minutes.
produce ball bearings with a diameter of 7 millimeters yields the following data from a test of 5 ball bearings
every 20 minutes.
Question
Question
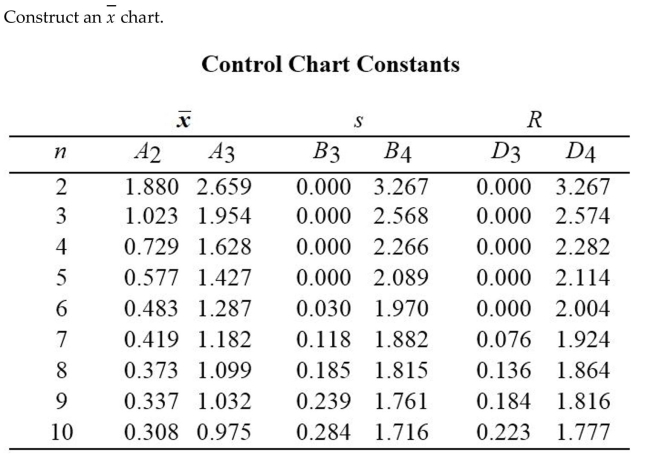
Construct an  chart and determine whether the process variation is within statistical control.
 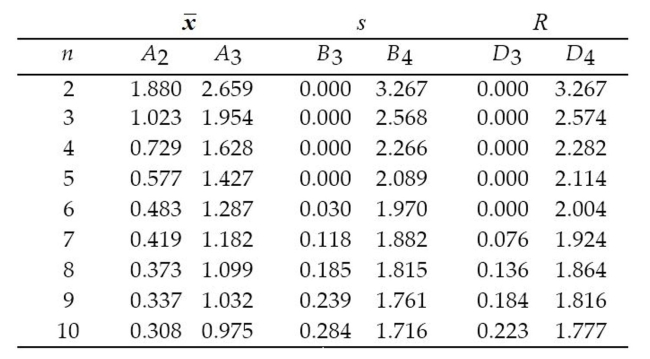 A machine that is supposed to produce ball bearings with a diameter of 7 millimeters yields the following data
from a test of 5 ball bearings every 20 minutes.
chart and determine whether the process variation is within statistical control. A machine that is supposed to produce ball bearings with a diameter of 7 millimeters yields the following datafrom a test of 5 ball bearings every 20 minutes.
Question
A run chart for individual values is shown below. Does there appear to be a pattern suggesting that the process
is not within statistical control? If so, describe the pattern.
is not within statistical control? If so, describe the pattern.
Question
Question
Question
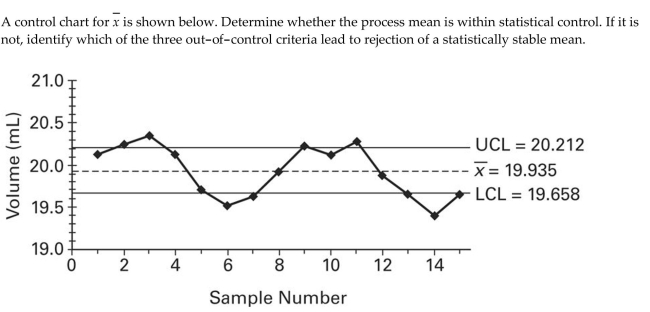
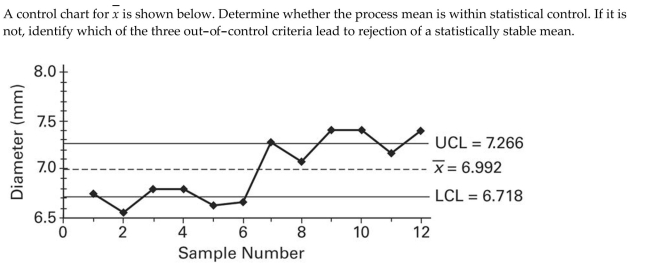
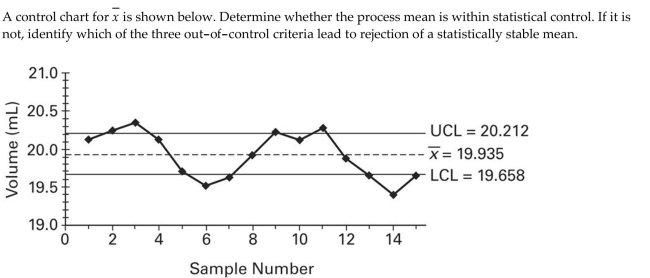
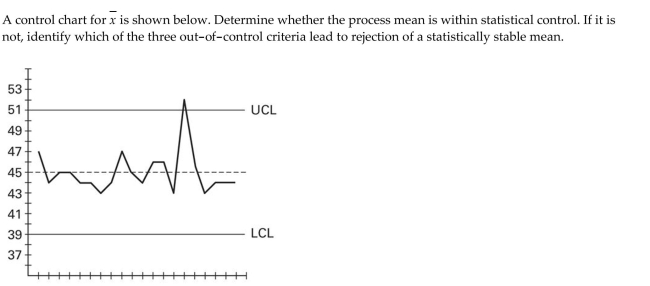
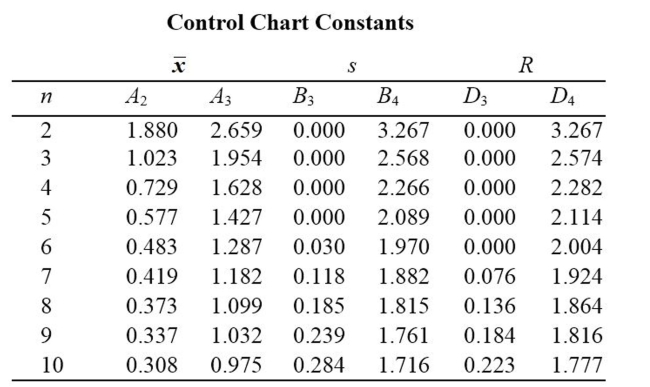
A control chart for  s shown below. Determine whether the process mean is within statistical control. If it is
not, identify which of the three out-of-control criteria lead to rejection of a statistically stable mean.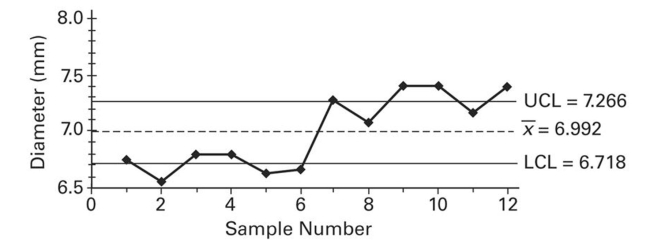
s shown below. Determine whether the process mean is within statistical control. If it isnot, identify which of the three out-of-control criteria lead to rejection of a statistically stable mean.
Question
Question
Question
Examine the given run chart or control chart and determine whether the process is within statistical control. If it
is not, identify which of the three out-of-statistical-control criteria apply.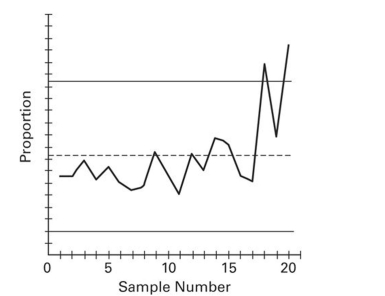
is not, identify which of the three out-of-statistical-control criteria apply.
Question
Question
Examine the given run chart or control chart and determine whether the process is within statistical control. 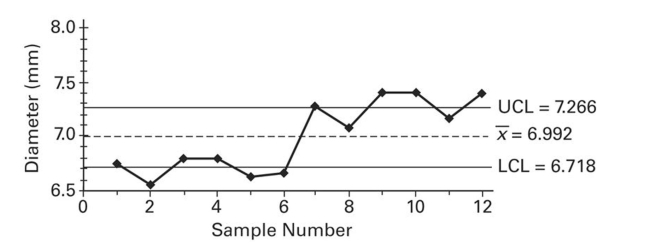
A) The process is within statistical control.
B) The process is not within statistical control.
A) The process is within statistical control.
B) The process is not within statistical control.
Question
Question
Question
Question
Question
Use the given process data to construct a control chart for p. A candy manufacturer considers a cracked piece of candy to be a defect. Each day 100 candies are randomly selected and checked for cracks. The numbers of defects for 20
Consecutive days are given below. What is the value of the center line?
A) 10
B) 1.32
C) 6.6
D) 0.066
Consecutive days are given below.
What is the value of the center line?A) 10
B) 1.32
C) 6.6
D) 0.066
Question
Question
A control chart for  s shown below. Determine whether the process mean is within statistical control. If it is
not, identify which of the three out-of-control criteria lead to rejection of a statistically stable mean.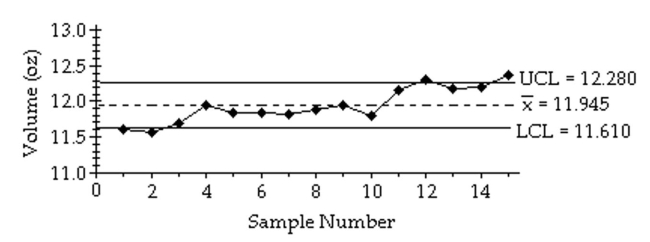
s shown below. Determine whether the process mean is within statistical control. If it isnot, identify which of the three out-of-control criteria lead to rejection of a statistically stable mean.
Question
A machine that is supposed to fill small bottles to contain 20 milliliters yields the following data from a test of 4 bottles every hour. What would be the centerline for a control chart for  ?
? 
A) 19.935 milliliters
B) 0.380 milliliters
C) 20.000 milliliters
D) 20.212 milliliters
? A) 19.935 milliliters
B) 0.380 milliliters
C) 20.000 milliliters
D) 20.212 milliliters
Question
Examine the given run chart or control chart and determine whether the process is within statistical control. 
A) The process is within statistical control.
B) The process is not within statistical control.
A) The process is within statistical control.
B) The process is not within statistical control.
Question
A manufacturer of lightbulbs picks 10 lightbulbs at random each day for quality control. The mean and range (in hours) of the lifetimes of the 10 lightbulbs are calculated. The results for 12 consecutive days are shown in
The table below. Construct an R chart to determine whether the process is in statistical control.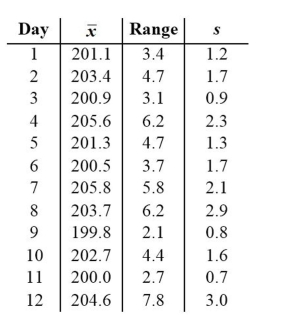
A) The process is not within statistical control.
B) The process is within statistical control.
The table below. Construct an R chart to determine whether the process is in statistical control.
A) The process is not within statistical control.
B) The process is within statistical control.
Question
Which graph using individual data values instead of a process characteristic?
A) R chart
B) Run chart
C)
D) p chart
A) R chart
B) Run chart
C)
D) p chart
Question
Use the given process data to construct a control chart for p. A drugstore considers a wait of more than 5 minutes to be a defect. Each week 100 customers are randomly selected and timed at the checkout line. The numbers of defects for
20 consecutive weeks are given below. What is the value of the upper control limit?
A) 0.0622
B) 0.0783
C) 1
D) 6.2
20 consecutive weeks are given below.
What is the value of the upper control limit?A) 0.0622
B) 0.0783
C) 1
D) 6.2
Question
A control chart for  is shown below. Determine whether the process mean is within statistical control. If it is
not, identify which of the three out-of-control criteria lead to rejection of a statistically stable mean.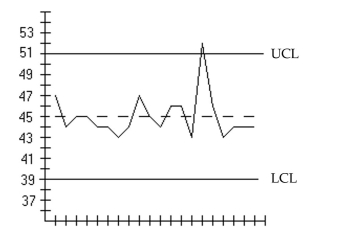
is shown below. Determine whether the process mean is within statistical control. If it isnot, identify which of the three out-of-control criteria lead to rejection of a statistically stable mean.
Question
Examine the given run chart or control chart and determine whether the process is within statistical control. 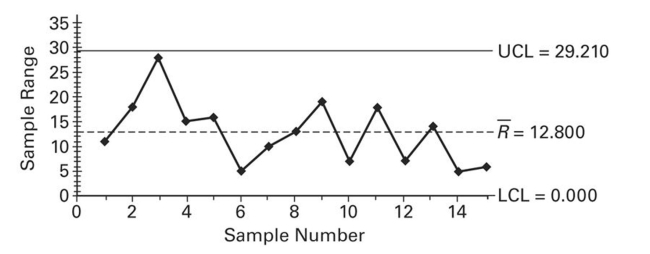
A) The process is within statistical control.
B) The process is not within statistical control.
A) The process is within statistical control.
B) The process is not within statistical control.
Question
Question
A machine is supposed to fill boxes to a weight of 50 pounds. Every 30 minutes a sample of four boxes is tested; the results are given below.
What would be the value of the centerline that would be used in creating an R chart?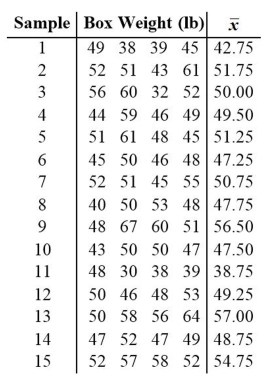
A) 11.000 pounds
B) 12.8000 pounds
C) 50 pounds
D) 49.567 pounds
What would be the value of the centerline that would be used in creating an R chart?
A) 11.000 pounds
B) 12.8000 pounds
C) 50 pounds
D) 49.567 pounds
Question
Which type of chart would be best for monitoring the proportion of items that are defective?
A) p chart
B) Run chart
C)
D) R chart
A) p chart
B) Run chart
C)
D) R chart
Question
A run chart for individual values is shown below. Does there appear to be a pattern suggesting that the process
is not within statistical control? If so, describe the pattern.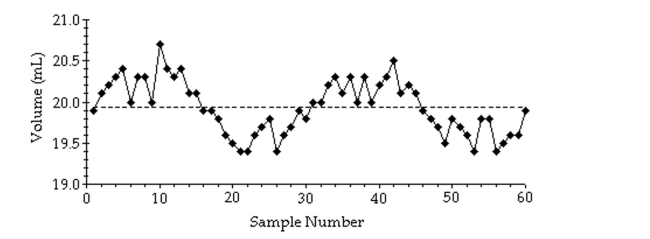
is not within statistical control? If so, describe the pattern.
Question
A machine is supposed to fill boxes to a weight of 50 pounds. Every 30 minutes a sample of four boxes is tested;
the results are given below.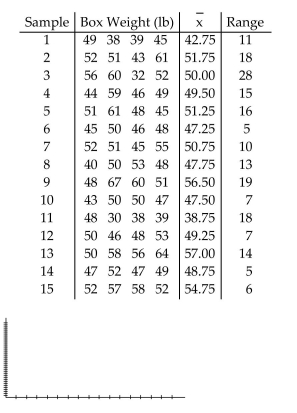
the results are given below.
Question
A machine that is supposed to fill small bottles to contain 20 milliliters yields the following data from a test of 4
bottles every hour.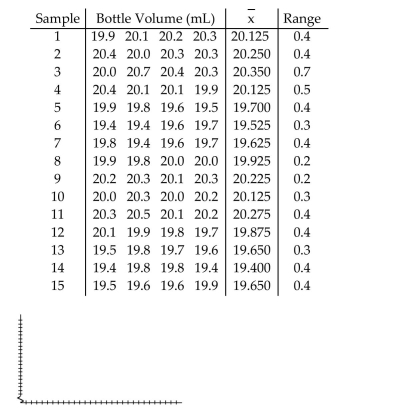
bottles every hour.
Question
A machine that is supposed to fill small bottles to contain 20 milliliters yields the following data from a test of 4
bottles every hour.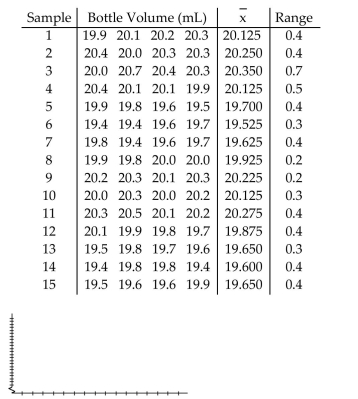
bottles every hour.
Question
A control chart for  is shown below. Determine whether the process mean is within statistical control. If it is
not, identify which of the three out-of-control criteria lead to rejection of a statistically stable mean.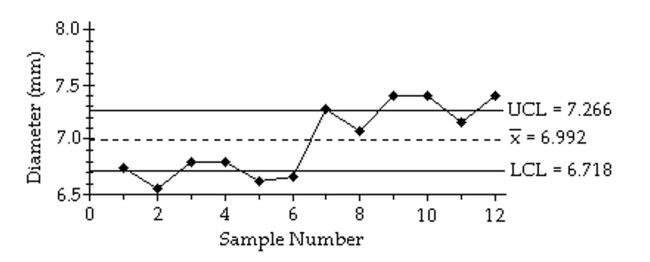
is shown below. Determine whether the process mean is within statistical control. If it isnot, identify which of the three out-of-control criteria lead to rejection of a statistically stable mean.
Question
A machine is supposed to fill boxes to a weight of 50 pounds. Every 30 minutes a sample of four boxes is tested;
the results are given below.
the results are given below.
Question
A control chart for monitoring variation and center can be based on standard deviations instead of on ranges.
An s chart for monitoring variation is made by plotting sample standard deviations with a centerline at (the
(the
mean of the sample standard deviations) and control limits at , where
  are found in the
Control Chart Constants table. Construct an s chart for the data below.
A manufacturer of lightbulbs picks 10 lightbulbs at random each day for quality control. The mean, standard
deviation, and range (in hours) of the lifetimes of the 10 lightbulbs are calculated. The results for 12 consecutive
days are shown in the table below.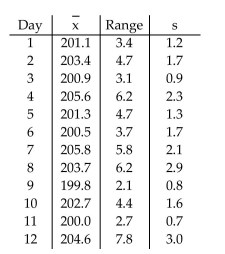
An s chart for monitoring variation is made by plotting sample standard deviations with a centerline at
(themean of the sample standard deviations) and control limits at
, where are found in theControl Chart Constants table. Construct an s chart for the data below.
A manufacturer of lightbulbs picks 10 lightbulbs at random each day for quality control. The mean, standard
deviation, and range (in hours) of the lifetimes of the 10 lightbulbs are calculated. The results for 12 consecutive
days are shown in the table below.
Question
A run chart for individual values is shown below. Does there appear to be a pattern suggesting that the process
is not within statistical control? If so, describe the pattern.
is not within statistical control? If so, describe the pattern.
Question
A machine is supposed to fill cans that contain 12 ounces. Each hour, a sample of four cans is tested; the results
of 15 consecutive hours are given below.
of 15 consecutive hours are given below.
Question
A machine that is supposed to produce ball bearings with a diameter of 7 millimeters yields the following data
from a test of 5 ball bearings every 20 minutes.
from a test of 5 ball bearings every 20 minutes.
Question
A machine is supposed to fill boxes to a weight of 50 pounds. Every 30 minutes a sample of four boxes is tested;
the results are given below.
the results are given below.
Question
A control chart for R is shown below. Determine whether the process variation is within statistical control. If it
is not, identify which of the three out-of-control criteria lead to rejection of statistically stable variation.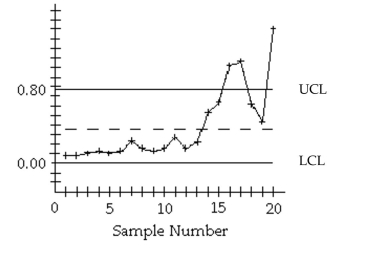
is not, identify which of the three out-of-control criteria lead to rejection of statistically stable variation.
Question
A machine that is supposed to fill small bottles to contain 20 milliliters yields the following data from a test of 4
bottles every hour.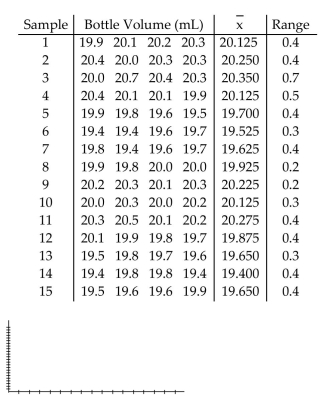
bottles every hour.
Question
A machine is supposed to fill cans that contain 12 ounces. Each hour, a sample of four cans is tested; the results
of 15 consecutive hours are given below.
of 15 consecutive hours are given below.
Question
A machine that is supposed to produce ball bearings with a diameter of 7 millimeters yields the following data
from a test of 5 ball bearings every 20 minutes.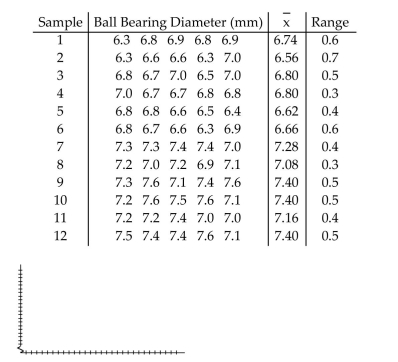
from a test of 5 ball bearings every 20 minutes.
Question
A run chart for individual values is shown below. Does there appear to be a pattern suggesting that the process
is not within statistical control? If so, describe the pattern.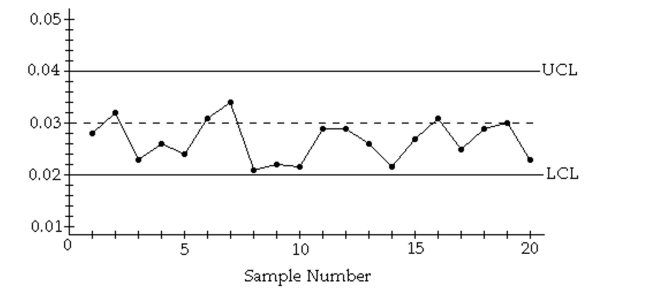
is not within statistical control? If so, describe the pattern.
Question
A machine that is supposed to produce ball bearings with a diameter of 7 millimeters yields the following data
from a test of 5 ball bearings every 20 minutes.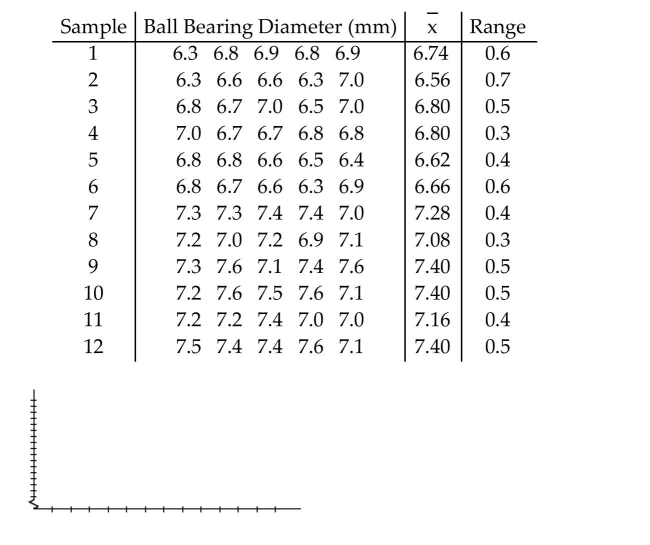
from a test of 5 ball bearings every 20 minutes.
Question
A machine is supposed to fill cans that contain 12 ounces. Each hour, a sample of four cans is tested; the results
of 15 consecutive hours are given below.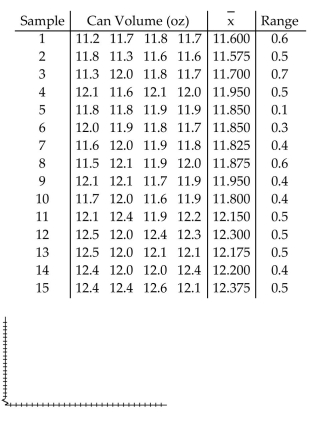
of 15 consecutive hours are given below.
Question
A control chart for R is shown below. Determine whether the process variation is within statistical control. If it
is not, identify which of the three out-of-control criteria lead to rejection of statistically stable variation.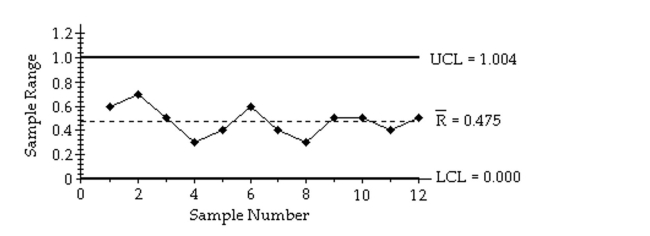
is not, identify which of the three out-of-control criteria lead to rejection of statistically stable variation.
Question
A control chart for  is shown below. Determine whether the process mean is within statistical control. If it is
not, identify which of the three out-of-control criteria lead to rejection of a statistically stable mean.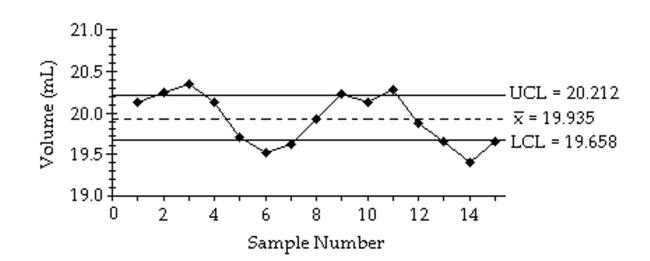
is shown below. Determine whether the process mean is within statistical control. If it isnot, identify which of the three out-of-control criteria lead to rejection of a statistically stable mean.
Question
A manufacturer monitors the level of defects in the television sets that it produces. Each week, 200 television
sets are randomly selected and tested and the number of defects is recorded. The results for 12 consecutive
weeks are shown below.
sets are randomly selected and tested and the number of defects is recorded. The results for 12 consecutive
weeks are shown below.

Unlock Deck
Sign up to unlock the cards in this deck!
Unlock Deck
Unlock Deck
1/90
Play
Full screen (f)
Deck 14: Statistical Process Control
1
Construct an R chart and determine whether the process variation is within statistical control. A machine is supposed to fill cans that contain 12 ounces. Each hour, a sample of four cans is tested; the results of 15
consecutive hours are given below.
A machine is supposed to fill cans that contain 12 ounces. Each hour, a sample of four cans is tested; the results of 15consecutive hours are given below.
2
A common goal of quality control is to reduce variation in a product or service. List and describe the two types
of variability. Give an example of each.
of variability. Give an example of each.
Random variation is due to chance, the variation inherent in any process that is not capable of producing
each good or service exactly the same way every time. Assignable variation results from causes that can
be identified. Examples may vary.
each good or service exactly the same way every time. Assignable variation results from causes that can
be identified. Examples may vary.
3
Construct an R chart and determine whether the process variation is within statistical control. A machine that is supposed to fill small bottles to contain 20 milliliters yields the following data from a test of 4 bottles
every hour.
A machine that is supposed to fill small bottles to contain 20 milliliters yields the following data from a test of 4 bottlesevery hour.
The process appears to be within statistical control. 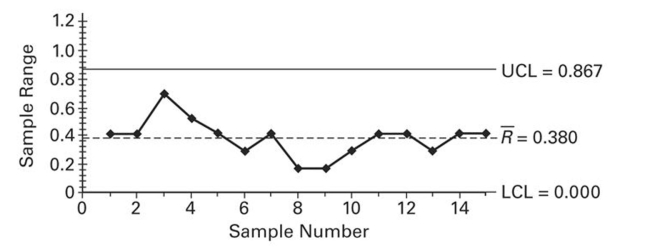
4
Unlock Deck
Unlock for access to all 90 flashcards in this deck.
Unlock Deck
k this deck
5
Define statistically stable (or "within statistical control"). Show examples of run charts which illustrate processes
which are not statistically controlled. Discuss the pattern which indicates the process is not statistically
controlled for each example.
which are not statistically controlled. Discuss the pattern which indicates the process is not statistically
controlled for each example.
Unlock Deck
Unlock for access to all 90 flashcards in this deck.
Unlock Deck
k this deck
6
Examine the given run chart or control chart and determine whether the process is within statistical control. If it
is not, identify which of the three out-of-statistical-control criteria apply.
is not, identify which of the three out-of-statistical-control criteria apply.
Unlock Deck
Unlock for access to all 90 flashcards in this deck.
Unlock Deck
k this deck
7
A control chart for R is shown below. Determine whether the process variation is within statistical control. If it
is not, identify which of the three out-of-control criteria lead to rejection of statistically stable variation.
is not, identify which of the three out-of-control criteria lead to rejection of statistically stable variation.
Unlock Deck
Unlock for access to all 90 flashcards in this deck.
Unlock Deck
k this deck
8
Describe an R chart and give an example. What does it attempt to monitor?
Unlock Deck
Unlock for access to all 90 flashcards in this deck.
Unlock Deck
k this deck
9
Sketch a control chart that indicates that a process is not statistically stable due to the run of 8 rule.
Unlock Deck
Unlock for access to all 90 flashcards in this deck.
Unlock Deck
k this deck
10
Describe a run chart and give an example. Refer to the values on each of the axes as you describe the run chart.
Unlock Deck
Unlock for access to all 90 flashcards in this deck.
Unlock Deck
k this deck
11
Are control charts based on actual behavior or on desired behavior? Give an example to illustrate the difference
between the two types of behavior.
between the two types of behavior.
Unlock Deck
Unlock for access to all 90 flashcards in this deck.
Unlock Deck
k this deck
12
Use the given process data to construct a control chart for p. If the weight of cereal in a particular packet is less than
14 ounces, the packet is considered nonconforming. Each week, the manufacturer randomly selects 1,000 cereal packets
and determines the number that are nonconforming. The results for 12 consecutive weeks are shown below.
14 ounces, the packet is considered nonconforming. Each week, the manufacturer randomly selects 1,000 cereal packets
and determines the number that are nonconforming. The results for 12 consecutive weeks are shown below.
Unlock Deck
Unlock for access to all 90 flashcards in this deck.
Unlock Deck
k this deck
13
Unlock Deck
Unlock for access to all 90 flashcards in this deck.
Unlock Deck
k this deck
14
Examine the given run chart or control chart and determine whether the process is within statistical control. If it
is not, identify which of the three out-of-statistical-control criteria apply.
is not, identify which of the three out-of-statistical-control criteria apply.
Unlock Deck
Unlock for access to all 90 flashcards in this deck.
Unlock Deck
k this deck
15
Construct a run chart for individual values corresponding to the given data. A machine is supposed to fill boxes
to a weight of 50 pounds. Every 30 minutes a sample of four boxes is tested; the results are given below.
to a weight of 50 pounds. Every 30 minutes a sample of four boxes is tested; the results are given below.
Unlock Deck
Unlock for access to all 90 flashcards in this deck.
Unlock Deck
k this deck
16
Examine the given run chart or control chart and determine whether the process is within statistical control. If it
is not, identity which of the three out-of-statistical-control criteria apply. A run chart for individual values W is
shown below. Does there appear to be a pattern suggesting that the process is not within statistical control? If
so, describe the pattern.
is not, identity which of the three out-of-statistical-control criteria apply. A run chart for individual values W is
shown below. Does there appear to be a pattern suggesting that the process is not within statistical control? If
so, describe the pattern.
Unlock Deck
Unlock for access to all 90 flashcards in this deck.
Unlock Deck
k this deck
17
Use the given process data to construct a control chart for p. A manufacturer monitors the level of defects in the
television sets that it produces. Each week, 200 television sets are randomly selected and tested and the number of
defects is recorded. The results for 12 consecutive weeks are shown below.
television sets that it produces. Each week, 200 television sets are randomly selected and tested and the number of
defects is recorded. The results for 12 consecutive weeks are shown below.
Unlock Deck
Unlock for access to all 90 flashcards in this deck.
Unlock Deck
k this deck
18
Describe the three criteria used to determine if a control chart indicates a process which is not statistically stable.
Unlock Deck
Unlock for access to all 90 flashcards in this deck.
Unlock Deck
k this deck
19
A machine is supposed to fill boxes to a weight of 50 pounds. Every 30 minutes a sample of four boxes is tested; theresults are given below.
Unlock Deck
Unlock for access to all 90 flashcards in this deck.
Unlock Deck
k this deck
20
Provide an appropriate response. Describe what process data are. Why are process data important to
businesses? What is a common goal of businesses using quality control?
businesses? What is a common goal of businesses using quality control?
Unlock Deck
Unlock for access to all 90 flashcards in this deck.
Unlock Deck
k this deck
21
A control chart for attributes is to be constructed. Which process would have wider control limits, a process
which has been having a 5% rate of nonconforming items, or a process which has been having a 10% of
nonconforming items? Assume that both processes have the same sample sizes. For a given sample size, would
it be easier to detect a shift from 5% to 10% or a shift from 10% to 15%? Explain your reasoning.
Unlock Deck
Unlock for access to all 90 flashcards in this deck.
Unlock Deck
k this deck
22
Examine the given run chart or control chart and determine whether the process is within statistical control. If it
is not, identify which of the three out-of-statistical-control criteria apply.
is not, identify which of the three out-of-statistical-control criteria apply.
Unlock Deck
Unlock for access to all 90 flashcards in this deck.
Unlock Deck
k this deck
23
Use the given process data to construct a control chart for p. A drugstore considers a wait of more than 5 minutes to
be a defect. Each week 100 customers are randomly selected and timed at the checkout line. The numbers of defects for
20 consecutive weeks are given below.
be a defect. Each week 100 customers are randomly selected and timed at the checkout line. The numbers of defects for
20 consecutive weeks are given below.
Unlock Deck
Unlock for access to all 90 flashcards in this deck.
Unlock Deck
k this deck
24
Provide an appropriate response. A common goal of quality control is to reduce variation in a product or
service. List and describe the two types of variability. Give an example of each.
service. List and describe the two types of variability. Give an example of each.
Unlock Deck
Unlock for access to all 90 flashcards in this deck.
Unlock Deck
k this deck
25
A control chart for R is shown below. Determine whether the process variation is within statistical control. If it
is not, identify which of the three out-of-control criteria lead to rejection of statistically stable variation.
is not, identify which of the three out-of-control criteria lead to rejection of statistically stable variation.
Unlock Deck
Unlock for access to all 90 flashcards in this deck.
Unlock Deck
k this deck
26
Unlock Deck
Unlock for access to all 90 flashcards in this deck.
Unlock Deck
k this deck
27
Sketch a run chart that that indicates that a process is not statistically stable due to increasing variation.
Unlock Deck
Unlock for access to all 90 flashcards in this deck.
Unlock Deck
k this deck
28
Describe the three criteria used to determine if a control chart indicates a process which is not statistically stable.
Unlock Deck
Unlock for access to all 90 flashcards in this deck.
Unlock Deck
k this deck
29
Construct an R chart and determine whether the process variation is within statistical control. A machine that is supposed to produce ball bearings with a diameter of 7 millimeters yields the following data from a
test of 5 ball bearings every 20 minutes.
A machine that is supposed to produce ball bearings with a diameter of 7 millimeters yields the following data from atest of 5 ball bearings every 20 minutes.
Unlock Deck
Unlock for access to all 90 flashcards in this deck.
Unlock Deck
k this deck
30
Construct a run chart for individual values corresponding to the given data. A machine that is supposed to
produce ball bearings with a diameter of 7 millimeters yields the following data from a test of 5 ball bearings
every 20 minutes.
produce ball bearings with a diameter of 7 millimeters yields the following data from a test of 5 ball bearings
every 20 minutes.
Unlock Deck
Unlock for access to all 90 flashcards in this deck.
Unlock Deck
k this deck
31
Control charts are used to monitor changing characteristics of data over ________.
A) time
B) speed
C) distance
D) space
A) time
B) speed
C) distance
D) space
Unlock Deck
Unlock for access to all 90 flashcards in this deck.
Unlock Deck
k this deck
32
Construct an chart and determine whether the process variation is within statistical control. A machine that is supposed to produce ball bearings with a diameter of 7 millimeters yields the following data
from a test of 5 ball bearings every 20 minutes.
chart and determine whether the process variation is within statistical control. A machine that is supposed to produce ball bearings with a diameter of 7 millimeters yields the following datafrom a test of 5 ball bearings every 20 minutes.
Unlock Deck
Unlock for access to all 90 flashcards in this deck.
Unlock Deck
k this deck
33
A run chart for individual values is shown below. Does there appear to be a pattern suggesting that the process
is not within statistical control? If so, describe the pattern.
is not within statistical control? If so, describe the pattern.
Unlock Deck
Unlock for access to all 90 flashcards in this deck.
Unlock Deck
k this deck
34
Define statistically stable (or "within statistical control"). Show examples of run charts which illustrate processes
which are not statistically controlled. Discuss the pattern which indicates the process is not statistically
controlled for each example.
which are not statistically controlled. Discuss the pattern which indicates the process is not statistically
controlled for each example.
Unlock Deck
Unlock for access to all 90 flashcards in this deck.
Unlock Deck
k this deck
35
Unlock Deck
Unlock for access to all 90 flashcards in this deck.
Unlock Deck
k this deck
36
A control chart for s shown below. Determine whether the process mean is within statistical control. If it is
not, identify which of the three out-of-control criteria lead to rejection of a statistically stable mean.
s shown below. Determine whether the process mean is within statistical control. If it isnot, identify which of the three out-of-control criteria lead to rejection of a statistically stable mean.
Unlock Deck
Unlock for access to all 90 flashcards in this deck.
Unlock Deck
k this deck
37
Describe a p chart and give an example. What does it attempt to monitor?
Unlock Deck
Unlock for access to all 90 flashcards in this deck.
Unlock Deck
k this deck
38
________ data are data arranged according to some sequence. They are a measurement of a characteristic or good or services that result from some combination of equipment, people, materials, methods, and conditions.
A) Process
B) Service
C) Material
D) Sequential
A) Process
B) Service
C) Material
D) Sequential
Unlock Deck
Unlock for access to all 90 flashcards in this deck.
Unlock Deck
k this deck
39
Examine the given run chart or control chart and determine whether the process is within statistical control. If it
is not, identify which of the three out-of-statistical-control criteria apply.
is not, identify which of the three out-of-statistical-control criteria apply.
Unlock Deck
Unlock for access to all 90 flashcards in this deck.
Unlock Deck
k this deck
40
Which of the following is not one of the criteria for determining if a control chart indicates that a process is not statistically stable?
A) Decreasing variation
B) Downward trend
C) Upward shift
D) Exceptional value
A) Decreasing variation
B) Downward trend
C) Upward shift
D) Exceptional value
Unlock Deck
Unlock for access to all 90 flashcards in this deck.
Unlock Deck
k this deck
41
Examine the given run chart or control chart and determine whether the process is within statistical control.
A) The process is within statistical control.
B) The process is not within statistical control.
A) The process is within statistical control.
B) The process is not within statistical control.
Unlock Deck
Unlock for access to all 90 flashcards in this deck.
Unlock Deck
k this deck
42
Which type of chart does not have control limits?
A) x chart
B) p chart
C) R chart
D) Run chart
A) x chart
B) p chart
C) R chart
D) Run chart
Unlock Deck
Unlock for access to all 90 flashcards in this deck.
Unlock Deck
k this deck
43
The centerline for a control chart for R consists of ________.
A) the median
B) the mean of the sample data
C) the standard deviation
D) the mean of the sample ranges
A) the median
B) the mean of the sample data
C) the standard deviation
D) the mean of the sample ranges
Unlock Deck
Unlock for access to all 90 flashcards in this deck.
Unlock Deck
k this deck
44
R charts are used to monitor ________.
A) proportions
B) variation
C) correlation
D) means
A) proportions
B) variation
C) correlation
D) means
Unlock Deck
Unlock for access to all 90 flashcards in this deck.
Unlock Deck
k this deck
45
Unlock Deck
Unlock for access to all 90 flashcards in this deck.
Unlock Deck
k this deck
46
Use the given process data to construct a control chart for p. A candy manufacturer considers a cracked piece of candy to be a defect. Each day 100 candies are randomly selected and checked for cracks. The numbers of defects for 20
Consecutive days are given below. What is the value of the center line?
A) 10
B) 1.32
C) 6.6
D) 0.066
Consecutive days are given below.
What is the value of the center line?A) 10
B) 1.32
C) 6.6
D) 0.066
Unlock Deck
Unlock for access to all 90 flashcards in this deck.
Unlock Deck
k this deck
47
________ variation results from causes that can be identified.
A) Identifiable
B) Assignable
C) Random
D) Definable
A) Identifiable
B) Assignable
C) Random
D) Definable
Unlock Deck
Unlock for access to all 90 flashcards in this deck.
Unlock Deck
k this deck
48
A control chart for s shown below. Determine whether the process mean is within statistical control. If it is
not, identify which of the three out-of-control criteria lead to rejection of a statistically stable mean.
s shown below. Determine whether the process mean is within statistical control. If it isnot, identify which of the three out-of-control criteria lead to rejection of a statistically stable mean.
Unlock Deck
Unlock for access to all 90 flashcards in this deck.
Unlock Deck
k this deck
49
A machine that is supposed to fill small bottles to contain 20 milliliters yields the following data from a test of 4 bottles every hour. What would be the centerline for a control chart for ?
A) 19.935 milliliters
B) 0.380 milliliters
C) 20.000 milliliters
D) 20.212 milliliters
? A) 19.935 milliliters
B) 0.380 milliliters
C) 20.000 milliliters
D) 20.212 milliliters
Unlock Deck
Unlock for access to all 90 flashcards in this deck.
Unlock Deck
k this deck
50
Examine the given run chart or control chart and determine whether the process is within statistical control.
A) The process is within statistical control.
B) The process is not within statistical control.
A) The process is within statistical control.
B) The process is not within statistical control.
Unlock Deck
Unlock for access to all 90 flashcards in this deck.
Unlock Deck
k this deck
51
A manufacturer of lightbulbs picks 10 lightbulbs at random each day for quality control. The mean and range (in hours) of the lifetimes of the 10 lightbulbs are calculated. The results for 12 consecutive days are shown in
The table below. Construct an R chart to determine whether the process is in statistical control.
A) The process is not within statistical control.
B) The process is within statistical control.
The table below. Construct an R chart to determine whether the process is in statistical control.
A) The process is not within statistical control.
B) The process is within statistical control.
Unlock Deck
Unlock for access to all 90 flashcards in this deck.
Unlock Deck
k this deck
52
Which graph using individual data values instead of a process characteristic?
A) R chart
B) Run chart
C)
D) p chart
A) R chart
B) Run chart
C)
D) p chart
Unlock Deck
Unlock for access to all 90 flashcards in this deck.
Unlock Deck
k this deck
53
Use the given process data to construct a control chart for p. A drugstore considers a wait of more than 5 minutes to be a defect. Each week 100 customers are randomly selected and timed at the checkout line. The numbers of defects for
20 consecutive weeks are given below. What is the value of the upper control limit?
A) 0.0622
B) 0.0783
C) 1
D) 6.2
20 consecutive weeks are given below.
What is the value of the upper control limit?A) 0.0622
B) 0.0783
C) 1
D) 6.2
Unlock Deck
Unlock for access to all 90 flashcards in this deck.
Unlock Deck
k this deck
54
A control chart for is shown below. Determine whether the process mean is within statistical control. If it is
not, identify which of the three out-of-control criteria lead to rejection of a statistically stable mean.
is shown below. Determine whether the process mean is within statistical control. If it isnot, identify which of the three out-of-control criteria lead to rejection of a statistically stable mean.
Unlock Deck
Unlock for access to all 90 flashcards in this deck.
Unlock Deck
k this deck
55
Examine the given run chart or control chart and determine whether the process is within statistical control.
A) The process is within statistical control.
B) The process is not within statistical control.
A) The process is within statistical control.
B) The process is not within statistical control.
Unlock Deck
Unlock for access to all 90 flashcards in this deck.
Unlock Deck
k this deck
56
Examine the given run chart or control chart and determine whether the process is within statistical control.
A) The process is within statistical control.
B) The process is not within statistical control.
A) The process is within statistical control.
B) The process is not within statistical control.
Unlock Deck
Unlock for access to all 90 flashcards in this deck.
Unlock Deck
k this deck
57
A ________ is a sequential plot of individual data values over time. One axis is used for the data values, and the other axis is used for the time sequence.
A) flow chart
B) run chart
C) process chart
D) time-process chart
A) flow chart
B) run chart
C) process chart
D) time-process chart
Unlock Deck
Unlock for access to all 90 flashcards in this deck.
Unlock Deck
k this deck
58
A machine is supposed to fill boxes to a weight of 50 pounds. Every 30 minutes a sample of four boxes is tested; the results are given below.
What would be the value of the centerline that would be used in creating an R chart?
A) 11.000 pounds
B) 12.8000 pounds
C) 50 pounds
D) 49.567 pounds
What would be the value of the centerline that would be used in creating an R chart?
A) 11.000 pounds
B) 12.8000 pounds
C) 50 pounds
D) 49.567 pounds
Unlock Deck
Unlock for access to all 90 flashcards in this deck.
Unlock Deck
k this deck
59
Which type of chart would be best for monitoring the proportion of items that are defective?
A) p chart
B) Run chart
C)
D) R chart
A) p chart
B) Run chart
C)
D) R chart
Unlock Deck
Unlock for access to all 90 flashcards in this deck.
Unlock Deck
k this deck
60
A run chart for individual values is shown below. Does there appear to be a pattern suggesting that the process
is not within statistical control? If so, describe the pattern.
is not within statistical control? If so, describe the pattern.
Unlock Deck
Unlock for access to all 90 flashcards in this deck.
Unlock Deck
k this deck
61
A machine is supposed to fill boxes to a weight of 50 pounds. Every 30 minutes a sample of four boxes is tested;
the results are given below.
the results are given below.
Unlock Deck
Unlock for access to all 90 flashcards in this deck.
Unlock Deck
k this deck
62
A machine that is supposed to fill small bottles to contain 20 milliliters yields the following data from a test of 4
bottles every hour.
bottles every hour.
Unlock Deck
Unlock for access to all 90 flashcards in this deck.
Unlock Deck
k this deck
63
A machine that is supposed to fill small bottles to contain 20 milliliters yields the following data from a test of 4
bottles every hour.
bottles every hour.
Unlock Deck
Unlock for access to all 90 flashcards in this deck.
Unlock Deck
k this deck
64
A control chart for is shown below. Determine whether the process mean is within statistical control. If it is
not, identify which of the three out-of-control criteria lead to rejection of a statistically stable mean.
is shown below. Determine whether the process mean is within statistical control. If it isnot, identify which of the three out-of-control criteria lead to rejection of a statistically stable mean.
Unlock Deck
Unlock for access to all 90 flashcards in this deck.
Unlock Deck
k this deck
65
A machine is supposed to fill boxes to a weight of 50 pounds. Every 30 minutes a sample of four boxes is tested;
the results are given below.
the results are given below.
Unlock Deck
Unlock for access to all 90 flashcards in this deck.
Unlock Deck
k this deck
66
A control chart for monitoring variation and center can be based on standard deviations instead of on ranges.
An s chart for monitoring variation is made by plotting sample standard deviations with a centerline at (the
mean of the sample standard deviations) and control limits at , where are found in the
Control Chart Constants table. Construct an s chart for the data below.
A manufacturer of lightbulbs picks 10 lightbulbs at random each day for quality control. The mean, standard
deviation, and range (in hours) of the lifetimes of the 10 lightbulbs are calculated. The results for 12 consecutive
days are shown in the table below.
An s chart for monitoring variation is made by plotting sample standard deviations with a centerline at
(themean of the sample standard deviations) and control limits at
, where are found in theControl Chart Constants table. Construct an s chart for the data below.
A manufacturer of lightbulbs picks 10 lightbulbs at random each day for quality control. The mean, standard
deviation, and range (in hours) of the lifetimes of the 10 lightbulbs are calculated. The results for 12 consecutive
days are shown in the table below.
Unlock Deck
Unlock for access to all 90 flashcards in this deck.
Unlock Deck
k this deck
67
A run chart for individual values is shown below. Does there appear to be a pattern suggesting that the process
is not within statistical control? If so, describe the pattern.
is not within statistical control? If so, describe the pattern.
Unlock Deck
Unlock for access to all 90 flashcards in this deck.
Unlock Deck
k this deck
68
A machine is supposed to fill cans that contain 12 ounces. Each hour, a sample of four cans is tested; the results
of 15 consecutive hours are given below.
of 15 consecutive hours are given below.
Unlock Deck
Unlock for access to all 90 flashcards in this deck.
Unlock Deck
k this deck
69
A machine that is supposed to produce ball bearings with a diameter of 7 millimeters yields the following data
from a test of 5 ball bearings every 20 minutes.
from a test of 5 ball bearings every 20 minutes.
Unlock Deck
Unlock for access to all 90 flashcards in this deck.
Unlock Deck
k this deck
70
A machine is supposed to fill boxes to a weight of 50 pounds. Every 30 minutes a sample of four boxes is tested;
the results are given below.
the results are given below.
Unlock Deck
Unlock for access to all 90 flashcards in this deck.
Unlock Deck
k this deck
71
A control chart for R is shown below. Determine whether the process variation is within statistical control. If it
is not, identify which of the three out-of-control criteria lead to rejection of statistically stable variation.
is not, identify which of the three out-of-control criteria lead to rejection of statistically stable variation.
Unlock Deck
Unlock for access to all 90 flashcards in this deck.
Unlock Deck
k this deck
72
A machine that is supposed to fill small bottles to contain 20 milliliters yields the following data from a test of 4
bottles every hour.
bottles every hour.
Unlock Deck
Unlock for access to all 90 flashcards in this deck.
Unlock Deck
k this deck
73
A machine is supposed to fill cans that contain 12 ounces. Each hour, a sample of four cans is tested; the results
of 15 consecutive hours are given below.
of 15 consecutive hours are given below.
Unlock Deck
Unlock for access to all 90 flashcards in this deck.
Unlock Deck
k this deck
74
A machine that is supposed to produce ball bearings with a diameter of 7 millimeters yields the following data
from a test of 5 ball bearings every 20 minutes.
from a test of 5 ball bearings every 20 minutes.
Unlock Deck
Unlock for access to all 90 flashcards in this deck.
Unlock Deck
k this deck
75
A run chart for individual values is shown below. Does there appear to be a pattern suggesting that the process
is not within statistical control? If so, describe the pattern.
is not within statistical control? If so, describe the pattern.
Unlock Deck
Unlock for access to all 90 flashcards in this deck.
Unlock Deck
k this deck
76
A machine that is supposed to produce ball bearings with a diameter of 7 millimeters yields the following data
from a test of 5 ball bearings every 20 minutes.
from a test of 5 ball bearings every 20 minutes.
Unlock Deck
Unlock for access to all 90 flashcards in this deck.
Unlock Deck
k this deck
77
A machine is supposed to fill cans that contain 12 ounces. Each hour, a sample of four cans is tested; the results
of 15 consecutive hours are given below.
of 15 consecutive hours are given below.
Unlock Deck
Unlock for access to all 90 flashcards in this deck.
Unlock Deck
k this deck
78
A control chart for R is shown below. Determine whether the process variation is within statistical control. If it
is not, identify which of the three out-of-control criteria lead to rejection of statistically stable variation.
is not, identify which of the three out-of-control criteria lead to rejection of statistically stable variation.
Unlock Deck
Unlock for access to all 90 flashcards in this deck.
Unlock Deck
k this deck
79
A control chart for is shown below. Determine whether the process mean is within statistical control. If it is
not, identify which of the three out-of-control criteria lead to rejection of a statistically stable mean.
is shown below. Determine whether the process mean is within statistical control. If it isnot, identify which of the three out-of-control criteria lead to rejection of a statistically stable mean.
Unlock Deck
Unlock for access to all 90 flashcards in this deck.
Unlock Deck
k this deck
80
A manufacturer monitors the level of defects in the television sets that it produces. Each week, 200 television
sets are randomly selected and tested and the number of defects is recorded. The results for 12 consecutive
weeks are shown below.
sets are randomly selected and tested and the number of defects is recorded. The results for 12 consecutive
weeks are shown below.
Unlock Deck
Unlock for access to all 90 flashcards in this deck.
Unlock Deck
k this deck
Unlock Deck
Unlock for access to all 90 flashcards in this deck.


