Deck 3: Using Supply and Demand to Analyze Markets
Full screen (f)
Question
Deadweight loss can be calculated as:
A)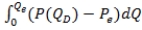 , where Qe and Pe are the equilibrium quantity and price, respectively, and P(QD) is the inverse demand curve.
B)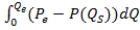 , where Qe and Pe are the equilibrium quantity and price, respectively, and P(QS) is the inverse supply curve.
C)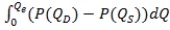 , where Qe is the quantity that would occur in a free-market equilibrium and P(QD) and P(QS) are inverse demand and supply, respectively.
D) , where Qa denotes actual quantity, Qe is the quantity that would occur in a free-market equilibrium, and P(QD) and P(QS) are inverse demand and supply, respectively.
A)
, where Qe and Pe are the equilibrium quantity and price, respectively, and P(QD) is the inverse demand curve.B)
, where Qe and Pe are the equilibrium quantity and price, respectively, and P(QS) is the inverse supply curve.C)
, where Qe is the quantity that would occur in a free-market equilibrium and P(QD) and P(QS) are inverse demand and supply, respectively.D)
, where Qa denotes actual quantity, Qe is the quantity that would occur in a free-market equilibrium, and P(QD) and P(QS) are inverse demand and supply, respectively. Question
(Figure: Market for Tickets II) Before the tax, producers receive the price ____ and after the tax, producers receive the price ____. 
A) $5.50; $6.00
B) $5.50; $5.00
C) $6.00; $5.00
D) $5.00; $6.00
A) $5.50; $6.00
B) $5.50; $5.00
C) $6.00; $5.00
D) $5.00; $6.00
Question
(Figure: Market for Good X II) Before the subsidy, producer surplus is ____ and after the subsidy, producer surplus is ____. 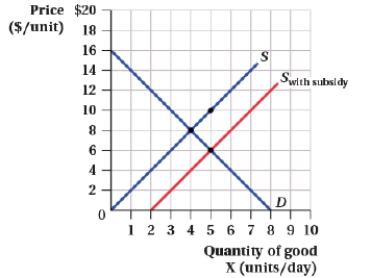
A) $25.00; $16.00
B) $32.00; $50.00
C) $16.00; $25.00
D) $32.00; $30.00
A) $25.00; $16.00
B) $32.00; $50.00
C) $16.00; $25.00
D) $32.00; $30.00
Question
(Figure: Price and Quantity IV) Suppose the government mandates a price ceiling of $8 per pound. Consumer surplus: 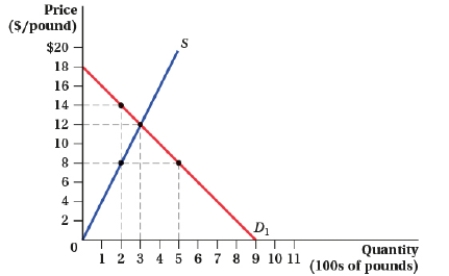
A) increases by $700.
B) increases by $800.
C) increases by $300.
D) decreases by $150.
A) increases by $700.
B) increases by $800.
C) increases by $300.
D) decreases by $150.
Question
Question
(Figure: Market for Tickets II) The size of the tax is: 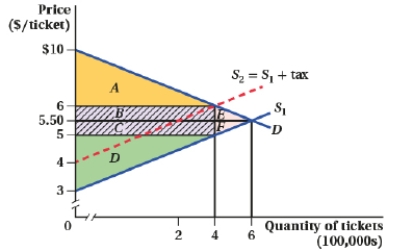
A) $1.00.
B) $0.50.
C) $4.00.
D) $2.00.
A) $1.00.
B) $0.50.
C) $4.00.
D) $2.00.
Question
(Figure: Market for Tickets II) The government tax revenue is:

A) B + E.
B) B + C + E + F.
C) E + F.
D) B + C.
A) B + E.
B) B + C + E + F.
C) E + F.
D) B + C.
Question
Consumer surplus can be calculated as:
A) , where Qe and Pe are the equilibrium quantity and price, respectively, and P(QD) is the inverse demand curve.
B) , where Qe and Pe are the equilibrium quantity and price, respectively, and P(QS) is the inverse supply curve.
C) , where Qe is the quantity that would occur in free-market equilibrium and P(QD) and P(QS) are inverse demand and supply, respectively.
D) , where Qa denotes actual quantity, Qe is the quantity that would occur in free-market equilibrium, and P(QD) and P(QS) are inverse demand and supply, respectively.
A)
, where Qe and Pe are the equilibrium quantity and price, respectively, and P(QD) is the inverse demand curve.B)
, where Qe and Pe are the equilibrium quantity and price, respectively, and P(QS) is the inverse supply curve.C)
, where Qe is the quantity that would occur in free-market equilibrium and P(QD) and P(QS) are inverse demand and supply, respectively.D)
, where Qa denotes actual quantity, Qe is the quantity that would occur in free-market equilibrium, and P(QD) and P(QS) are inverse demand and supply, respectively. Question
Question
(Figure: Price and Quantity V) For demand curve D1, the level of consumer surplus at a price of $40 is: 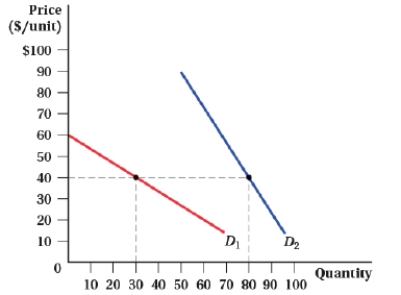
A) $600.
B) $300.
C) $1200.
D) $10.
A) $600.
B) $300.
C) $1200.
D) $10.
Question
Question
Question
Question
Question
Question
Question
(Figure: Market for Good X II) The total cost of the subsidy for the government is ____. 
A) $2.00
B) $10.00
C) $20.00
D) $16.00
A) $2.00
B) $10.00
C) $20.00
D) $16.00
Question
Question
Question
(Figure: Market for Magazines I) The supply equation in the adult magazine market is given by QS = 2P - 4, where P is the price per magazine and Q measures the number of magazines in thousands. Which supply curve reflects a government quota of 6,000 magazines? 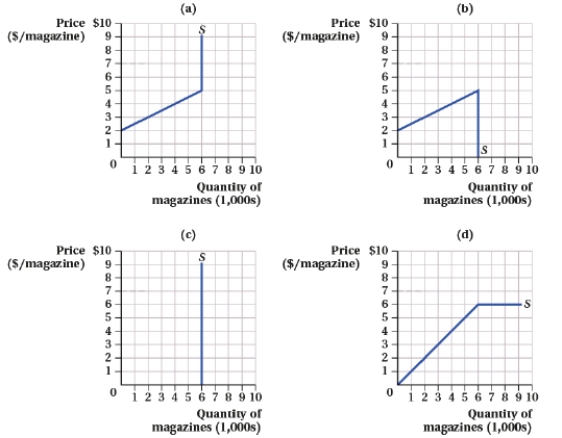
A) Panel (a)
B) Panel (b)
C) Panel (c)
D) Panel (d)
A) Panel (a)
B) Panel (b)
C) Panel (c)
D) Panel (d)
Question
(Figure: Market for Snow Blowers I) Which of the following statements is (are) TRUE? 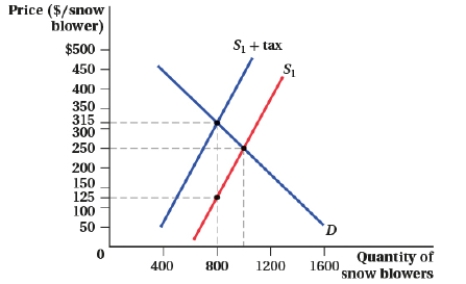 I. The price sellers receive after tax is $250.
II) With the tax, consumers pay $315 per snow blower.
III) The government collects $200,000 in tax revenue.
A) I and III
B) II and III
C) II
D) I, II, and III
I. The price sellers receive after tax is $250.II) With the tax, consumers pay $315 per snow blower.
III) The government collects $200,000 in tax revenue.
A) I and III
B) II and III
C) II
D) I, II, and III
Question
Question
(Figure: Market for Good X II) The deadweight loss when providing the subsidy is ____. 
A) $2.00
B) $4.00
C) $20.00
D) $16.00
A) $2.00
B) $4.00
C) $20.00
D) $16.00
Question
(Figure: Market for Asparagus I) Relative to the initial market equilibrium, at a price ceiling of $2, what is the amount of surplus transferred from producers to consumers? 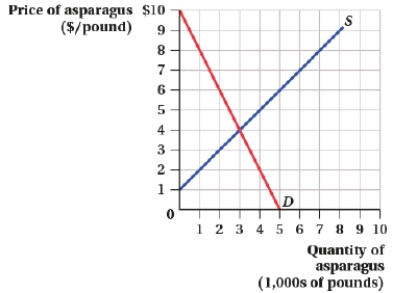
A) $4,000
B) $2,000
C) $1,000
D) $500
A) $4,000
B) $2,000
C) $1,000
D) $500
Question
Question
(Figure: Market for Comic Books I) The quota at S2 causes producer surplus to: 
A) decrease from $12 to $2.
B) decrease from $8 to $2.
C) increase from $8 to $12.
D) increase from $8 to $10.
A) decrease from $12 to $2.
B) decrease from $8 to $2.
C) increase from $8 to $12.
D) increase from $8 to $10.
Question
Question
Question
Question
Question
Question
Question
Question
(Figure: Price and Quantity VII) The area that represents the deadweight loss from the change in demand from D1 to D2 is: 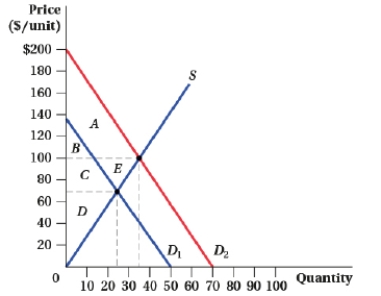
A) There is no deadweight loss.
B) A + E.
C) B + C.
D) D.
A) There is no deadweight loss.
B) A + E.
C) B + C.
D) D.
Question
(Figure: Market for Ammunition I) Assuming the government implements the quota of 200 boxes/week, the producer surplus is: 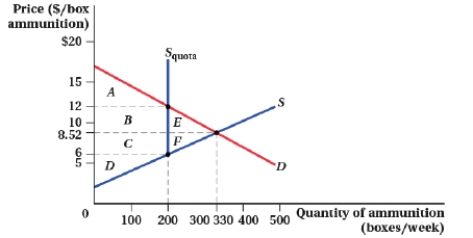
A) A + B + E.
B) D.
C) C + D + F.
D) B + C + D.
A) A + B + E.
B) D.
C) C + D + F.
D) B + C + D.
Question
(Figure: Market for Tickets I) Which of the following statements is (are) TRUE? 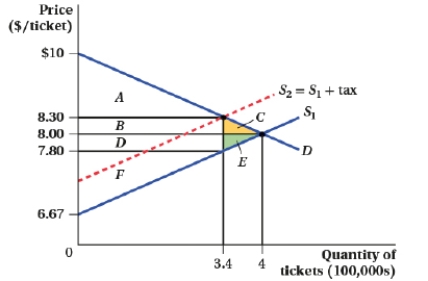 I. Consumer surplus after the tax is area A + B.
II) Producer surplus before the tax is D + E + F.
III) Consumer surplus before the tax is A + C + E.
IV) The size of the tax is $0.50, raising $170,000 in tax revenue.
A) I and II
B) II, III, and IV
C) IV
D) II and IV
I. Consumer surplus after the tax is area A + B.II) Producer surplus before the tax is D + E + F.
III) Consumer surplus before the tax is A + C + E.
IV) The size of the tax is $0.50, raising $170,000 in tax revenue.
A) I and II
B) II, III, and IV
C) IV
D) II and IV
Question
Producer surplus can be calculated as:
A) , where Qe and Pe are the equilibrium quantity and price, respectively, and P(QD) is the inverse demand curve.
B) , where Qe and Pe are the equilibrium quantity and price, respectively, and P(QS) is the inverse supply curve.
C) , where Qe is the quantity that would occur in free-market equilibrium and P(QD) and P(QS) are inverse demand and supply, respectively.
D) , where Qa denotes actual quantity, Qe is the quantity that would occur in free-market equilibrium, and P(QD) and P(QS) are inverse demand and supply, respectively.
A)
, where Qe and Pe are the equilibrium quantity and price, respectively, and P(QD) is the inverse demand curve.B)
, where Qe and Pe are the equilibrium quantity and price, respectively, and P(QS) is the inverse supply curve.C)
, where Qe is the quantity that would occur in free-market equilibrium and P(QD) and P(QS) are inverse demand and supply, respectively.D)
, where Qa denotes actual quantity, Qe is the quantity that would occur in free-market equilibrium, and P(QD) and P(QS) are inverse demand and supply, respectively. Question
Question
(Figure: Market for Enplanements) From the year 2000 to 2001, the demand curve for air travel shifted inward, from D2000 to D2001. In 2000, the equilibrium price and quantity were $122.22 and 148.9 million enplanements, respectively. In 2001, the equilibrium price and quantity fell to $104.82 and 123.6 million enplanements, respectively. The loss in producer surplus attributable to the decrease in demand is equal to area: 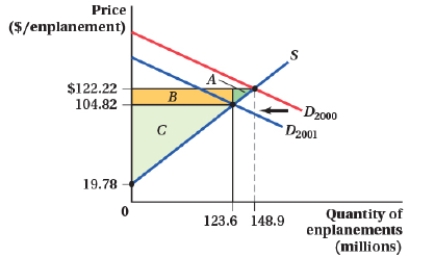
A) A.
B) A + B.
C) B + C.
D) B.
A) A.
B) A + B.
C) B + C.
D) B.
Question
(Figure: Market for Snow Blowers I) The size of the tax is: 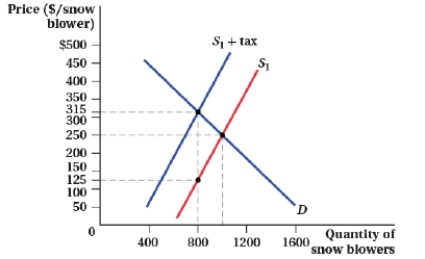
A) $125.
B) $65.
C) $190.
D) $200.
A) $125.
B) $65.
C) $190.
D) $200.
Question
(Figure: Price and Quantity VII) The area that represents consumer surplus with the demand curve D1 is _____, and the area that represents consumer surplus with the demand curve D2 is ____. 
A) B; A + B
B) A + B; B + C
C) B + C; A + B + C + E
D) B + C; A + B
A) B; A + B
B) A + B; B + C
C) B + C; A + B + C + E
D) B + C; A + B
Question
Question
Question
Question
Question
Question
(Figure: Price and Quantity IV) At a price ceiling of $8, there is a shortage of _____ and a deadweight loss of _____. 
A) 200 pounds; $1,200
B) 500 pounds; $400
C) 300 pounds; $600
D) 300 pounds; $300
A) 200 pounds; $1,200
B) 500 pounds; $400
C) 300 pounds; $600
D) 300 pounds; $300
Question
Question
(Figure: Market for Peanuts II) At a price floor of $750, there is an excess supply of _____ tons of peanuts. 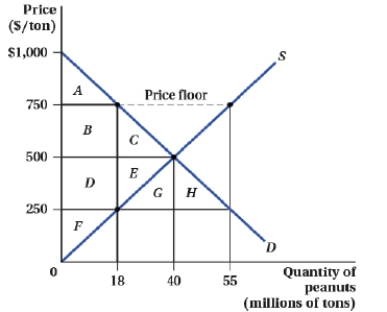
A) 18 million
B) 12 million
C) 15 million
D) 37 million
A) 18 million
B) 12 million
C) 15 million
D) 37 million
Question
Question
Question
Question
(Figure: Price and Quantity II) The outward shift of the supply curve will cause consumer surplus to increase from area _____ to area _____. 
A) A + B; C + D
B) A + B; A + B + C + D + E + F
C) B + C; F
D) A; A + B + C + D
A) A + B; C + D
B) A + B; A + B + C + D + E + F
C) B + C; F
D) A; A + B + C + D
Question
(Figure: Market for Peanuts II) If the government mandates a price floor of $750, the area of consumer surplus: 
A) increases from A to A + B + C.
B) decreases from A + B + C to A.
C) increases from A to B + C.
D) decreases from B + C to A.
A) increases from A to A + B + C.
B) decreases from A + B + C to A.
C) increases from A to B + C.
D) decreases from B + C to A.
Question
Question
Question
(Figure: Price and Quantity III) An increase in demand caused consumer surplus to change from _____ to _____. 
A) $16,000; $36,000
B) $8,000; $18,000
C) $8,000; $12,000
D) $4,000; $9,000
A) $16,000; $36,000
B) $8,000; $18,000
C) $8,000; $12,000
D) $4,000; $9,000
Question
(Figure: Market for Golf I) The supply of private golf courses is Sprivate golf and the supply of private and public golf courses is Stotal. The government provision of public golf courses reduced the number of rounds per week played on private golf courses by: 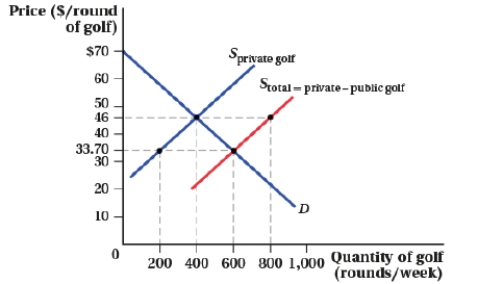
A) 400.
B) 200.
C) 100.
D) 50.
A) 400.
B) 200.
C) 100.
D) 50.
Question
Question
Question
Question
(Figure: Market for Comic Books I) The quota at S2 causes consumer surplus to: 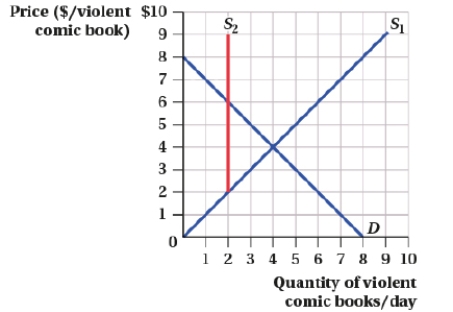
A) increase from $8 to $16.
B) decrease from $8 to $2.
C) decrease from $16 to $12.
D) decrease from $12 to $4.
A) increase from $8 to $16.
B) decrease from $8 to $2.
C) decrease from $16 to $12.
D) decrease from $12 to $4.
Question
Question
(Figure: Market for Peanuts I) Suppose the government enacts a price ceiling of $250 per ton. Which of the following statements are TRUE? 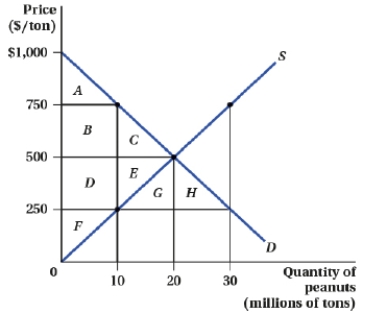 I. Consumer surplus before the price ceiling is area A + B + C.
II) Consumer surplus after the price ceiling is area D + E.
III) Producer surplus before the price ceiling is area D + E + G.
IV) Producer surplus after the price ceiling is area F.
A) I, II, and IV
B) I and IV
C) II and III
D) II, III, and IV
I. Consumer surplus before the price ceiling is area A + B + C.II) Consumer surplus after the price ceiling is area D + E.
III) Producer surplus before the price ceiling is area D + E + G.
IV) Producer surplus after the price ceiling is area F.
A) I, II, and IV
B) I and IV
C) II and III
D) II, III, and IV
Question
Question
Question
(Figure: Market for Tickets II) As a result of the tax, the deadweight loss is:

A) B + E.
B) B + C + E + F.
C) E + F.
D) B + C.
A) B + E.
B) B + C + E + F.
C) E + F.
D) B + C.
Question
(Figure: Price and Quantity VII) The area that represents producer surplus with the demand curve D1 is _____, and the area that represents producer surplus with the demand curve D2 is ____. 
A) D; C + D + E
B) D; D + C
C) C + D + E; D
D) B + C; A + B
A) D; C + D + E
B) D; D + C
C) C + D + E; D
D) B + C; A + B
Question
(Figure: Market for Tickets II) Refer to Figure: Market for Tickets II to answer the following question.  Before the tax, consumer surplus is ____ and after the tax, consumer surplus is ____.
A) A + B + E; A
B) A + B + E; B
C) A + B + C + D +E + F; A + B + C + D
D) A + B + C; A + B + C + D
Before the tax, consumer surplus is ____ and after the tax, consumer surplus is ____.A) A + B + E; A
B) A + B + E; B
C) A + B + C + D +E + F; A + B + C + D
D) A + B + C; A + B + C + D
Question
(Figure: Price and Quantity I) The decrease in supply from S1 to S2 will cause consumer surplus to _____ and producer surplus to _____. 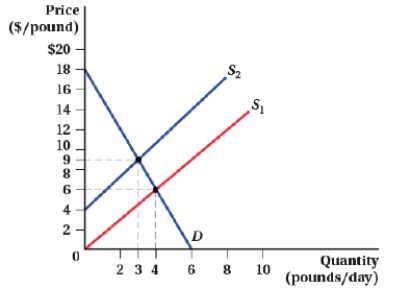
A) decrease by $10.50; decrease by $4.50
B) decrease by $5.50; increase by $3
C) increase by $6; decrease by $18
D) decrease by $10.50; decrease by $6.67
A) decrease by $10.50; decrease by $4.50
B) decrease by $5.50; increase by $3
C) increase by $6; decrease by $18
D) decrease by $10.50; decrease by $6.67
Question
Question
Question
Question
Question
(Figure: Market for Tickets II) Before the tax, consumers pay the price ____ and after the tax, consumers pay the price ____. 
A) $5.50; $6.00
B) $5.50; $6.50
C) $6.00; $5.50
D) $5.00; $6.00
A) $5.50; $6.00
B) $5.50; $6.50
C) $6.00; $5.50
D) $5.00; $6.00
Question
Question
Question
(Figure: Market for Grapefruits I) At a market price of $4, what is total consumer surplus? 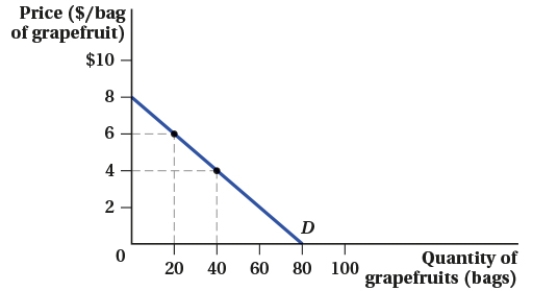
A) $120
B) $320
C) $160
D) $80
A) $120
B) $320
C) $160
D) $80
Question
Question
(Figure: Market for Good X I) Which of the following statements is (are) TRUE? 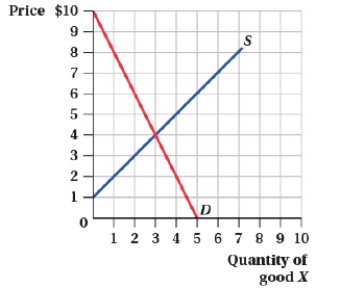 I. A tax on buyers of $3 per unit raises the price buyers pay to $6.
II) A tax on sellers of $3 per unit raises the price buyers pay to $6.
III) With a tax on sellers of $3 per unit, the share of the tax paid by buyers is 67%.
A) I, II, and III
B) I and III
C) II and III
D) I
I. A tax on buyers of $3 per unit raises the price buyers pay to $6.II) A tax on sellers of $3 per unit raises the price buyers pay to $6.
III) With a tax on sellers of $3 per unit, the share of the tax paid by buyers is 67%.
A) I, II, and III
B) I and III
C) II and III
D) I

Unlock Deck
Sign up to unlock the cards in this deck!
Unlock Deck
Unlock Deck
1/146
Play
Full screen (f)
Deck 3: Using Supply and Demand to Analyze Markets
1
Deadweight loss can be calculated as:
A) , where Qe and Pe are the equilibrium quantity and price, respectively, and P(QD) is the inverse demand curve.
B) , where Qe and Pe are the equilibrium quantity and price, respectively, and P(QS) is the inverse supply curve.
C) , where Qe is the quantity that would occur in a free-market equilibrium and P(QD) and P(QS) are inverse demand and supply, respectively.
D) , where Qa denotes actual quantity, Qe is the quantity that would occur in a free-market equilibrium, and P(QD) and P(QS) are inverse demand and supply, respectively.
A)
, where Qe and Pe are the equilibrium quantity and price, respectively, and P(QD) is the inverse demand curve.B)
, where Qe and Pe are the equilibrium quantity and price, respectively, and P(QS) is the inverse supply curve.C)
, where Qe is the quantity that would occur in a free-market equilibrium and P(QD) and P(QS) are inverse demand and supply, respectively.D)
, where Qa denotes actual quantity, Qe is the quantity that would occur in a free-market equilibrium, and P(QD) and P(QS) are inverse demand and supply, respectively.D
2
(Figure: Market for Tickets II) Before the tax, producers receive the price ____ and after the tax, producers receive the price ____.
A) $5.50; $6.00
B) $5.50; $5.00
C) $6.00; $5.00
D) $5.00; $6.00
A) $5.50; $6.00
B) $5.50; $5.00
C) $6.00; $5.00
D) $5.00; $6.00
B
3
(Figure: Market for Good X II) Before the subsidy, producer surplus is ____ and after the subsidy, producer surplus is ____.
A) $25.00; $16.00
B) $32.00; $50.00
C) $16.00; $25.00
D) $32.00; $30.00
A) $25.00; $16.00
B) $32.00; $50.00
C) $16.00; $25.00
D) $32.00; $30.00
C
4
(Figure: Price and Quantity IV) Suppose the government mandates a price ceiling of $8 per pound. Consumer surplus:
A) increases by $700.
B) increases by $800.
C) increases by $300.
D) decreases by $150.
A) increases by $700.
B) increases by $800.
C) increases by $300.
D) decreases by $150.
Unlock Deck
Unlock for access to all 146 flashcards in this deck.
Unlock Deck
k this deck
5
The demand and supply of pickles are given by QD = 300 - 500P and QS = 400P - 150, where P is the price per pickle and Q measures the quantity of pickles in millions. Suppose the government creates a subsidy of $0.25 per pickle. Which of the following statements are TRUE?
I) Without the subsidy, the equilibrium quantity of pickles is 75 million.
II) With the subsidy, consumers pay 38.9 cents per pickle.
III) With the subsidy, producers receive 75 cents per pickle.
IV) With the subsidy, the equilibrium quantity of pickles is greater than 100 million.
A) II, III, and IV
B) I and III
C) II and IV
D) I, III, and IV
Unlock Deck
Unlock for access to all 146 flashcards in this deck.
Unlock Deck
k this deck
6
(Figure: Market for Tickets II) The size of the tax is:
A) $1.00.
B) $0.50.
C) $4.00.
D) $2.00.
A) $1.00.
B) $0.50.
C) $4.00.
D) $2.00.
Unlock Deck
Unlock for access to all 146 flashcards in this deck.
Unlock Deck
k this deck
7
(Figure: Market for Tickets II) The government tax revenue is:
A) B + E.
B) B + C + E + F.
C) E + F.
D) B + C.
A) B + E.
B) B + C + E + F.
C) E + F.
D) B + C.
Unlock Deck
Unlock for access to all 146 flashcards in this deck.
Unlock Deck
k this deck
8
Consumer surplus can be calculated as:
A) , where Qe and Pe are the equilibrium quantity and price, respectively, and P(QD) is the inverse demand curve.
B) , where Qe and Pe are the equilibrium quantity and price, respectively, and P(QS) is the inverse supply curve.
C) , where Qe is the quantity that would occur in free-market equilibrium and P(QD) and P(QS) are inverse demand and supply, respectively.
D) , where Qa denotes actual quantity, Qe is the quantity that would occur in free-market equilibrium, and P(QD) and P(QS) are inverse demand and supply, respectively.
A)
, where Qe and Pe are the equilibrium quantity and price, respectively, and P(QD) is the inverse demand curve.B)
, where Qe and Pe are the equilibrium quantity and price, respectively, and P(QS) is the inverse supply curve.C)
, where Qe is the quantity that would occur in free-market equilibrium and P(QD) and P(QS) are inverse demand and supply, respectively.D)
, where Qa denotes actual quantity, Qe is the quantity that would occur in free-market equilibrium, and P(QD) and P(QS) are inverse demand and supply, respectively. Unlock Deck
Unlock for access to all 146 flashcards in this deck.
Unlock Deck
k this deck
9
If the government subsidizes a product, what is the relationship between the price that buyers pay (PB) and the price that sellers receive (PS)?
A) PB + subsidy = PS
B) PB + PS = subsidy
C) PB = PS + subsidy
D) PB (1 + subsidy) = PS
A) PB + subsidy = PS
B) PB + PS = subsidy
C) PB = PS + subsidy
D) PB (1 + subsidy) = PS
Unlock Deck
Unlock for access to all 146 flashcards in this deck.
Unlock Deck
k this deck
10
(Figure: Price and Quantity V) For demand curve D1, the level of consumer surplus at a price of $40 is:
A) $600.
B) $300.
C) $1200.
D) $10.
A) $600.
B) $300.
C) $1200.
D) $10.
Unlock Deck
Unlock for access to all 146 flashcards in this deck.
Unlock Deck
k this deck
11
To calculate producer surplus:
A) integrate the area under the demand curve and above the equilibrium price.
B) integrate the area under the demand curve and above the supply curve.
C) integrate the area under the equilibrium price and above the supply curve.
D) integrate the area under the supply curve.
A) integrate the area under the demand curve and above the equilibrium price.
B) integrate the area under the demand curve and above the supply curve.
C) integrate the area under the equilibrium price and above the supply curve.
D) integrate the area under the supply curve.
Unlock Deck
Unlock for access to all 146 flashcards in this deck.
Unlock Deck
k this deck
12
The demand for a good is given by QD = 750 - 0.4P. What is consumer surplus at a price of $80?
A) $644,405
B) $57,440
C) $1,875
D) $71,800
A) $644,405
B) $57,440
C) $1,875
D) $71,800
Unlock Deck
Unlock for access to all 146 flashcards in this deck.
Unlock Deck
k this deck
13
The market for organic cabbage is represented by QD = 1,200 - 75P and QS = 425P - 300, where P is the price per head of cabbage and Q measures the number of heads of cabbage per week. Suppose the price of organic fertilizer falls, making sellers willing to sell 100 more heads of cabbage per week at every price. What happens to producer and consumer surplus as a result of this change?
A) Consumer surplus increases by $196.50, and producer surplus increases by $36.97.
B) Consumer surplus increases by $196.50, and producer surplus increases by $42.37.
C) Consumer surplus remains unchanged, but producer surplus increases by $93.02.
D) Consumer surplus increases by $296.50, and producer surplus increases by $36.97.
Unlock Deck
Unlock for access to all 146 flashcards in this deck.
Unlock Deck
k this deck
14
The deadweight loss (owing to a price ceiling) increases as demand becomes more _____ and supply becomes more _____.
A) inelastic; inelastic
B) elastic; inelastic
C) elastic; elastic
D) inelastic; elastic
A) inelastic; inelastic
B) elastic; inelastic
C) elastic; elastic
D) inelastic; elastic
Unlock Deck
Unlock for access to all 146 flashcards in this deck.
Unlock Deck
k this deck
15
In the market for cotton, the quantity demanded and quantity supplied are expressed mathematically as QD = 400 - 250P and QS = 250P - 100, where P is the price per pound of cotton and Q measures pounds of cotton. Suppose the government sets a price ceiling of $0.50 per pound of cotton. The consumer surplus with the price ceiling is:
A) $22.
B) $26.25.
C) $28.
D) $1.25.
A) $22.
B) $26.25.
C) $28.
D) $1.25.
Unlock Deck
Unlock for access to all 146 flashcards in this deck.
Unlock Deck
k this deck
16
The demand and supply of movie tickets are given by QD = 30 - 3P and QS = 4P - 19, where P is the price per ticket and Q is in thousands of tickets. If the government places a $1 tax on each ticket, the prices that consumers pay with and without the tax are _____ and _____, respectively.
A) $8; $7
B) $7.57; $7
C) $7.50; $6.50
D) $4.30; $3.80
A) $8; $7
B) $7.57; $7
C) $7.50; $6.50
D) $4.30; $3.80
Unlock Deck
Unlock for access to all 146 flashcards in this deck.
Unlock Deck
k this deck
17
(Figure: Market for Good X II) The total cost of the subsidy for the government is ____.
A) $2.00
B) $10.00
C) $20.00
D) $16.00
A) $2.00
B) $10.00
C) $20.00
D) $16.00
Unlock Deck
Unlock for access to all 146 flashcards in this deck.
Unlock Deck
k this deck
18
In the market for cotton, the quantity demanded and quantity supplied are expressed mathematically as QD = 400 - 250P and QS = 250P - 100, where P is the price per pound of cotton and Q measures pounds of cotton. Suppose the government sets a price ceiling of $0.50 per pound of cotton. The producer surplus with the price ceiling is:
A) $26.25.
B) $12.
C) $6.25.
D) $1.25.
A) $26.25.
B) $12.
C) $6.25.
D) $1.25.
Unlock Deck
Unlock for access to all 146 flashcards in this deck.
Unlock Deck
k this deck
19
At the equilibrium price of $10, the elasticity of demand and supply are -0.9 and 1.10. If the government institutes a tax of $1 per unit, sellers will receive _____ and consumers will pay _____.
A) $9.55; $10.55
B) $10.25; $11.25
C) $9.80; $10.80
D) $9.75; $10.75
A) $9.55; $10.55
B) $10.25; $11.25
C) $9.80; $10.80
D) $9.75; $10.75
Unlock Deck
Unlock for access to all 146 flashcards in this deck.
Unlock Deck
k this deck
20
(Figure: Market for Magazines I) The supply equation in the adult magazine market is given by QS = 2P - 4, where P is the price per magazine and Q measures the number of magazines in thousands. Which supply curve reflects a government quota of 6,000 magazines?
A) Panel (a)
B) Panel (b)
C) Panel (c)
D) Panel (d)
A) Panel (a)
B) Panel (b)
C) Panel (c)
D) Panel (d)
Unlock Deck
Unlock for access to all 146 flashcards in this deck.
Unlock Deck
k this deck
21
(Figure: Market for Snow Blowers I) Which of the following statements is (are) TRUE? I. The price sellers receive after tax is $250.
II) With the tax, consumers pay $315 per snow blower.
III) The government collects $200,000 in tax revenue.
A) I and III
B) II and III
C) II
D) I, II, and III
I. The price sellers receive after tax is $250.II) With the tax, consumers pay $315 per snow blower.
III) The government collects $200,000 in tax revenue.
A) I and III
B) II and III
C) II
D) I, II, and III
Unlock Deck
Unlock for access to all 146 flashcards in this deck.
Unlock Deck
k this deck
22
In a small country, the demand and supply of kidneys are represented by QD = 10,000 - 0.25P and QS = 0.5P + 4,000. Which of the following statements is (are) TRUE?
I) The equilibrium price is $8,000.
II) At a price ceiling of $0, there are 4,000 volunteer donors.
III) At a price ceiling of $0, there is an excess demand of 14,000 kidneys.
A) I, II, and III
B) II and III (because the demand curve shifts out, pushing up the price)
C) I and II
D) III
I) The equilibrium price is $8,000.
II) At a price ceiling of $0, there are 4,000 volunteer donors.
III) At a price ceiling of $0, there is an excess demand of 14,000 kidneys.
A) I, II, and III
B) II and III (because the demand curve shifts out, pushing up the price)
C) I and II
D) III
Unlock Deck
Unlock for access to all 146 flashcards in this deck.
Unlock Deck
k this deck
23
(Figure: Market for Good X II) The deadweight loss when providing the subsidy is ____.
A) $2.00
B) $4.00
C) $20.00
D) $16.00
A) $2.00
B) $4.00
C) $20.00
D) $16.00
Unlock Deck
Unlock for access to all 146 flashcards in this deck.
Unlock Deck
k this deck
24
(Figure: Market for Asparagus I) Relative to the initial market equilibrium, at a price ceiling of $2, what is the amount of surplus transferred from producers to consumers?
A) $4,000
B) $2,000
C) $1,000
D) $500
A) $4,000
B) $2,000
C) $1,000
D) $500
Unlock Deck
Unlock for access to all 146 flashcards in this deck.
Unlock Deck
k this deck
25
In the market for cotton, the quantity demanded and quantity supplied are expressed mathematically as QD = 400 - 250P and QS = 250P - 100, where P is the price per pound of cotton and Q measures pounds of cotton. Suppose the government sets a price ceiling of $0.50 per pound of cotton. As a result of the price ceiling, there is a shortage of:
A) 250 pounds of cotton.
B) 200 pounds of cotton.
C) 150 pounds of cotton.
D) 100 pounds of cotton.
A) 250 pounds of cotton.
B) 200 pounds of cotton.
C) 150 pounds of cotton.
D) 100 pounds of cotton.
Unlock Deck
Unlock for access to all 146 flashcards in this deck.
Unlock Deck
k this deck
26
(Figure: Market for Comic Books I) The quota at S2 causes producer surplus to:
A) decrease from $12 to $2.
B) decrease from $8 to $2.
C) increase from $8 to $12.
D) increase from $8 to $10.
A) decrease from $12 to $2.
B) decrease from $8 to $2.
C) increase from $8 to $12.
D) increase from $8 to $10.
Unlock Deck
Unlock for access to all 146 flashcards in this deck.
Unlock Deck
k this deck
27
Suppose that a minimum price (price floor) is legislated. To calculate producer surplus:
A) integrate the area below the price floor and above the supply curve between zero and the free-market equilibrium price.
B) integrate the area below the price floor and above the supply curve between zero and the quantity resulting from the price floor.
C) integrate the area under the demand curve and above the price floor between zero quantity and the quantity resulting from the price floor.
D) integrate the area under the demand curve and above the supply curve between zero quantity and the quantity resulting from the price floor.
Unlock Deck
Unlock for access to all 146 flashcards in this deck.
Unlock Deck
k this deck
28
To calculate deadweight loss:
A) integrate the area between the demand and supply curves over the range of the difference between zero and the free-market equilibrium quantity.
B) integrate the area between the demand and supply curves over the range of the difference between the quantity corresponding to the choke price and the free-market equilibrium quantity.
C) integrate the area between the demand and supply curves over the range of the difference between zero and the actual quantity.
D) integrate the area between the demand and supply curves over the range of the difference between the actual and free-market equilibrium quantities.
Unlock Deck
Unlock for access to all 146 flashcards in this deck.
Unlock Deck
k this deck
29
All else being equal, a negative supply shock:
A) causes consumer surplus to increase and producer surplus to decrease.
B) causes consumer surplus to decrease and producer surplus to increase.
C) causes both consumer and producer surplus to increase.
D) causes both consumer and producer surplus to decrease.
A) causes consumer surplus to increase and producer surplus to decrease.
B) causes consumer surplus to decrease and producer surplus to increase.
C) causes both consumer and producer surplus to increase.
D) causes both consumer and producer surplus to decrease.
Unlock Deck
Unlock for access to all 146 flashcards in this deck.
Unlock Deck
k this deck
30
In the market for cotton, the quantity demanded and quantity supplied are expressed mathematically as QD = 400 - 250P and QS = 250P - 100, where P is the price per pound of cotton and Q measures pounds of cotton. Suppose the government sets a price ceiling of $0.50 per pound of cotton. The deadweight loss with the price ceiling is:
A) $26.25.
B) $40.00.
C) $62.50.
D) $1.25.
A) $26.25.
B) $40.00.
C) $62.50.
D) $1.25.
Unlock Deck
Unlock for access to all 146 flashcards in this deck.
Unlock Deck
k this deck
31
Suppose that a local government has imposed a quota of 0.5 million gallons on water usage. Before the quota is enforced, the market demand curve is given by
QD = 10 - 2.25P
And the market supply curve is given by
QS = -10 + 2.75P
Where the quantity is measured in millions of gallons per month and the price is in dollars per thousand gallons. After the quota is imposed, the price becomes ____.
A) $4.00
B) $4.22
C) $5.00
D) $5.22
QD = 10 - 2.25P
And the market supply curve is given by
QS = -10 + 2.75P
Where the quantity is measured in millions of gallons per month and the price is in dollars per thousand gallons. After the quota is imposed, the price becomes ____.
A) $4.00
B) $4.22
C) $5.00
D) $5.22
Unlock Deck
Unlock for access to all 146 flashcards in this deck.
Unlock Deck
k this deck
32
Suppose that the demand curve for an advanced technology product for businesses is given by P =10,000 - 4Q3 and supply is P = 2,000 + 4Q3. The consumer surplus at the equilibrium price is ____.
A) $6,000
B) $10
C) $70,000
D) $30,000
A) $6,000
B) $10
C) $70,000
D) $30,000
Unlock Deck
Unlock for access to all 146 flashcards in this deck.
Unlock Deck
k this deck
33
Suppose the demand and supply curves for units of university credits are given by
QD = 5,000 - P
QS = -1,000 + 4P
Where QD is the quantity of credits demanded, QS is the quantity supplied, and P is the price in dollars for each unit. The producer surplus at the equilibrium price is ____.
A) $1,805,000
B) $3,610,000
C) $4,560,000
D) $7,220,000
QD = 5,000 - P
QS = -1,000 + 4P
Where QD is the quantity of credits demanded, QS is the quantity supplied, and P is the price in dollars for each unit. The producer surplus at the equilibrium price is ____.
A) $1,805,000
B) $3,610,000
C) $4,560,000
D) $7,220,000
Unlock Deck
Unlock for access to all 146 flashcards in this deck.
Unlock Deck
k this deck
34
(Figure: Price and Quantity VII) The area that represents the deadweight loss from the change in demand from D1 to D2 is:
A) There is no deadweight loss.
B) A + E.
C) B + C.
D) D.
A) There is no deadweight loss.
B) A + E.
C) B + C.
D) D.
Unlock Deck
Unlock for access to all 146 flashcards in this deck.
Unlock Deck
k this deck
35
(Figure: Market for Ammunition I) Assuming the government implements the quota of 200 boxes/week, the producer surplus is:
A) A + B + E.
B) D.
C) C + D + F.
D) B + C + D.
A) A + B + E.
B) D.
C) C + D + F.
D) B + C + D.
Unlock Deck
Unlock for access to all 146 flashcards in this deck.
Unlock Deck
k this deck
36
(Figure: Market for Tickets I) Which of the following statements is (are) TRUE? I. Consumer surplus after the tax is area A + B.
II) Producer surplus before the tax is D + E + F.
III) Consumer surplus before the tax is A + C + E.
IV) The size of the tax is $0.50, raising $170,000 in tax revenue.
A) I and II
B) II, III, and IV
C) IV
D) II and IV
I. Consumer surplus after the tax is area A + B.II) Producer surplus before the tax is D + E + F.
III) Consumer surplus before the tax is A + C + E.
IV) The size of the tax is $0.50, raising $170,000 in tax revenue.
A) I and II
B) II, III, and IV
C) IV
D) II and IV
Unlock Deck
Unlock for access to all 146 flashcards in this deck.
Unlock Deck
k this deck
37
Producer surplus can be calculated as:
A) , where Qe and Pe are the equilibrium quantity and price, respectively, and P(QD) is the inverse demand curve.
B) , where Qe and Pe are the equilibrium quantity and price, respectively, and P(QS) is the inverse supply curve.
C) , where Qe is the quantity that would occur in free-market equilibrium and P(QD) and P(QS) are inverse demand and supply, respectively.
D) , where Qa denotes actual quantity, Qe is the quantity that would occur in free-market equilibrium, and P(QD) and P(QS) are inverse demand and supply, respectively.
A)
, where Qe and Pe are the equilibrium quantity and price, respectively, and P(QD) is the inverse demand curve.B)
, where Qe and Pe are the equilibrium quantity and price, respectively, and P(QS) is the inverse supply curve.C)
, where Qe is the quantity that would occur in free-market equilibrium and P(QD) and P(QS) are inverse demand and supply, respectively.D)
, where Qa denotes actual quantity, Qe is the quantity that would occur in free-market equilibrium, and P(QD) and P(QS) are inverse demand and supply, respectively. Unlock Deck
Unlock for access to all 146 flashcards in this deck.
Unlock Deck
k this deck
38
The demand and supply of ethanol (a renewable fuel from plant materials) are given by QD = 8,000 - 2,000P and QS = 1,000P - 1,000, where P is price per gallon and Q measures gallons per minute. If the government subsidizes ethanol by $0.30 per gallon, what is the deadweight loss?
A) $30
B) $7,800
C) $440
D) $119
A) $30
B) $7,800
C) $440
D) $119
Unlock Deck
Unlock for access to all 146 flashcards in this deck.
Unlock Deck
k this deck
39
(Figure: Market for Enplanements) From the year 2000 to 2001, the demand curve for air travel shifted inward, from D2000 to D2001. In 2000, the equilibrium price and quantity were $122.22 and 148.9 million enplanements, respectively. In 2001, the equilibrium price and quantity fell to $104.82 and 123.6 million enplanements, respectively. The loss in producer surplus attributable to the decrease in demand is equal to area:
A) A.
B) A + B.
C) B + C.
D) B.
A) A.
B) A + B.
C) B + C.
D) B.
Unlock Deck
Unlock for access to all 146 flashcards in this deck.
Unlock Deck
k this deck
40
(Figure: Market for Snow Blowers I) The size of the tax is:
A) $125.
B) $65.
C) $190.
D) $200.
A) $125.
B) $65.
C) $190.
D) $200.
Unlock Deck
Unlock for access to all 146 flashcards in this deck.
Unlock Deck
k this deck
41
(Figure: Price and Quantity VII) The area that represents consumer surplus with the demand curve D1 is _____, and the area that represents consumer surplus with the demand curve D2 is ____.
A) B; A + B
B) A + B; B + C
C) B + C; A + B + C + E
D) B + C; A + B
A) B; A + B
B) A + B; B + C
C) B + C; A + B + C + E
D) B + C; A + B
Unlock Deck
Unlock for access to all 146 flashcards in this deck.
Unlock Deck
k this deck
42
To calculate consumer surplus for the case when a quota is in place:
A) integrate the area under the demand curve and above the free-market equilibrium price.
B) integrate the area under the demand curve and above the price determined by the market after the quota is in place.
C) integrate the area above the supply curve and under the price determined by the market after the quota is in place.
D) integrate the area under the demand curve and above the supply curve between zero and the quota quantity.
Unlock Deck
Unlock for access to all 146 flashcards in this deck.
Unlock Deck
k this deck
43
Suppose that the demand curve for brown rice is given by P = 50,000 - 3Q2, and supply is P = -10,000 + 3Q2. The consumer surplus at the equilibrium price is ____.
A) $1,000,000
B) $200,000
C) $100,000
D) $2,000,000
A) $1,000,000
B) $200,000
C) $100,000
D) $2,000,000
Unlock Deck
Unlock for access to all 146 flashcards in this deck.
Unlock Deck
k this deck
44
The price elasticity of demand is -1.25, and the share of the tax borne by consumers is 0.80. What is the price elasticity of supply?
A) 6
B) 5
C) 1.56
D) 1
A) 6
B) 5
C) 1.56
D) 1
Unlock Deck
Unlock for access to all 146 flashcards in this deck.
Unlock Deck
k this deck
45
Suppose that last year the equilibrium price and the quantity of good X were $10 and 5 million pounds, respectively. Because of strong demand this year, the equilibrium price and the quantity of good X are $12 and 7 million pounds, respectively. Assuming that the supply curve of good X is linear, producer surplus:
A) increased from $25 million to $42 million.
B) increased from $12.5 million to $24.5 million.
C) increased from $3 million to $7 million.
D) increased from $4.2 million to $5.6 million.
A) increased from $25 million to $42 million.
B) increased from $12.5 million to $24.5 million.
C) increased from $3 million to $7 million.
D) increased from $4.2 million to $5.6 million.
Unlock Deck
Unlock for access to all 146 flashcards in this deck.
Unlock Deck
k this deck
46
Nancy paid $55 for car mats but was willing to pay $80. What is Nancy's consumer surplus?
A) $80
B) $15
C) $25
D) $135
A) $80
B) $15
C) $25
D) $135
Unlock Deck
Unlock for access to all 146 flashcards in this deck.
Unlock Deck
k this deck
47
(Figure: Price and Quantity IV) At a price ceiling of $8, there is a shortage of _____ and a deadweight loss of _____.
A) 200 pounds; $1,200
B) 500 pounds; $400
C) 300 pounds; $600
D) 300 pounds; $300
A) 200 pounds; $1,200
B) 500 pounds; $400
C) 300 pounds; $600
D) 300 pounds; $300
Unlock Deck
Unlock for access to all 146 flashcards in this deck.
Unlock Deck
k this deck
48
Suppose that the demand curve for an advanced technology product for businesses is given by P =10,000 - 4Q3 and supply is P = 2,000 + 4Q3. The equilibrium price is ____ and the equilibrium quantity is ____.
A) $6,000: 10
B) $10; 6,000
C) $70,000; 10
D) $30,000; 20
A) $6,000: 10
B) $10; 6,000
C) $70,000; 10
D) $30,000; 20
Unlock Deck
Unlock for access to all 146 flashcards in this deck.
Unlock Deck
k this deck
49
(Figure: Market for Peanuts II) At a price floor of $750, there is an excess supply of _____ tons of peanuts.
A) 18 million
B) 12 million
C) 15 million
D) 37 million
A) 18 million
B) 12 million
C) 15 million
D) 37 million
Unlock Deck
Unlock for access to all 146 flashcards in this deck.
Unlock Deck
k this deck
50
Suppose that the demand curve for an advanced technology product for businesses is given P =10,000 - 4Q3 and supply is P = 2,000 + 4Q3. The producer surplus at the equilibrium price is ____.
A) $6,000
B) $10
C) $70,000
D) $30,000
A) $6,000
B) $10
C) $70,000
D) $30,000
Unlock Deck
Unlock for access to all 146 flashcards in this deck.
Unlock Deck
k this deck
51
Which of the following supply curves (where P is price per bushel and QS measures number of bushels) generates $64 of producer surplus at a market price of $10 per bushel?
A) QS = 7.5P - 1.5
B) QS = 10P - 3
C) QS = 2P - 4
D) QS = 6P - 8
A) QS = 7.5P - 1.5
B) QS = 10P - 3
C) QS = 2P - 4
D) QS = 6P - 8
Unlock Deck
Unlock for access to all 146 flashcards in this deck.
Unlock Deck
k this deck
52
All else being equal, a demand increase:
A) causes consumer surplus to increase and producer surplus to decrease.
B) causes consumer surplus to decrease and producer surplus to increase.
C) causes both consumer and producer surplus to increase.
D) causes both consumer and producer surplus to decrease.
A) causes consumer surplus to increase and producer surplus to decrease.
B) causes consumer surplus to decrease and producer surplus to increase.
C) causes both consumer and producer surplus to increase.
D) causes both consumer and producer surplus to decrease.
Unlock Deck
Unlock for access to all 146 flashcards in this deck.
Unlock Deck
k this deck
53
(Figure: Price and Quantity II) The outward shift of the supply curve will cause consumer surplus to increase from area _____ to area _____.
A) A + B; C + D
B) A + B; A + B + C + D + E + F
C) B + C; F
D) A; A + B + C + D
A) A + B; C + D
B) A + B; A + B + C + D + E + F
C) B + C; F
D) A; A + B + C + D
Unlock Deck
Unlock for access to all 146 flashcards in this deck.
Unlock Deck
k this deck
54
(Figure: Market for Peanuts II) If the government mandates a price floor of $750, the area of consumer surplus:
A) increases from A to A + B + C.
B) decreases from A + B + C to A.
C) increases from A to B + C.
D) decreases from B + C to A.
A) increases from A to A + B + C.
B) decreases from A + B + C to A.
C) increases from A to B + C.
D) decreases from B + C to A.
Unlock Deck
Unlock for access to all 146 flashcards in this deck.
Unlock Deck
k this deck
55
Suppose that a local government has imposed a quota of 0.5 million gallons on water usage. Before the quota is enforced, the market demand curve is given by
QD = 10 - 2.25P
And the market supply curve is given by
QS = -10 + 2.75P
Where the quantity is measured in millions of gallons per month and the price is in dollars per thousand gallons. The deadweight loss as a result of the quota is ____.
A) $1,000
B) $500,000
C) $1,500
D) $1,605
QD = 10 - 2.25P
And the market supply curve is given by
QS = -10 + 2.75P
Where the quantity is measured in millions of gallons per month and the price is in dollars per thousand gallons. The deadweight loss as a result of the quota is ____.
A) $1,000
B) $500,000
C) $1,500
D) $1,605
Unlock Deck
Unlock for access to all 146 flashcards in this deck.
Unlock Deck
k this deck
56
In the market for used cars, the demand and supply equations are given by QD = 12,000 - 0.4P and QS = 0.1P + 5,000, where P is the price per car and Q measures the quantity of cars. What is the size of the deadweight loss at a price floor of $15,000?
A) $250,000
B) $500,000
C) $750,000
D) $1 million
A) $250,000
B) $500,000
C) $750,000
D) $1 million
Unlock Deck
Unlock for access to all 146 flashcards in this deck.
Unlock Deck
k this deck
57
(Figure: Price and Quantity III) An increase in demand caused consumer surplus to change from _____ to _____.
A) $16,000; $36,000
B) $8,000; $18,000
C) $8,000; $12,000
D) $4,000; $9,000
A) $16,000; $36,000
B) $8,000; $18,000
C) $8,000; $12,000
D) $4,000; $9,000
Unlock Deck
Unlock for access to all 146 flashcards in this deck.
Unlock Deck
k this deck
58
(Figure: Market for Golf I) The supply of private golf courses is Sprivate golf and the supply of private and public golf courses is Stotal. The government provision of public golf courses reduced the number of rounds per week played on private golf courses by:
A) 400.
B) 200.
C) 100.
D) 50.
A) 400.
B) 200.
C) 100.
D) 50.
Unlock Deck
Unlock for access to all 146 flashcards in this deck.
Unlock Deck
k this deck
59
The market for plywood (a sheet of wood used in construction) is characterized by the following demand and supply equations: QD = 800 - 10P and QS = 50P - 1,000, where P is the price per sheet of plywood and Q measures the quantity of plywood. If the government imposes a price ceiling of $25 per sheet of plywood, producer surplus:
A) increases by $892.
B) decreases by $3,750.
C) decreases by $635.
D) decreases by $1,875.
A) increases by $892.
B) decreases by $3,750.
C) decreases by $635.
D) decreases by $1,875.
Unlock Deck
Unlock for access to all 146 flashcards in this deck.
Unlock Deck
k this deck
60
The demand and supply of ethanol (a renewable fuel from plant materials) are given by QD = 8,000 - 2,000P and QS = 1,000P - 1,000, where P is price per gallon and Q measures gallons per minute. What does it cost the government to subsidize ethanol by $0.30 a gallon?
A) $660
B) $14,000
C) $150
D) $2,000
A) $660
B) $14,000
C) $150
D) $2,000
Unlock Deck
Unlock for access to all 146 flashcards in this deck.
Unlock Deck
k this deck
61
If the government quit subsidizing a product, consumer surplus would _____ and producer surplus would _____.
A) increase; decrease
B) decrease; decrease
C) increase; increase
D) decrease; increase
A) increase; decrease
B) decrease; decrease
C) increase; increase
D) decrease; increase
Unlock Deck
Unlock for access to all 146 flashcards in this deck.
Unlock Deck
k this deck
62
(Figure: Market for Comic Books I) The quota at S2 causes consumer surplus to:
A) increase from $8 to $16.
B) decrease from $8 to $2.
C) decrease from $16 to $12.
D) decrease from $12 to $4.
A) increase from $8 to $16.
B) decrease from $8 to $2.
C) decrease from $16 to $12.
D) decrease from $12 to $4.
Unlock Deck
Unlock for access to all 146 flashcards in this deck.
Unlock Deck
k this deck
63
The supply and demand for solar panels are given by QS = 5P - 5,000 and QD = 15,000 - 5P, where P is price per solar panel and Q measures the quantity of solar panels. Suppose the government provides a $500 subsidy per solar panel. Before the subsidy, producers receive ____ and after the subsidy, producers receive ____.
A) $2,000; $1,750
B) $2,000; $2,250
C) $2,250; $2,000
D) $1,750; $2,250
A) $2,000; $1,750
B) $2,000; $2,250
C) $2,250; $2,000
D) $1,750; $2,250
Unlock Deck
Unlock for access to all 146 flashcards in this deck.
Unlock Deck
k this deck
64
(Figure: Market for Peanuts I) Suppose the government enacts a price ceiling of $250 per ton. Which of the following statements are TRUE? I. Consumer surplus before the price ceiling is area A + B + C.
II) Consumer surplus after the price ceiling is area D + E.
III) Producer surplus before the price ceiling is area D + E + G.
IV) Producer surplus after the price ceiling is area F.
A) I, II, and IV
B) I and IV
C) II and III
D) II, III, and IV
I. Consumer surplus before the price ceiling is area A + B + C.II) Consumer surplus after the price ceiling is area D + E.
III) Producer surplus before the price ceiling is area D + E + G.
IV) Producer surplus after the price ceiling is area F.
A) I, II, and IV
B) I and IV
C) II and III
D) II, III, and IV
Unlock Deck
Unlock for access to all 146 flashcards in this deck.
Unlock Deck
k this deck
65
Suppose that a local government has imposed a quota of 0.5 million gallons on water usage. Before the quota is enforced, the market demand curve is given by
QD = 10 - 2.25P
And the market supply curve is given by
QS = -10 + 2.75P
Where the quantity is measured in millions of gallons per month and the price is in dollars per thousand gallons. After the quota is imposed, the quantity demanded becomes ____.
A) 1,000,000
B) 500,000
C) 1,500,000
D) 1,605,000
Unlock Deck
Unlock for access to all 146 flashcards in this deck.
Unlock Deck
k this deck
66
The supply and demand for solar panels are given by QS = 5P - 5,000 and QD = 15,000 - 5P, where P is price per solar panel and Q measures the quantity of solar panels. Suppose the government provides a $500 subsidy per solar panel. Before the subsidy, consumers pay price ____ and after the subsidy, consumers pay price ____.
A) $2,000; $1,750
B) $2,000; $2,250
C) $2,250; $2,000
D) $1,750; $2,250
A) $2,000; $1,750
B) $2,000; $2,250
C) $2,250; $2,000
D) $1,750; $2,250
Unlock Deck
Unlock for access to all 146 flashcards in this deck.
Unlock Deck
k this deck
67
(Figure: Market for Tickets II) As a result of the tax, the deadweight loss is:
A) B + E.
B) B + C + E + F.
C) E + F.
D) B + C.
A) B + E.
B) B + C + E + F.
C) E + F.
D) B + C.
Unlock Deck
Unlock for access to all 146 flashcards in this deck.
Unlock Deck
k this deck
68
(Figure: Price and Quantity VII) The area that represents producer surplus with the demand curve D1 is _____, and the area that represents producer surplus with the demand curve D2 is ____.
A) D; C + D + E
B) D; D + C
C) C + D + E; D
D) B + C; A + B
A) D; C + D + E
B) D; D + C
C) C + D + E; D
D) B + C; A + B
Unlock Deck
Unlock for access to all 146 flashcards in this deck.
Unlock Deck
k this deck
69
(Figure: Market for Tickets II) Refer to Figure: Market for Tickets II to answer the following question. Before the tax, consumer surplus is ____ and after the tax, consumer surplus is ____.
A) A + B + E; A
B) A + B + E; B
C) A + B + C + D +E + F; A + B + C + D
D) A + B + C; A + B + C + D
Before the tax, consumer surplus is ____ and after the tax, consumer surplus is ____.A) A + B + E; A
B) A + B + E; B
C) A + B + C + D +E + F; A + B + C + D
D) A + B + C; A + B + C + D
Unlock Deck
Unlock for access to all 146 flashcards in this deck.
Unlock Deck
k this deck
70
(Figure: Price and Quantity I) The decrease in supply from S1 to S2 will cause consumer surplus to _____ and producer surplus to _____.
A) decrease by $10.50; decrease by $4.50
B) decrease by $5.50; increase by $3
C) increase by $6; decrease by $18
D) decrease by $10.50; decrease by $6.67
A) decrease by $10.50; decrease by $4.50
B) decrease by $5.50; increase by $3
C) increase by $6; decrease by $18
D) decrease by $10.50; decrease by $6.67
Unlock Deck
Unlock for access to all 146 flashcards in this deck.
Unlock Deck
k this deck
71
Suppose the demand and supply curves for shampoo are given by
QD = 18 - 5P
QS = -3 + 2P
Where QD is the quantity of shampoo demanded (in thousands of bottles), QS is the quantity supplied, and P is the price of shampoo (in dollars per bottle). The consumer surplus at the equilibrium price is ____.
A) $9
B) $900
C) $450
D) $4.50
QD = 18 - 5P
QS = -3 + 2P
Where QD is the quantity of shampoo demanded (in thousands of bottles), QS is the quantity supplied, and P is the price of shampoo (in dollars per bottle). The consumer surplus at the equilibrium price is ____.
A) $9
B) $900
C) $450
D) $4.50
Unlock Deck
Unlock for access to all 146 flashcards in this deck.
Unlock Deck
k this deck
72
Which of the following payroll taxes would be most beneficial for workers (e.g., provide the highest after-tax wage)?
A) 5% on workers and 10% on employers
B) 9% on workers and 6% on employers
C) 12% on workers and 1% on employers
D) 2% on workers and 14% on employers
A) 5% on workers and 10% on employers
B) 9% on workers and 6% on employers
C) 12% on workers and 1% on employers
D) 2% on workers and 14% on employers
Unlock Deck
Unlock for access to all 146 flashcards in this deck.
Unlock Deck
k this deck
73
Suppose the demand and supply curves for units of university credits are given by
QD = 5,000 - P
QS = -1,000 + 4P
Where QD is the quantity of credits demanded, QS is the quantity supplied, and P is the price in dollars for each unit. Consumer surplus at the equilibrium price is ____.
A) $14,440,000
B) $7,800,000
C) $6,000,000
D) $7,220,000
QD = 5,000 - P
QS = -1,000 + 4P
Where QD is the quantity of credits demanded, QS is the quantity supplied, and P is the price in dollars for each unit. Consumer surplus at the equilibrium price is ____.
A) $14,440,000
B) $7,800,000
C) $6,000,000
D) $7,220,000
Unlock Deck
Unlock for access to all 146 flashcards in this deck.
Unlock Deck
k this deck
74
Suppose the demand and supply curves for shampoo are given by
QD = 18 - 5P
QS = -3 + 2P
Where QD is the quantity of shampoo demanded (in thousands of bottles), QS is the quantity supplied, and P is the price of shampoo (in dollars per bottle). The equilibrium price in this market is ____ and the equilibrium quantity is ____.
A) $3; 3,000
B) $3; 900
C) $6; 6,000
D) $2; 8,000
Unlock Deck
Unlock for access to all 146 flashcards in this deck.
Unlock Deck
k this deck
75
(Figure: Market for Tickets II) Before the tax, consumers pay the price ____ and after the tax, consumers pay the price ____.
A) $5.50; $6.00
B) $5.50; $6.50
C) $6.00; $5.50
D) $5.00; $6.00
A) $5.50; $6.00
B) $5.50; $6.50
C) $6.00; $5.50
D) $5.00; $6.00
Unlock Deck
Unlock for access to all 146 flashcards in this deck.
Unlock Deck
k this deck
76
Suppose that the demand curve for brown rice is given P= 50,000 - 3Q2, and supply is P = -10,000 + 3Q2. The consumer surplus at the equilibrium price is ____.
A) $1,000,000
B) $200,000
C) $100,000
D) $2,000,000
A) $1,000,000
B) $200,000
C) $100,000
D) $2,000,000
Unlock Deck
Unlock for access to all 146 flashcards in this deck.
Unlock Deck
k this deck
77
Suppose that technological breakthroughs make jet packs affordable, convenient, and safe for personal transportation. The demand for automobiles would become _____ the consumer surplus from automobiles.
A) more price elastic, decreasing
B) more price inelastic, increasing
C) more price inelastic, decreasing
D) perfectly inelastic, increasing
A) more price elastic, decreasing
B) more price inelastic, increasing
C) more price inelastic, decreasing
D) perfectly inelastic, increasing
Unlock Deck
Unlock for access to all 146 flashcards in this deck.
Unlock Deck
k this deck
78
(Figure: Market for Grapefruits I) At a market price of $4, what is total consumer surplus?
A) $120
B) $320
C) $160
D) $80
A) $120
B) $320
C) $160
D) $80
Unlock Deck
Unlock for access to all 146 flashcards in this deck.
Unlock Deck
k this deck
79
Suppose that the demand curve for brown rice is given by P= 50,000 - 3Q2, and supply is P = -10,000 + 3Q2. The equilibrium price is ____ and the equilibrium quantity is ____.
A) $110,000; 200
B) $20,000; 100
C) $100; 20,000
D) $2,000; 1,000
A) $110,000; 200
B) $20,000; 100
C) $100; 20,000
D) $2,000; 1,000
Unlock Deck
Unlock for access to all 146 flashcards in this deck.
Unlock Deck
k this deck
80
(Figure: Market for Good X I) Which of the following statements is (are) TRUE? I. A tax on buyers of $3 per unit raises the price buyers pay to $6.
II) A tax on sellers of $3 per unit raises the price buyers pay to $6.
III) With a tax on sellers of $3 per unit, the share of the tax paid by buyers is 67%.
A) I, II, and III
B) I and III
C) II and III
D) I
I. A tax on buyers of $3 per unit raises the price buyers pay to $6.II) A tax on sellers of $3 per unit raises the price buyers pay to $6.
III) With a tax on sellers of $3 per unit, the share of the tax paid by buyers is 67%.
A) I, II, and III
B) I and III
C) II and III
D) I
Unlock Deck
Unlock for access to all 146 flashcards in this deck.
Unlock Deck
k this deck
Unlock Deck
Unlock for access to all 146 flashcards in this deck.


