Deck 13: Correlation and Linear Regression
Full screen (f)
Question
Question
Question
Medical researchers conducted a study designed to evaluate the relationship between blood pressure (y), age (x1), and cholesterol (x2).They proposed a linear model.A total of 126 individuals were randomly sampled, and blood pressure, age, and cholesterol were recorded for each.The regression summary appears here:
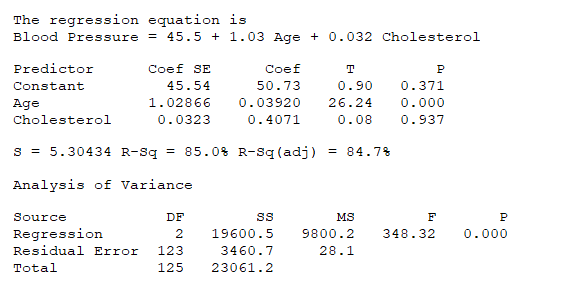
Which predictor (if any) does not appear to be linearly correlated with blood pressure? Which reason supports your answer?
A) All of the predictors are significant because the p-value from the global utility test is essentially zero.
B) All of the predictors are significant because the R-Sq value is quite high (85%).
C) Cholesterol does not appear to be linearly correlated with blood pressure because its p- value is 0.937.
D) Age does not appear to be linearly correlated with blood pressure because its p-value is essentially zero.
Question
Ten used cars from a rental fleet are randomly selected.Each vehicle's annual maintenance cost from the previous calendar year (y) is recorded as well as the vehicle's current mileage (x).A simple linear regression is conducted on the data.
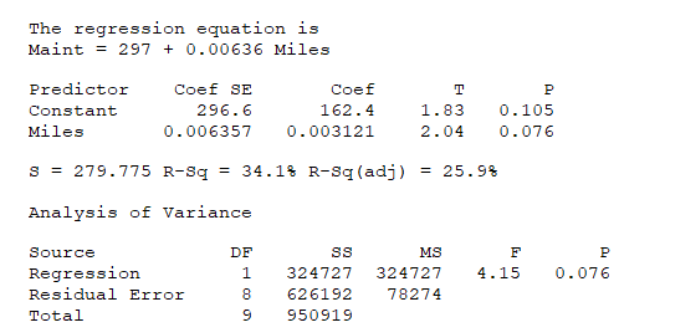
What is a 98% confidence interval for the mean annual repair cost of all used vehicles with 22,500 miles.=> (Given: Sxx= 8,036,677,024 and = $43,627.700.)
A) $(120.00, 759.20)
B) $(-431.51, 1,310.72)
C) $(22,199.25, 22,800.75)
D) $(128.29, 750.91)
What is a 98% confidence interval for the mean annual repair cost of all used vehicles with 22,500 miles.=> (Given: Sxx= 8,036,677,024 and
= $43,627.700.)A) $(120.00, 759.20)
B) $(-431.51, 1,310.72)
C) $(22,199.25, 22,800.75)
D) $(128.29, 750.91)
Question
Question
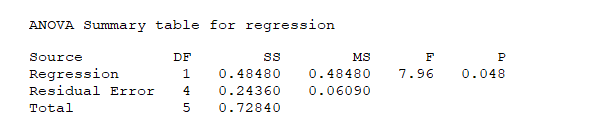
The following ANOVA table describes a simple linear regression on two arbitrary variables x and y.
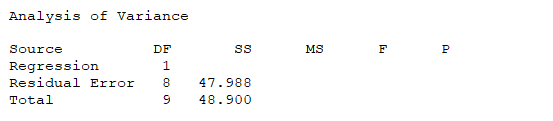
Based on the output, does there appear to be a significant linear relationship between x and y? Select the appropriate critical value (CV), test statistic (TS), and decision.(Use α = 0.01.)
A) CV = 240.54; TS = 52.618; no significant linear relationship.
B) CV = 5.12; TS = 6.578; there appears to be a significant linear relationship.
C) CV = 5.32; TS = 0.152; no significant linear relationship.
D) CV = 240.54; TS = 0.019; there appears to be a significant linear relationship.
Question
Question
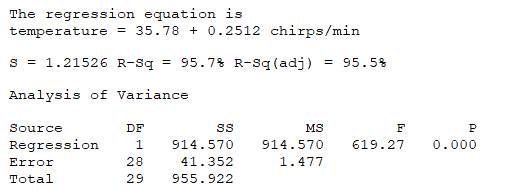
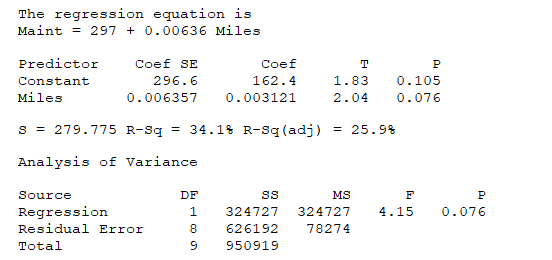
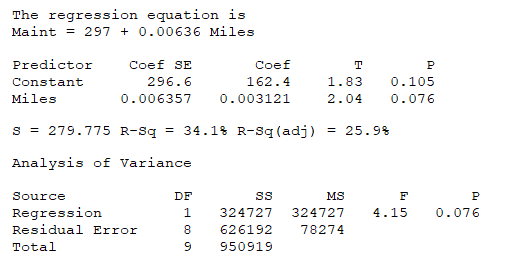
Consider the following regression summary:
Perform a global utility test for the model.State the correct decision and reasoning.(Use α = 0.01.)
A) The model appears to be useful because p-value = 0.000 < 0.01.
B) The model does not appear to be useful because p-value = 0.014 > 0.01.
C) The model appears to be useful because R-Sq (adj) is more than 0.01 less than R-Sq.
D) The model does not appear to be useful because the p-value = 0.018 > 0.01.
Question
Question
Question
In simple linear regression, most often we perform a two-tailed test of the population slope  to determine whether there is sufficient evidence to infer that a linear relationship exists.The null hypothesis is stated as:
A) H₀: = 0.
= 0.
B) H₀: = b1.
= b1.
C) H₀: = 1.
= 1.
D) H₀: ≠ 0.
≠ 0.
to determine whether there is sufficient evidence to infer that a linear relationship exists.The null hypothesis is stated as:A) H₀:
= 0.B) H₀:
= b1.C) H₀:
= 1.D) H₀:
≠ 0. Question
Consider the following regression analysis for predicting sales per week from intelligence and extroversion scores:
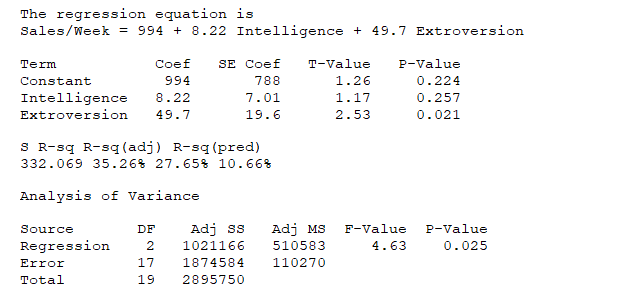
What proportion of the variability in sales per week is explained by the model?
A) 0.1066
B) 0.224
C) 0.3526
D) 0.021
What proportion of the variability in sales per week is explained by the model?
A) 0.1066
B) 0.224
C) 0.3526
D) 0.021
Question
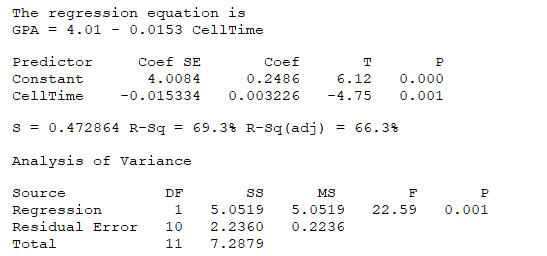
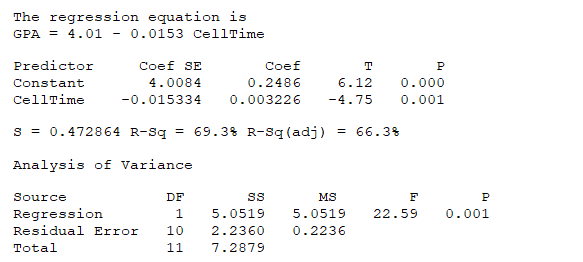
We record the amount of time (x in minutes) per day that a group of 12 high school students spend using their cell phone (texting, talking, and web use).We also record the overall GPA (y) of each student.Following is a regression summary for these data:
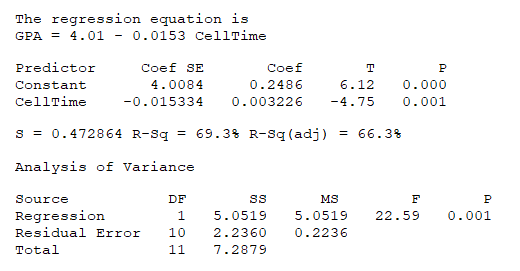
What is a 95% confidence interval for the average GPA change associated with a 1-min increase in average daily cell use (β1)?
A) (-0.0225, -0.0082)
B) (3.4545, 4.5623)
C) (-0.0212, -0.0095)
D) (3.5578, 4.4590)
What is a 95% confidence interval for the average GPA change associated with a 1-min increase in average daily cell use (β1)?
A) (-0.0225, -0.0082)
B) (3.4545, 4.5623)
C) (-0.0212, -0.0095)
D) (3.5578, 4.4590)
Question
Question
Question
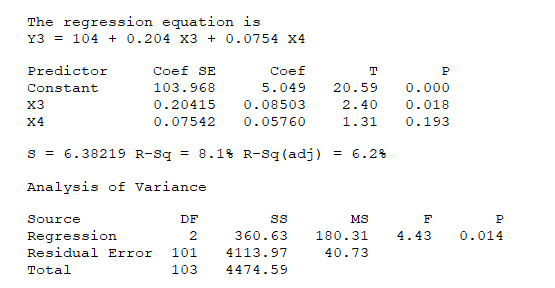
Consider the following regression summary:
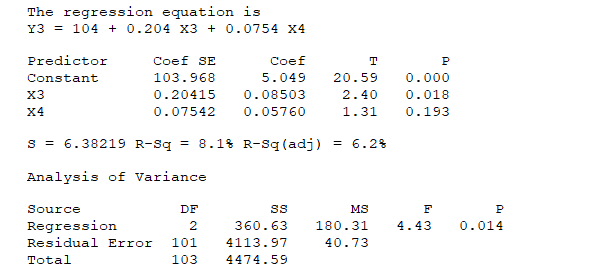
What proportion of the Y3 variability is explained by the model?
A) 0.081
B) 0.014
C) 0.018
D) 0.193
What proportion of the Y3 variability is explained by the model?
A) 0.081
B) 0.014
C) 0.018
D) 0.193
Question
From a random sample of n = 6 college students, a school counselor obtained the students' high school GPAs (x) and their college GPAs (y).Using these data, she wishes to develop a model that will allow her to predict a student's college GPA from his or her high school GPA. 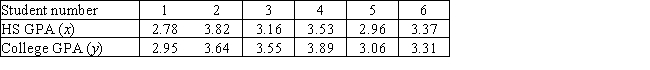
What is the fitted least-squares regression equation?
A) y = 0.326 + 0.8660x
B) y = 3.360 + 0.0114x
C) y = 0.887 + 0.769x
D) y = 76.985 - 248.344x
What is the fitted least-squares regression equation?
A) y = 0.326 + 0.8660x
B) y = 3.360 + 0.0114x
C) y = 0.887 + 0.769x
D) y = 76.985 - 248.344x
Question
Question
The regression equation is y1 = 0.33 + 0.866 x1
Based on this regression summary, what is r2?
A) 0.8158
B) 0.6656
C) 0.3344
D) 0.5025
Based on this regression summary, what is r2?
A) 0.8158
B) 0.6656
C) 0.3344
D) 0.5025
Question
In the late 1890s, scientists first noted that the frequency of a cricket's chirps is related to air temperature.For each of 30 crickets, the frequency of chirping (in chirps per minute) and the air temperature (in degrees Fahrenheit) were recorded, and a regression analysis was performed.
Given that Sxx= 14,497.9 and 067, what is a 90% prediction interval for the air temperature when a cricket is chirping at a frequency of 120 chirps per minute?
A) (66.539, 67.301)
B) (63.818, 68.022)
C) (65.462, 66.379)
D) (62.389, 67.451)
Given that Sxx= 14,497.9 and
067, what is a 90% prediction interval for the air temperature when a cricket is chirping at a frequency of 120 chirps per minute?A) (66.539, 67.301)
B) (63.818, 68.022)
C) (65.462, 66.379)
D) (62.389, 67.451)
Question
Question
Consider these five x, y pairs. 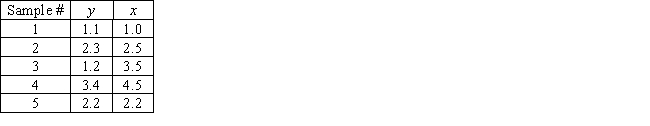
The regression equation is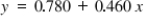 What is
  ?
?
A) 1.19
B) 2.39
C) -2.39
D) -1.19
The regression equation is
What is ?A) 1.19
B) 2.39
C) -2.39
D) -1.19
Question
Is it always possible to do a linear best fit to a data set?
A) Yes; the fact that all data are affected by random error makes them linear.
B) Yes, but the fit may be meaningless if the data are not really linear.
C) No; the data may not be linear to begin with.
D) No; the value may be impossible to calculate.
A) Yes; the fact that all data are affected by random error makes them linear.
B) Yes, but the fit may be meaningless if the data are not really linear.
C) No; the data may not be linear to begin with.
D) No; the
value may be impossible to calculate. Question
The equation  (where E is a random variable) represents:
A) a general additive probabilistic model.
B) a general additive deterministic model.
C) a fixed, one-to-one relationship between x and y.
D) a deterministic model with x as the independent variable and y as the dependent variable.
(where E is a random variable) represents:A) a general additive probabilistic model.
B) a general additive deterministic model.
C) a fixed, one-to-one relationship between x and y.
D) a deterministic model with x as the independent variable and y as the dependent variable.
Question
We record the amount of time (xin minutes) per day that a group of 12 high school students spend using their cell phone (texting, talking, and web use).We also record the overall GPA (y) of each student.Following is a regression summary for these data:
What is a 90% confidence interval for β0, the mean GPA of high school students who spent no time using their cell phone?
A) (-0.0225, -0.0082)
B) (3.4545, 4.5623)
C) (-0.0212, -0.0095)
D) (3.5578, 4.4590)
What is a 90% confidence interval for β0, the mean GPA of high school students who spent no time using their cell phone?
A) (-0.0225, -0.0082)
B) (3.4545, 4.5623)
C) (-0.0212, -0.0095)
D) (3.5578, 4.4590)
Question
We record the amount of time (x in minutes) per day that a group of 12 high school students spend using their cell phone (texting, talking, and web use).We also record the overall GPA (y) of each student.Following a regression summary for these data:
Does there appear to be a significant linear relationship between the amount of cell phone use and GPA? (Use α = 0.01.)
A) No, because the r2 value is too low.
B) Yes, because the regression equation is defined.
C) Yes, because the p-value from the test for significance is 0.000.
D) Yes, because the p-value from the test for significance is 0.001.
Question
From the following residual versus fit plot, it appears that: 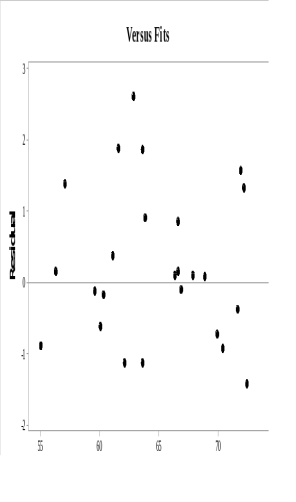
A) the mean error is not zero.
B) there may be a problem with nonconstant variance.
C) the errors do not violate any regression assumptions.
D) The regression equation is not shown, so it is not possible to make a determination.
A) the mean error is not zero.
B) there may be a problem with nonconstant variance.
C) the errors do not violate any regression assumptions.
D) The regression equation is not shown, so it is not possible to make a determination.
Question
Consider the following regression analysis for predicting sales per week from intelligence and extroversion scores:
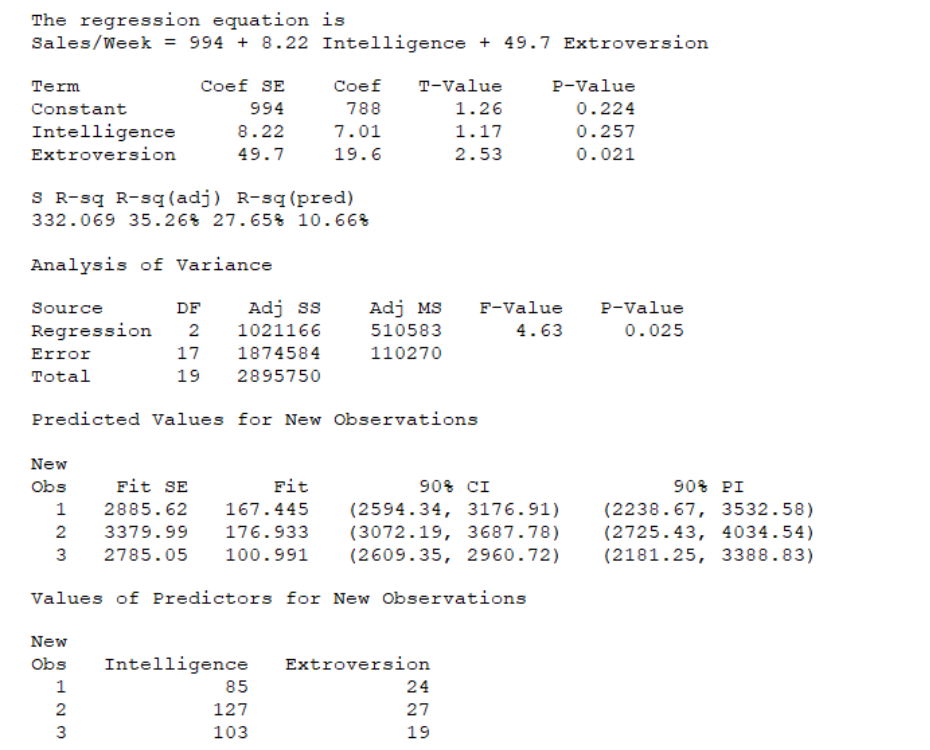
What is a 90% confidence interval for the average sales per week for all people with an intelligence score of 103 and an extroversion score of 19?
A) (2594.34, 3176.91)
B) (2609.35, 2960.72)
C) (2181.25, 3388.83)
D) (3072.19, 3687.78)
What is a 90% confidence interval for the average sales per week for all people with an intelligence score of 103 and an extroversion score of 19?
A) (2594.34, 3176.91)
B) (2609.35, 2960.72)
C) (2181.25, 3388.83)
D) (3072.19, 3687.78)
Question
Question
Ten used cars from a rental fleet are randomly selected.Each vehicle's annual maintenance cost from the previous calendar year (y) is recorded as well as the vehicle's current mileage (x).A simple linear regression is conducted on the data.
What is an 80% prediction interval for the annual repair cost of a used vehicle with 40,000 miles? (Given: Sxx= 8,036,677,024 and = $43,627.700.)
A) $(144.72, 956.96)
B) $(140.67, 961.01)
C) $(426.25, 675.43)
D) $(427.48, 674.20)
What is an 80% prediction interval for the annual repair cost of a used vehicle with 40,000 miles? (Given: Sxx= 8,036,677,024 and
= $43,627.700.)A) $(144.72, 956.96)
B) $(140.67, 961.01)
C) $(426.25, 675.43)
D) $(427.48, 674.20)
Question
Question
Based on the following scatter plot of age versus blood pressure, which of the regression assumptions may be violated? 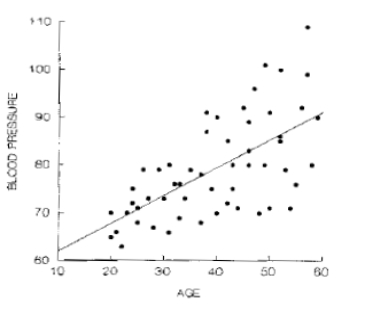
A) Mean error = 0.
B) Error variance is constant.
C) Errors are normally distributed.
D) Errors are independent.
A) Mean error = 0.
B) Error variance is constant.
C) Errors are normally distributed.
D) Errors are independent.
Question
Question
In the late 1890s, scientists first noted that the frequency of a cricket's chirps is related to air temperature.For each of 30 crickets, the frequency of chirping (in chirps per minute) and the air temperature (in degrees Fahrenheit) were recorded, and a regression analysis was performed.
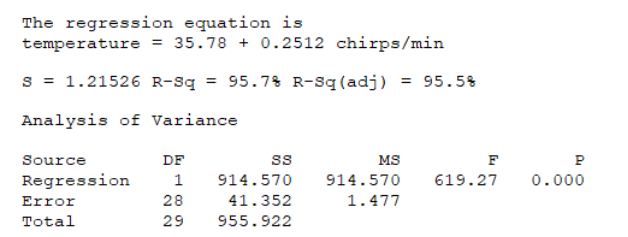
Given that Sxx= 14,497.9 and 117.067, what is a 95% confidence interval for the mean air temperature when a cricket is chirping at a frequency of 120 chirps per minute?
A) (66.539, 67.301)
B) (63.818, 68.022)
C) (65.462, 66.379)
D) (62.389, 67.451)
Given that Sxx= 14,497.9 and
117.067, what is a 95% confidence interval for the mean air temperature when a cricket is chirping at a frequency of 120 chirps per minute?A) (66.539, 67.301)
B) (63.818, 68.022)
C) (65.462, 66.379)
D) (62.389, 67.451)
Question
Question
Question
Question
Question
Question
Suppose 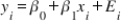 , where
  .This is:
A) a simple linear regression model.
B) a deterministic model.
C) a generalized linear model.
D) a deterministic relationship.
, where .This is:A) a simple linear regression model.
B) a deterministic model.
C) a generalized linear model.
D) a deterministic relationship.
Question
Ten used cars from a rental fleet are randomly selected.Each vehicle's annual maintenance cost from the previous calendar year (y) is recorded as well as the vehicle's current mileage (x).A simple linear regression is conducted on the data.
Conduct a test of hypothesis to see if there is sufficient evidence to conclude that used vehicles with 22,500 miles will have a mean annual maintenance cost that exceeds $400.Select the appropriate critical value (CV), test statistic (TS), and decision.(Use α = 0.05).(Given: Sxx= 803,667,7024 and = $43,627.700.)
A) CV = 1.8331; TS = 0.1415; fail to reject H₀
B) CV = 1.8595; TS = 0.02611; fail to reject H₀
C) CV = 1.8331; TS = 0.2986; fail to reject H₀
D) CV = 1.8595; TS = 0.3589; fail to reject H₀
Conduct a test of hypothesis to see if there is sufficient evidence to conclude that used vehicles with 22,500 miles will have a mean annual maintenance cost that exceeds $400.Select the appropriate critical value (CV), test statistic (TS), and decision.(Use α = 0.05).(Given: Sxx= 803,667,7024 and
= $43,627.700.)A) CV = 1.8331; TS = 0.1415; fail to reject H₀
B) CV = 1.8595; TS = 0.02611; fail to reject H₀
C) CV = 1.8331; TS = 0.2986; fail to reject H₀
D) CV = 1.8595; TS = 0.3589; fail to reject H₀
Question
Question
Question
Question
Question
Question
Question
Question
In a deterministic relationship between two variables x and y of the form  it is understood that:
A) completely determines
B) x and y are not related.
C) y is completely determined by x.
D) x and y have similar properties.
it is understood that:A)
completely determines B) x and y are not related.
C) y is completely determined by x.
D) x and y have similar properties.
Question
In the following residual plot: 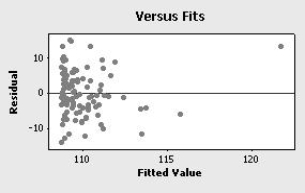
A) the plot appears to be random, so there are no major concerns.
B) the plot clearly shows that the residuals are not normally distributed.
C) there appears to be at least one highly influential observation.
D) the mean of the error distribution appears to differ from zero.
A) the plot appears to be random, so there are no major concerns.
B) the plot clearly shows that the residuals are not normally distributed.
C) there appears to be at least one highly influential observation.
D) the mean of the error distribution appears to differ from zero.
Question
Question
The linear relationship  (where
  and
and  are constants) is an example of:
A) an indeterminate relationship.
B) a linear deterministic relationship.
C) a linear probabilistic relationship.
D) a nonlinear deterministic relationship.
(where and are constants) is an example of:A) an indeterminate relationship.
B) a linear deterministic relationship.
C) a linear probabilistic relationship.
D) a nonlinear deterministic relationship.
Question
This histogram shows residuals from a simple linear regression: 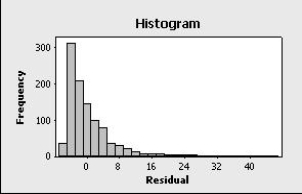 It appears that:
A) there is a dependence among the errors.
B) the mean of the error distribution is not zero.
C) the error distribution is not normal.
D) the error variance is not constant.
It appears that:A) there is a dependence among the errors.
B) the mean of the error distribution is not zero.
C) the error distribution is not normal.
D) the error variance is not constant.
Question
Question
Question
Question

Unlock Deck
Sign up to unlock the cards in this deck!
Unlock Deck
Unlock Deck
1/57
Play
Full screen (f)
Deck 13: Correlation and Linear Regression
1
The confidence interval estimate of the expected value of y for a given value of x, when compared to the prediction interval of y for the same given value of x at the same confidence level, will be:
A) wider.
B) narrower.
C) the same.
D) impossible to know.
A) wider.
B) narrower.
C) the same.
D) impossible to know.
narrower.
2
Factors A and B show a correlation of 0.95.This means that:
A) B causes A.
B) A causes B.
C) either A causes B or B causes A.
D) nothing; correlation does not mean the factors are actually linked.
A) B causes A.
B) A causes B.
C) either A causes B or B causes A.
D) nothing; correlation does not mean the factors are actually linked.
nothing; correlation does not mean the factors are actually linked.
3
Medical researchers conducted a study designed to evaluate the relationship between blood pressure (y), age (x1), and cholesterol (x2).They proposed a linear model.A total of 126 individuals were randomly sampled, and blood pressure, age, and cholesterol were recorded for each.The regression summary appears here:
Which predictor (if any) does not appear to be linearly correlated with blood pressure? Which reason supports your answer?
A) All of the predictors are significant because the p-value from the global utility test is essentially zero.
B) All of the predictors are significant because the R-Sq value is quite high (85%).
C) Cholesterol does not appear to be linearly correlated with blood pressure because its p- value is 0.937.
D) Age does not appear to be linearly correlated with blood pressure because its p-value is essentially zero.
Cholesterol does not appear to be linearly correlated with blood pressure because its p- value is 0.937.
4
Ten used cars from a rental fleet are randomly selected.Each vehicle's annual maintenance cost from the previous calendar year (y) is recorded as well as the vehicle's current mileage (x).A simple linear regression is conducted on the data.
What is a 98% confidence interval for the mean annual repair cost of all used vehicles with 22,500 miles.=> (Given: Sxx= 8,036,677,024 and = $43,627.700.)
A) $(120.00, 759.20)
B) $(-431.51, 1,310.72)
C) $(22,199.25, 22,800.75)
D) $(128.29, 750.91)
What is a 98% confidence interval for the mean annual repair cost of all used vehicles with 22,500 miles.=> (Given: Sxx= 8,036,677,024 and
= $43,627.700.)A) $(120.00, 759.20)
B) $(-431.51, 1,310.72)
C) $(22,199.25, 22,800.75)
D) $(128.29, 750.91)
Unlock Deck
Unlock for access to all 57 flashcards in this deck.
Unlock Deck
k this deck
5
Which value of the correlation coefficient r indicates a stronger correlation than 0.72?
A) -0.89
B) -0.69
C) 0.55
D) 0.70
A) -0.89
B) -0.69
C) 0.55
D) 0.70
Unlock Deck
Unlock for access to all 57 flashcards in this deck.
Unlock Deck
k this deck
6
The following ANOVA table describes a simple linear regression on two arbitrary variables x and y.
Based on the output, does there appear to be a significant linear relationship between x and y? Select the appropriate critical value (CV), test statistic (TS), and decision.(Use α = 0.01.)
A) CV = 240.54; TS = 52.618; no significant linear relationship.
B) CV = 5.12; TS = 6.578; there appears to be a significant linear relationship.
C) CV = 5.32; TS = 0.152; no significant linear relationship.
D) CV = 240.54; TS = 0.019; there appears to be a significant linear relationship.
Unlock Deck
Unlock for access to all 57 flashcards in this deck.
Unlock Deck
k this deck
7
According to the spurious correlations website (https://www.tylervigen.com/spurious-correlations), there is a 0.985065 correlation from 2000 to 2009 between revenue from arcade games and the number of computer science doctorates awarded in the United States.Assuming this correlation reflects a real cause-effect relationship, what is a possible link between these two factors?
A) This is complete nonsense and should be ignored.
B) Kids who play lots of arcade games all go on to study computer science.
C) People who go on to get their degrees in computer science are attracted to computer-based games.
D) Arcades give discounts to PhD students.
A) This is complete nonsense and should be ignored.
B) Kids who play lots of arcade games all go on to study computer science.
C) People who go on to get their degrees in computer science are attracted to computer-based games.
D) Arcades give discounts to PhD students.
Unlock Deck
Unlock for access to all 57 flashcards in this deck.
Unlock Deck
k this deck
8
Consider the following regression summary:
Perform a global utility test for the model.State the correct decision and reasoning.(Use α = 0.01.)
A) The model appears to be useful because p-value = 0.000 < 0.01.
B) The model does not appear to be useful because p-value = 0.014 > 0.01.
C) The model appears to be useful because R-Sq (adj) is more than 0.01 less than R-Sq.
D) The model does not appear to be useful because the p-value = 0.018 > 0.01.
Unlock Deck
Unlock for access to all 57 flashcards in this deck.
Unlock Deck
k this deck
9
If all the values of an independent variable x are equal, then performing a simple linear regression on a dependent variable y will result in a coefficient of determination that is equal to:
A) infinity.
B) 1.0.
C) 0.5.
D) 0.
A) infinity.
B) 1.0.
C) 0.5.
D) 0.
Unlock Deck
Unlock for access to all 57 flashcards in this deck.
Unlock Deck
k this deck
10
According to the spurious correlations website (https://www.tylervigen.com/spurious-correlations), there is a 0.952407 correlation from 1999 to 2010 between people who drowned after falling from a fishing boat and the marriage rate in Kentucky.This shows that:
A) the data are somehow wrong.
B) survivors of drowning victims like to get remarried in Kentucky.
C) people married in Kentucky do not know how to swim.
D) A strong correlation may be meaningless and just a coincidence.
A) the data are somehow wrong.
B) survivors of drowning victims like to get remarried in Kentucky.
C) people married in Kentucky do not know how to swim.
D) A strong correlation may be meaningless and just a coincidence.
Unlock Deck
Unlock for access to all 57 flashcards in this deck.
Unlock Deck
k this deck
11
In simple linear regression, most often we perform a two-tailed test of the population slope to determine whether there is sufficient evidence to infer that a linear relationship exists.The null hypothesis is stated as:
A) H₀: = 0.
B) H₀: = b1.
C) H₀: = 1.
D) H₀: ≠ 0.
to determine whether there is sufficient evidence to infer that a linear relationship exists.The null hypothesis is stated as:A) H₀:
= 0.B) H₀:
= b1.C) H₀:
= 1.D) H₀:
≠ 0. Unlock Deck
Unlock for access to all 57 flashcards in this deck.
Unlock Deck
k this deck
12
Consider the following regression analysis for predicting sales per week from intelligence and extroversion scores:
What proportion of the variability in sales per week is explained by the model?
A) 0.1066
B) 0.224
C) 0.3526
D) 0.021
What proportion of the variability in sales per week is explained by the model?
A) 0.1066
B) 0.224
C) 0.3526
D) 0.021
Unlock Deck
Unlock for access to all 57 flashcards in this deck.
Unlock Deck
k this deck
13
We record the amount of time (x in minutes) per day that a group of 12 high school students spend using their cell phone (texting, talking, and web use).We also record the overall GPA (y) of each student.Following is a regression summary for these data:
What is a 95% confidence interval for the average GPA change associated with a 1-min increase in average daily cell use (β1)?
A) (-0.0225, -0.0082)
B) (3.4545, 4.5623)
C) (-0.0212, -0.0095)
D) (3.5578, 4.4590)
What is a 95% confidence interval for the average GPA change associated with a 1-min increase in average daily cell use (β1)?
A) (-0.0225, -0.0082)
B) (3.4545, 4.5623)
C) (-0.0212, -0.0095)
D) (3.5578, 4.4590)
Unlock Deck
Unlock for access to all 57 flashcards in this deck.
Unlock Deck
k this deck
14
In a simple linear regression analysis, the standard error of the slope is:
A) a measure of the variation in the regression slope from sample to sample.
B) a measure of the amount of change in the dependent variable y for a one-unit change in the independent variable x.
C) the square root of the standard error of the estimate.
D) the square of the standard error of the estimate.
Unlock Deck
Unlock for access to all 57 flashcards in this deck.
Unlock Deck
k this deck
15
A simple linear regression between y (weight in pounds) and x (height in inches) results in the following least-squares line: y = 128 + 6x.This tells us that if the height is increased by 1 in, then.on average.the weight is predicted to:
A) decrease by 1 lb.
B) decrease by 6 lb.
C) increase by 6 lb.
D) increase by 128 lb.
A) decrease by 1 lb.
B) decrease by 6 lb.
C) increase by 6 lb.
D) increase by 128 lb.
Unlock Deck
Unlock for access to all 57 flashcards in this deck.
Unlock Deck
k this deck
16
Consider the following regression summary:
What proportion of the Y3 variability is explained by the model?
A) 0.081
B) 0.014
C) 0.018
D) 0.193
What proportion of the Y3 variability is explained by the model?
A) 0.081
B) 0.014
C) 0.018
D) 0.193
Unlock Deck
Unlock for access to all 57 flashcards in this deck.
Unlock Deck
k this deck
17
From a random sample of n = 6 college students, a school counselor obtained the students' high school GPAs (x) and their college GPAs (y).Using these data, she wishes to develop a model that will allow her to predict a student's college GPA from his or her high school GPA.
What is the fitted least-squares regression equation?
A) y = 0.326 + 0.8660x
B) y = 3.360 + 0.0114x
C) y = 0.887 + 0.769x
D) y = 76.985 - 248.344x
What is the fitted least-squares regression equation?
A) y = 0.326 + 0.8660x
B) y = 3.360 + 0.0114x
C) y = 0.887 + 0.769x
D) y = 76.985 - 248.344x
Unlock Deck
Unlock for access to all 57 flashcards in this deck.
Unlock Deck
k this deck
18
What is the difference between a general additive probabilistic model and a general deterministic model?
A) The deterministic model includes random deviation, but the probabilistic model does not.
B) The probabilistic model includes random deviation, but the deterministic model does not.
C) The two models differ only in terms of the type of deterministic functions appropriate for the models.
D) They are essentially the same (both names apply to the same model).
Unlock Deck
Unlock for access to all 57 flashcards in this deck.
Unlock Deck
k this deck
19
The regression equation is y1 = 0.33 + 0.866 x1
Based on this regression summary, what is r2?
A) 0.8158
B) 0.6656
C) 0.3344
D) 0.5025
Based on this regression summary, what is r2?
A) 0.8158
B) 0.6656
C) 0.3344
D) 0.5025
Unlock Deck
Unlock for access to all 57 flashcards in this deck.
Unlock Deck
k this deck
20
In the late 1890s, scientists first noted that the frequency of a cricket's chirps is related to air temperature.For each of 30 crickets, the frequency of chirping (in chirps per minute) and the air temperature (in degrees Fahrenheit) were recorded, and a regression analysis was performed.
Given that Sxx= 14,497.9 and 067, what is a 90% prediction interval for the air temperature when a cricket is chirping at a frequency of 120 chirps per minute?
A) (66.539, 67.301)
B) (63.818, 68.022)
C) (65.462, 66.379)
D) (62.389, 67.451)
Given that Sxx= 14,497.9 and
067, what is a 90% prediction interval for the air temperature when a cricket is chirping at a frequency of 120 chirps per minute?A) (66.539, 67.301)
B) (63.818, 68.022)
C) (65.462, 66.379)
D) (62.389, 67.451)
Unlock Deck
Unlock for access to all 57 flashcards in this deck.
Unlock Deck
k this deck
21
In simple linear regression, the test statistic t is:
A) the square root of the corresponding F statistic.
B) twice the value of the corresponding F statistic.
C) the absolute value of the corresponding F statistic.
D) unrelated to any other statistic.
A) the square root of the corresponding F statistic.
B) twice the value of the corresponding F statistic.
C) the absolute value of the corresponding F statistic.
D) unrelated to any other statistic.
Unlock Deck
Unlock for access to all 57 flashcards in this deck.
Unlock Deck
k this deck
22
Consider these five x, y pairs.
The regression equation is What is ?
A) 1.19
B) 2.39
C) -2.39
D) -1.19
The regression equation is
What is ?A) 1.19
B) 2.39
C) -2.39
D) -1.19
Unlock Deck
Unlock for access to all 57 flashcards in this deck.
Unlock Deck
k this deck
23
Is it always possible to do a linear best fit to a data set?
A) Yes; the fact that all data are affected by random error makes them linear.
B) Yes, but the fit may be meaningless if the data are not really linear.
C) No; the data may not be linear to begin with.
D) No; the value may be impossible to calculate.
A) Yes; the fact that all data are affected by random error makes them linear.
B) Yes, but the fit may be meaningless if the data are not really linear.
C) No; the data may not be linear to begin with.
D) No; the
value may be impossible to calculate. Unlock Deck
Unlock for access to all 57 flashcards in this deck.
Unlock Deck
k this deck
24
The equation (where E is a random variable) represents:
A) a general additive probabilistic model.
B) a general additive deterministic model.
C) a fixed, one-to-one relationship between x and y.
D) a deterministic model with x as the independent variable and y as the dependent variable.
(where E is a random variable) represents:A) a general additive probabilistic model.
B) a general additive deterministic model.
C) a fixed, one-to-one relationship between x and y.
D) a deterministic model with x as the independent variable and y as the dependent variable.
Unlock Deck
Unlock for access to all 57 flashcards in this deck.
Unlock Deck
k this deck
25
We record the amount of time (xin minutes) per day that a group of 12 high school students spend using their cell phone (texting, talking, and web use).We also record the overall GPA (y) of each student.Following is a regression summary for these data:
What is a 90% confidence interval for β0, the mean GPA of high school students who spent no time using their cell phone?
A) (-0.0225, -0.0082)
B) (3.4545, 4.5623)
C) (-0.0212, -0.0095)
D) (3.5578, 4.4590)
What is a 90% confidence interval for β0, the mean GPA of high school students who spent no time using their cell phone?
A) (-0.0225, -0.0082)
B) (3.4545, 4.5623)
C) (-0.0212, -0.0095)
D) (3.5578, 4.4590)
Unlock Deck
Unlock for access to all 57 flashcards in this deck.
Unlock Deck
k this deck
26
We record the amount of time (x in minutes) per day that a group of 12 high school students spend using their cell phone (texting, talking, and web use).We also record the overall GPA (y) of each student.Following a regression summary for these data:
Does there appear to be a significant linear relationship between the amount of cell phone use and GPA? (Use α = 0.01.)
A) No, because the r2 value is too low.
B) Yes, because the regression equation is defined.
C) Yes, because the p-value from the test for significance is 0.000.
D) Yes, because the p-value from the test for significance is 0.001.
Does there appear to be a significant linear relationship between the amount of cell phone use and GPA? (Use α = 0.01.)
A) No, because the r2 value is too low.
B) Yes, because the regression equation is defined.
C) Yes, because the p-value from the test for significance is 0.000.
D) Yes, because the p-value from the test for significance is 0.001.
Unlock Deck
Unlock for access to all 57 flashcards in this deck.
Unlock Deck
k this deck
27
From the following residual versus fit plot, it appears that:
A) the mean error is not zero.
B) there may be a problem with nonconstant variance.
C) the errors do not violate any regression assumptions.
D) The regression equation is not shown, so it is not possible to make a determination.
A) the mean error is not zero.
B) there may be a problem with nonconstant variance.
C) the errors do not violate any regression assumptions.
D) The regression equation is not shown, so it is not possible to make a determination.
Unlock Deck
Unlock for access to all 57 flashcards in this deck.
Unlock Deck
k this deck
28
Consider the following regression analysis for predicting sales per week from intelligence and extroversion scores:
What is a 90% confidence interval for the average sales per week for all people with an intelligence score of 103 and an extroversion score of 19?
A) (2594.34, 3176.91)
B) (2609.35, 2960.72)
C) (2181.25, 3388.83)
D) (3072.19, 3687.78)
What is a 90% confidence interval for the average sales per week for all people with an intelligence score of 103 and an extroversion score of 19?
A) (2594.34, 3176.91)
B) (2609.35, 2960.72)
C) (2181.25, 3388.83)
D) (3072.19, 3687.78)
Unlock Deck
Unlock for access to all 57 flashcards in this deck.
Unlock Deck
k this deck
29
Assume a least-squares regression line is found to be y = -5.73 + 0.282x.The coefficient of determination for these data is 0.64.What is the correlation coefficient?
A) 0.411
B) -0.64
C) 0.80
D) -0.80
A) 0.411
B) -0.64
C) 0.80
D) -0.80
Unlock Deck
Unlock for access to all 57 flashcards in this deck.
Unlock Deck
k this deck
30
Ten used cars from a rental fleet are randomly selected.Each vehicle's annual maintenance cost from the previous calendar year (y) is recorded as well as the vehicle's current mileage (x).A simple linear regression is conducted on the data.
What is an 80% prediction interval for the annual repair cost of a used vehicle with 40,000 miles? (Given: Sxx= 8,036,677,024 and = $43,627.700.)
A) $(144.72, 956.96)
B) $(140.67, 961.01)
C) $(426.25, 675.43)
D) $(427.48, 674.20)
What is an 80% prediction interval for the annual repair cost of a used vehicle with 40,000 miles? (Given: Sxx= 8,036,677,024 and
= $43,627.700.)A) $(144.72, 956.96)
B) $(140.67, 961.01)
C) $(426.25, 675.43)
D) $(427.48, 674.20)
Unlock Deck
Unlock for access to all 57 flashcards in this deck.
Unlock Deck
k this deck
31
In simple linear regression, the plot of residuals versus fitted values can be used to check for:
A) normality.
B) independence.
C) a constant variance independent of x.
D) All of the above.
A) normality.
B) independence.
C) a constant variance independent of x.
D) All of the above.
Unlock Deck
Unlock for access to all 57 flashcards in this deck.
Unlock Deck
k this deck
32
Based on the following scatter plot of age versus blood pressure, which of the regression assumptions may be violated?
A) Mean error = 0.
B) Error variance is constant.
C) Errors are normally distributed.
D) Errors are independent.
A) Mean error = 0.
B) Error variance is constant.
C) Errors are normally distributed.
D) Errors are independent.
Unlock Deck
Unlock for access to all 57 flashcards in this deck.
Unlock Deck
k this deck
33
If the sample correlation coefficient is -0.95, what can we conclude?
A) The two variables are not correlated.
B) The two variables are weakly correlated.
C) An increase in the independent variable is associated with a decrease in the dependent variable.
D) An increase in the independent variable is associated with an increase in the dependent variable.
A) The two variables are not correlated.
B) The two variables are weakly correlated.
C) An increase in the independent variable is associated with a decrease in the dependent variable.
D) An increase in the independent variable is associated with an increase in the dependent variable.
Unlock Deck
Unlock for access to all 57 flashcards in this deck.
Unlock Deck
k this deck
34
In the late 1890s, scientists first noted that the frequency of a cricket's chirps is related to air temperature.For each of 30 crickets, the frequency of chirping (in chirps per minute) and the air temperature (in degrees Fahrenheit) were recorded, and a regression analysis was performed.
Given that Sxx= 14,497.9 and 117.067, what is a 95% confidence interval for the mean air temperature when a cricket is chirping at a frequency of 120 chirps per minute?
A) (66.539, 67.301)
B) (63.818, 68.022)
C) (65.462, 66.379)
D) (62.389, 67.451)
Given that Sxx= 14,497.9 and
117.067, what is a 95% confidence interval for the mean air temperature when a cricket is chirping at a frequency of 120 chirps per minute?A) (66.539, 67.301)
B) (63.818, 68.022)
C) (65.462, 66.379)
D) (62.389, 67.451)
Unlock Deck
Unlock for access to all 57 flashcards in this deck.
Unlock Deck
k this deck
35
In a regression analysis, the residuals represent:
A) the difference between the actual x and y values.
B) the difference between the actual y values and the predicted values.
C) the difference between the actual x values and the predicted values.
D) the change in y per a one-unit change in x.
A) the difference between the actual x and y values.
B) the difference between the actual y values and the predicted values.
C) the difference between the actual x values and the predicted values.
D) the change in y per a one-unit change in x.
Unlock Deck
Unlock for access to all 57 flashcards in this deck.
Unlock Deck
k this deck
36
In simple linear regression, the plot of residuals versus fitted values should:
A) be free of any patterns.
B) appear to be a random scatter of points about 0 on the vertical axis.
C) have approximately the same spread for all fitted values.
D) All of the above.
A) be free of any patterns.
B) appear to be a random scatter of points about 0 on the vertical axis.
C) have approximately the same spread for all fitted values.
D) All of the above.
Unlock Deck
Unlock for access to all 57 flashcards in this deck.
Unlock Deck
k this deck
37
The appropriate pattern for a residual plot is:
A) an overall parabolic shape.
B) a funnel shape with the tapered end at the lower values.
C) a funnel shape with the tapered end at the higher values.
D) a random scatter centered at zero.
A) an overall parabolic shape.
B) a funnel shape with the tapered end at the lower values.
C) a funnel shape with the tapered end at the higher values.
D) a random scatter centered at zero.
Unlock Deck
Unlock for access to all 57 flashcards in this deck.
Unlock Deck
k this deck
38
If the correlation coefficient r is 0.81, what percentage of variation in the dependent variable is explained by a linear regression with the independent variable?
A) 90%
B) 81%
C) 66%
D) 10%
A) 90%
B) 81%
C) 66%
D) 10%
Unlock Deck
Unlock for access to all 57 flashcards in this deck.
Unlock Deck
k this deck
39
In a simple linear regression, if the coefficient of determination is 0.94, then:
A) 94% of the x-values are equal.
B) 98% of the total variation in x can be explained by the regression line.
C) 94% of the total variation in y can be explained by the regression line.
D) 98% of the total variation in y can be explained by the regression line.
A) 94% of the x-values are equal.
B) 98% of the total variation in x can be explained by the regression line.
C) 94% of the total variation in y can be explained by the regression line.
D) 98% of the total variation in y can be explained by the regression line.
Unlock Deck
Unlock for access to all 57 flashcards in this deck.
Unlock Deck
k this deck
40
Suppose , where .This is:
A) a simple linear regression model.
B) a deterministic model.
C) a generalized linear model.
D) a deterministic relationship.
, where .This is:A) a simple linear regression model.
B) a deterministic model.
C) a generalized linear model.
D) a deterministic relationship.
Unlock Deck
Unlock for access to all 57 flashcards in this deck.
Unlock Deck
k this deck
41
Ten used cars from a rental fleet are randomly selected.Each vehicle's annual maintenance cost from the previous calendar year (y) is recorded as well as the vehicle's current mileage (x).A simple linear regression is conducted on the data.
Conduct a test of hypothesis to see if there is sufficient evidence to conclude that used vehicles with 22,500 miles will have a mean annual maintenance cost that exceeds $400.Select the appropriate critical value (CV), test statistic (TS), and decision.(Use α = 0.05).(Given: Sxx= 803,667,7024 and = $43,627.700.)
A) CV = 1.8331; TS = 0.1415; fail to reject H₀
B) CV = 1.8595; TS = 0.02611; fail to reject H₀
C) CV = 1.8331; TS = 0.2986; fail to reject H₀
D) CV = 1.8595; TS = 0.3589; fail to reject H₀
Conduct a test of hypothesis to see if there is sufficient evidence to conclude that used vehicles with 22,500 miles will have a mean annual maintenance cost that exceeds $400.Select the appropriate critical value (CV), test statistic (TS), and decision.(Use α = 0.05).(Given: Sxx= 803,667,7024 and
= $43,627.700.)A) CV = 1.8331; TS = 0.1415; fail to reject H₀
B) CV = 1.8595; TS = 0.02611; fail to reject H₀
C) CV = 1.8331; TS = 0.2986; fail to reject H₀
D) CV = 1.8595; TS = 0.3589; fail to reject H₀
Unlock Deck
Unlock for access to all 57 flashcards in this deck.
Unlock Deck
k this deck
42
A study is designed to evaluate the relationship between a person's height and his or her salary.A random sample of 800 workers at a large corporation is drawn, and each individual's height (x) and salary (y) are recorded.If the coefficient of determination from the sample is 0.126, we can conclude that:
A) 12.6% of the salaries are correlated with height.
B) 12.6% of the variability in the salaries is explained by the model.
C) 0.126% of the variability in the salaries is explained by the model.
D) there is a strong positive linear correlation between salary and height.
A) 12.6% of the salaries are correlated with height.
B) 12.6% of the variability in the salaries is explained by the model.
C) 0.126% of the variability in the salaries is explained by the model.
D) there is a strong positive linear correlation between salary and height.
Unlock Deck
Unlock for access to all 57 flashcards in this deck.
Unlock Deck
k this deck
43
In the linear regression model, the homogeneity of variance assumption basically means:
A) the variance in y at any given x-value is random.
B) the variance in x at any given y-value is constant.
C) the y variance at any given x within the range of the model is constant.
D) the amount of variance in y is smallest when x is the smallest value considered in the model.
A) the variance in y at any given x-value is random.
B) the variance in x at any given y-value is constant.
C) the y variance at any given x within the range of the model is constant.
D) the amount of variance in y is smallest when x is the smallest value considered in the model.
Unlock Deck
Unlock for access to all 57 flashcards in this deck.
Unlock Deck
k this deck
44
The statement that "correlation does not imply causality" indicates that:
A) a strong correlation coefficient does not mean there is a cause-effect relationship between factors.
B) a weak correlation coefficient means there is weak link between factors.
C) there is an excuse to ignore the meaning of a correlation.
D) None of the above.
A) a strong correlation coefficient does not mean there is a cause-effect relationship between factors.
B) a weak correlation coefficient means there is weak link between factors.
C) there is an excuse to ignore the meaning of a correlation.
D) None of the above.
Unlock Deck
Unlock for access to all 57 flashcards in this deck.
Unlock Deck
k this deck
45
Which of the following is NOT an assumption for the simple linear regression model?
A) The error terms are independent of each other.
B) The error terms have equal variances for all values of the independent variable.
C) The distribution of the error terms will be skewed to the left or right depending on the values of the dependent variable.
D) The mean of the dependent variable for all levels of the independent variable can be connected by a straight line.
Unlock Deck
Unlock for access to all 57 flashcards in this deck.
Unlock Deck
k this deck
46
The amount of variability explained by the regression model is:
A) the coefficient of regression.
B) the coefficient of explanation.
C) the coefficient of correlation.
D) the coefficient of determination.
A) the coefficient of regression.
B) the coefficient of explanation.
C) the coefficient of correlation.
D) the coefficient of determination.
Unlock Deck
Unlock for access to all 57 flashcards in this deck.
Unlock Deck
k this deck
47
The least-squares method for determining the best fit minimizes the:
A) total variation in the dependent variable.
B) sum of squares for regression.
C) sum of squares for error.
D) sum of squares for the x-values.
A) total variation in the dependent variable.
B) sum of squares for regression.
C) sum of squares for error.
D) sum of squares for the x-values.
Unlock Deck
Unlock for access to all 57 flashcards in this deck.
Unlock Deck
k this deck
48
An instructor's records show a 0.956 correlation between grades and attendance.If the correlation implies causality, what might this imply?
A) The instructor could get away with giving grades based solely on attendance.
B) Effort should be expended to make sure all students attend all classes.
C) There should be many questions on exams that can be answered only if the student attends class.
D) All the above.
A) The instructor could get away with giving grades based solely on attendance.
B) Effort should be expended to make sure all students attend all classes.
C) There should be many questions on exams that can be answered only if the student attends class.
D) All the above.
Unlock Deck
Unlock for access to all 57 flashcards in this deck.
Unlock Deck
k this deck
49
In a deterministic relationship between two variables x and y of the form it is understood that:
A) completely determines
B) x and y are not related.
C) y is completely determined by x.
D) x and y have similar properties.
it is understood that:A)
completely determines B) x and y are not related.
C) y is completely determined by x.
D) x and y have similar properties.
Unlock Deck
Unlock for access to all 57 flashcards in this deck.
Unlock Deck
k this deck
50
In the following residual plot:
A) the plot appears to be random, so there are no major concerns.
B) the plot clearly shows that the residuals are not normally distributed.
C) there appears to be at least one highly influential observation.
D) the mean of the error distribution appears to differ from zero.
A) the plot appears to be random, so there are no major concerns.
B) the plot clearly shows that the residuals are not normally distributed.
C) there appears to be at least one highly influential observation.
D) the mean of the error distribution appears to differ from zero.
Unlock Deck
Unlock for access to all 57 flashcards in this deck.
Unlock Deck
k this deck
51
The linear regression model assumes the error random variable is:
A) a constant value.
B) normally distributed.
C) centered at some positive value.
D) a latent variable with an unknown distribution.
A) a constant value.
B) normally distributed.
C) centered at some positive value.
D) a latent variable with an unknown distribution.
Unlock Deck
Unlock for access to all 57 flashcards in this deck.
Unlock Deck
k this deck
52
The linear relationship (where and are constants) is an example of:
A) an indeterminate relationship.
B) a linear deterministic relationship.
C) a linear probabilistic relationship.
D) a nonlinear deterministic relationship.
(where and are constants) is an example of:A) an indeterminate relationship.
B) a linear deterministic relationship.
C) a linear probabilistic relationship.
D) a nonlinear deterministic relationship.
Unlock Deck
Unlock for access to all 57 flashcards in this deck.
Unlock Deck
k this deck
53
This histogram shows residuals from a simple linear regression: It appears that:
A) there is a dependence among the errors.
B) the mean of the error distribution is not zero.
C) the error distribution is not normal.
D) the error variance is not constant.
It appears that:A) there is a dependence among the errors.
B) the mean of the error distribution is not zero.
C) the error distribution is not normal.
D) the error variance is not constant.
Unlock Deck
Unlock for access to all 57 flashcards in this deck.
Unlock Deck
k this deck
54
If the sum of squares for error (SSE) is equal to zero, then the coefficient of determination, r2, must be:
A) 1.5.
B) 1.0.
C) 0.5.
D) 0
A) 1.5.
B) 1.0.
C) 0.5.
D) 0
Unlock Deck
Unlock for access to all 57 flashcards in this deck.
Unlock Deck
k this deck
55
The multiple linear regression model assumes:
A) the mean error is zero, error variance is nonconstant, and the errors are independent and normally distributed.
B) the mean error is not zero, error variance is constant, and the errors are independent and normally distributed.
C) the sample size is large (at least 30), and errors are independent and normally distributed.
D) the mean error is zero, error variance is constant, and the errors are independent and normally distributed.
Unlock Deck
Unlock for access to all 57 flashcards in this deck.
Unlock Deck
k this deck
56
Concerning the simple linear regression model, SST can be expressed as:
A) SSA + SSB + SSE.
B) SSR + SSE.
C) SST + SSR.
D) SST + SSR + SSE.
A) SSA + SSB + SSE.
B) SSR + SSE.
C) SST + SSR.
D) SST + SSR + SSE.
Unlock Deck
Unlock for access to all 57 flashcards in this deck.
Unlock Deck
k this deck
57
Given a specific value of x and a confidence level, which of the following statements is correct?
A) The confidence interval estimate of the expected value of y can be calculated, but the prediction interval of y for the given value of x cannot be calculated.
B) The confidence interval estimate of the expected value of y will be narrower than the prediction interval.
C) The prediction interval of y for the given value of x can be calculated, but the confidence interval estimate of the expected value of y cannot be calculated.
D) The confidence interval estimate of the expected value of y will be wider than the prediction interval.
Unlock Deck
Unlock for access to all 57 flashcards in this deck.
Unlock Deck
k this deck
Unlock Deck
Unlock for access to all 57 flashcards in this deck.


