Deck 10: Chi-Square and Analysis of Variance Anova
Full screen (f)
Question
Question
Question
Question
Question
Question

Question
Question
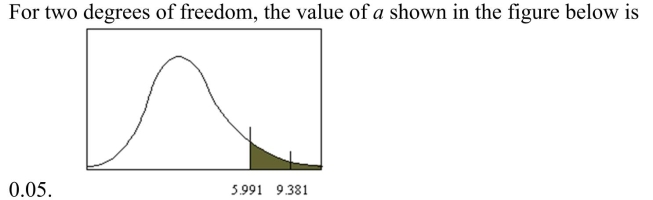
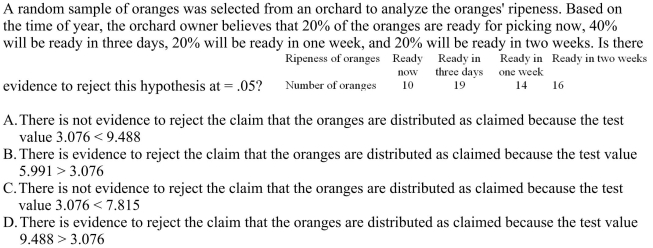
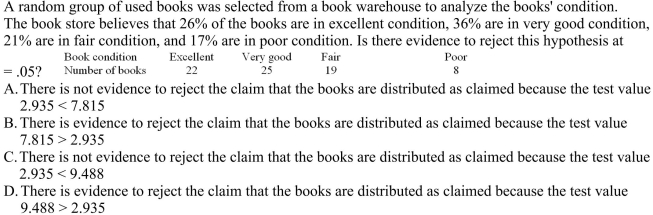
A) 9.236
B) 7.779
C) 11.070
D) 9.488
Question
Question
A contingency table is designated as  (columns times rows) table.
(columns times rows) table. Question
Question
The degrees of freedom for a  contingency table would be 24.
contingency table would be 24. Question
Question
Question
Question
Question
Question
Question
Question
Question

A) 28.31
B) 16.77
C) 26.80
D) 21.50
Question
A) 9.5
B) 4.37
C) 5.72
D) 10.3
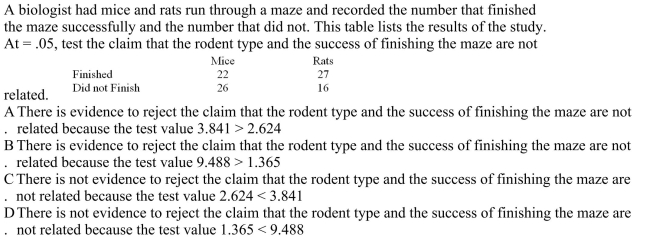
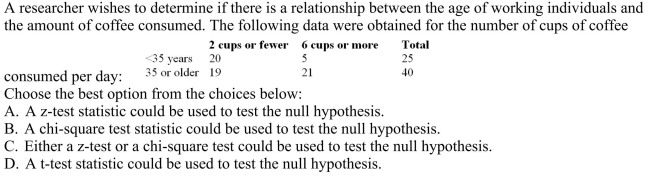
Question
Question
Question
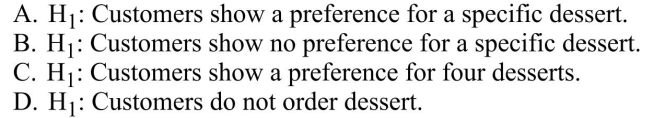
State what the alternative hypothesis would be.
Question
Question
 .
. Question
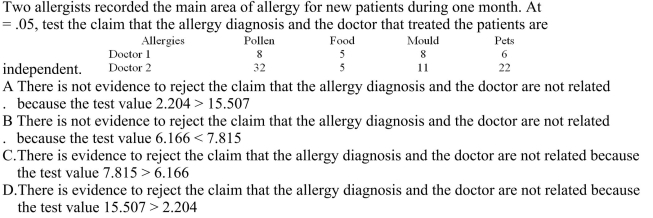
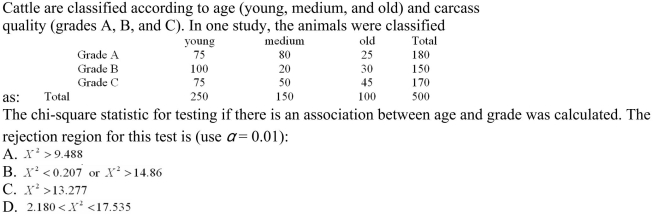
What is the critical value?
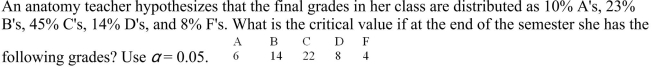
A) 20.090
B) 13.362
C) 14.067
D) 15.507
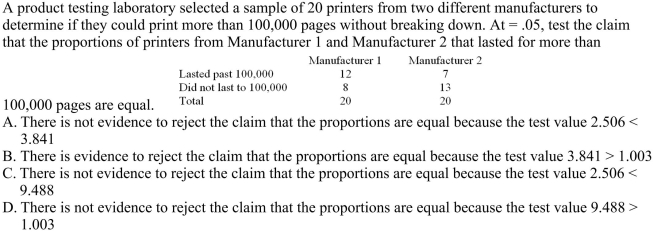
Question
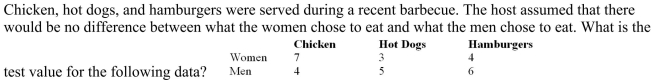
A) 6.18
B) 29.5
C) 11.56
D) 18.0
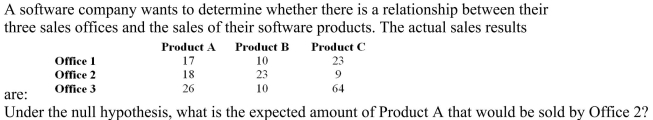
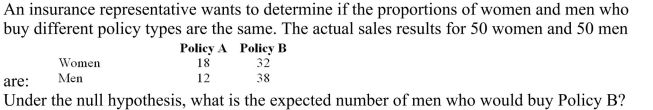
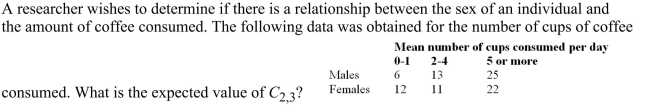
Question
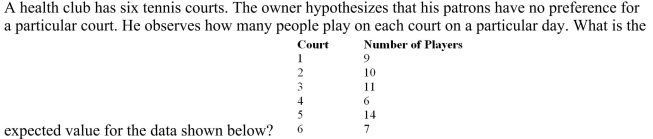
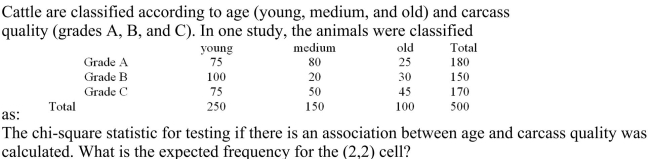
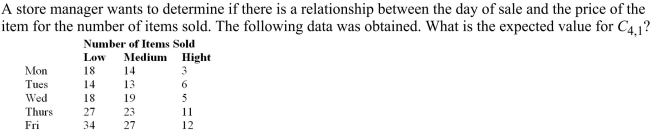
What is the expected value?
A) 38
B) 25
C) 30
D) 28
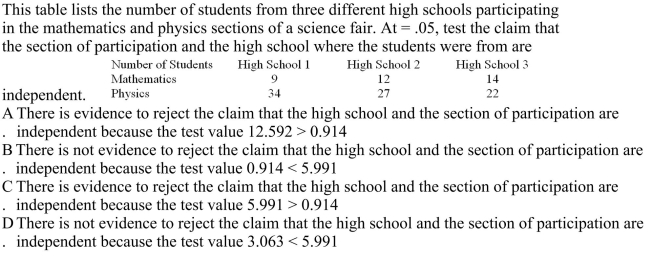
Question
Question
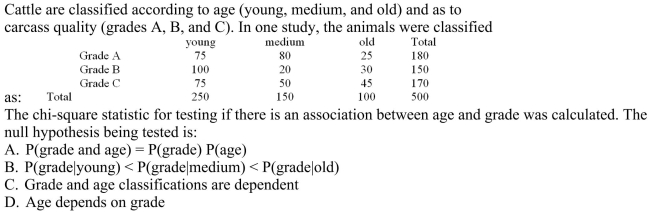
Question
Question
Question
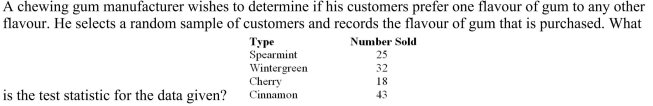
What is the test statistic?
A) 9.14
B) 23.21
C) 17.86
D) 16.36
Question
Question
Question
A four-year university has decided to implement a new approach to teaching statistics. Full-time and
adjunct professors were surveyed to determine whether they preferred the traditional lecture approach or
a computer approach for teaching statistics. Use hypothesis testing to test the independence of opinion
between the two groups.

What is the expected value of an adjunct professor who prefers computer instruction?
A) 21.50
B) 13.50
C) 11.67
D) 9.83
adjunct professors were surveyed to determine whether they preferred the traditional lecture approach or
a computer approach for teaching statistics. Use hypothesis testing to test the independence of opinion
between the two groups.
What is the expected value of an adjunct professor who prefers computer instruction?
A) 21.50
B) 13.50
C) 11.67
D) 9.83
Question
Question
A four-year university has decided to implement a new approach to teaching statistics. Full-time and
adjunct professors were surveyed to determine whether they preferred the traditional lecture approach or
a computer approach for teaching statistics. Use hypothesis testing to test the independence of opinion
between the two groups.
What is the expected value of a full-time professor who has no preference?
A) 13.50
B) 9.83
C) 6.17
D) 7.33
Question
A four-year university has decided to implement a new approach to teaching statistics. Full-time and
adjunct professors were surveyed to determine whether they preferred the traditional lecture approach or
a computer approach for teaching statistics. Use hypothesis testing to test the independence of opinion
between the two groups.
What is the expected value of an adjunct professor who prefers to lecture?
A) 7.33
B) 11.67
C) 21.50
D) 9.83
Question
Question
A) 1.596
B) 4.140
C) 1.686
D) 5.769
Question
Question
Question
A) 12.20
B) 15.25
C) 20.33
D) 30.50
Question
Question
Question
A) 26
B) 45
C) 60
D) 90
Question
A four-year university has decided to implement a new approach to teaching statistics. Full-time and
adjunct professors were surveyed to determine whether they preferred the traditional lecture approach or
a computer approach for teaching statistics. Use hypothesis testing to test the independence of opinion
between the two groups.
What is the test value?
A) 0.36
B) 0.97
C) 0.14
D) 1.24
adjunct professors were surveyed to determine whether they preferred the traditional lecture approach or
a computer approach for teaching statistics. Use hypothesis testing to test the independence of opinion
between the two groups.
What is the test value?
A) 0.36
B) 0.97
C) 0.14
D) 1.24
Question
Question
Question
A) 25
B) 30
C) 35
D) 50
Question
Question
Question
Question
Question
Question
Question
Question
Question
Question
Question
The dean of a local school wants to determine if the grade distribution is independent of
the subject matter taught. How many degrees of freedom does this contingency table have?
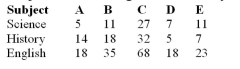
the subject matter taught. How many degrees of freedom does this contingency table have?
Question
Question
Question
The degrees of freedom for a  contingency table are __________.
________________________________________
contingency table are __________. ________________________________________
Question
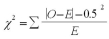 The method that uses the formula is called the __________ correction for
continuity.
Question
Question
Question

Unlock Deck
Sign up to unlock the cards in this deck!
Unlock Deck
Unlock Deck
1/71
Play
Full screen (f)
Deck 10: Chi-Square and Analysis of Variance Anova
1
The chi-square independence test can be used to test the independence of two variables.
True
2
True
3
What is the test value?
A) 2.82
B) 100
C) 72.12
D) 33.78
A) 2.82
B) 100
C) 72.12
D) 33.78
B
4
The chi-square goodness-of-fit test is always one-tailed left.
Unlock Deck
Unlock for access to all 71 flashcards in this deck.
Unlock Deck
k this deck
5
In a goodness-of-fit test, the degrees of freedom are equal to the number of categories minus two.
Unlock Deck
Unlock for access to all 71 flashcards in this deck.
Unlock Deck
k this deck
6
Unlock Deck
Unlock for access to all 71 flashcards in this deck.
Unlock Deck
k this deck
7
The computational procedure for homogeneity of proportions differs from that of the test of independence
in that it takes into account the standard deviation.
in that it takes into account the standard deviation.
Unlock Deck
Unlock for access to all 71 flashcards in this deck.
Unlock Deck
k this deck
8
A) 9.236
B) 7.779
C) 11.070
D) 9.488
Unlock Deck
Unlock for access to all 71 flashcards in this deck.
Unlock Deck
k this deck
9
What is the critical value?
A) 18.475
B) 16.812
C) 12.592
D) 14.067
A) 18.475
B) 16.812
C) 12.592
D) 14.067
Unlock Deck
Unlock for access to all 71 flashcards in this deck.
Unlock Deck
k this deck
10
A contingency table is designated as (columns times rows) table.
(columns times rows) table. Unlock Deck
Unlock for access to all 71 flashcards in this deck.
Unlock Deck
k this deck
11
Frequencies obtained by calculation are called expected frequencies.
Unlock Deck
Unlock for access to all 71 flashcards in this deck.
Unlock Deck
k this deck
12
The degrees of freedom for a contingency table would be 24.
contingency table would be 24. Unlock Deck
Unlock for access to all 71 flashcards in this deck.
Unlock Deck
k this deck
13
In a chi-square goodness-of-fit test, when there is close agreement between the observed frequency and
the expected frequency, the chi-square test value will be small.
the expected frequency, the chi-square test value will be small.
Unlock Deck
Unlock for access to all 71 flashcards in this deck.
Unlock Deck
k this deck
14
What is the expected value?
A) 112
B) 247
C) 120
D) 171
A) 112
B) 247
C) 120
D) 171
Unlock Deck
Unlock for access to all 71 flashcards in this deck.
Unlock Deck
k this deck
15
What is the null hypothesis?
A) Children spend the same amount of time watching TV each day.
B) Children spend different amounts of time watching TV each day.
C) Children spend more time watching TV on weekends.
D) Children spend less than 2.6 hours a day watching TV.
A) Children spend the same amount of time watching TV each day.
B) Children spend different amounts of time watching TV each day.
C) Children spend more time watching TV on weekends.
D) Children spend less than 2.6 hours a day watching TV.
Unlock Deck
Unlock for access to all 71 flashcards in this deck.
Unlock Deck
k this deck
16
Before computing the test value, one must state the hypothesis.
Unlock Deck
Unlock for access to all 71 flashcards in this deck.
Unlock Deck
k this deck
17
The test of independence of variables is used to determine whether two variables are independent of or
related to each other when a single sample is selected.
related to each other when a single sample is selected.
Unlock Deck
Unlock for access to all 71 flashcards in this deck.
Unlock Deck
k this deck
18
A manager of a health club believes that 32% of the members joined his club in the winter, 24% joined in
the spring, 20% joined in the summer, and 24% joined in the fall. The number of memberships this year
shows that 110 joined in the winter, 70 joined in the spring, 60 in the summer, and 68 in the fall. The test value for this scenario would be 2.05.
the spring, 20% joined in the summer, and 24% joined in the fall. The number of memberships this year
shows that 110 joined in the winter, 70 joined in the spring, 60 in the summer, and 68 in the fall. The test value for this scenario would be 2.05.
Unlock Deck
Unlock for access to all 71 flashcards in this deck.
Unlock Deck
k this deck
19
Unlock Deck
Unlock for access to all 71 flashcards in this deck.
Unlock Deck
k this deck
20
The test of homogeneity of proportions is used to determine whether the proportions for a variable are
unequal when several samples are selected from different populations.
unequal when several samples are selected from different populations.
Unlock Deck
Unlock for access to all 71 flashcards in this deck.
Unlock Deck
k this deck
21
A) 28.31
B) 16.77
C) 26.80
D) 21.50
Unlock Deck
Unlock for access to all 71 flashcards in this deck.
Unlock Deck
k this deck
22
A) 9.5
B) 4.37
C) 5.72
D) 10.3
Unlock Deck
Unlock for access to all 71 flashcards in this deck.
Unlock Deck
k this deck
23
Unlock Deck
Unlock for access to all 71 flashcards in this deck.
Unlock Deck
k this deck
24
Unlock Deck
Unlock for access to all 71 flashcards in this deck.
Unlock Deck
k this deck
25
State what the alternative hypothesis would be.
Unlock Deck
Unlock for access to all 71 flashcards in this deck.
Unlock Deck
k this deck
26
Unlock Deck
Unlock for access to all 71 flashcards in this deck.
Unlock Deck
k this deck
27
. Unlock Deck
Unlock for access to all 71 flashcards in this deck.
Unlock Deck
k this deck
28
What is the critical value?
A) 20.090
B) 13.362
C) 14.067
D) 15.507
Unlock Deck
Unlock for access to all 71 flashcards in this deck.
Unlock Deck
k this deck
29
A) 6.18
B) 29.5
C) 11.56
D) 18.0
Unlock Deck
Unlock for access to all 71 flashcards in this deck.
Unlock Deck
k this deck
30
What is the expected value?
A) 38
B) 25
C) 30
D) 28
Unlock Deck
Unlock for access to all 71 flashcards in this deck.
Unlock Deck
k this deck
31
A contingency table has 5 rows and 4 columns. What are the degrees of freedom?
A) 20
B) 12
C) 16
D) 15
A) 20
B) 12
C) 16
D) 15
Unlock Deck
Unlock for access to all 71 flashcards in this deck.
Unlock Deck
k this deck
32
Unlock Deck
Unlock for access to all 71 flashcards in this deck.
Unlock Deck
k this deck
33
Unlock Deck
Unlock for access to all 71 flashcards in this deck.
Unlock Deck
k this deck
34
Unlock Deck
Unlock for access to all 71 flashcards in this deck.
Unlock Deck
k this deck
35
What is the test statistic?
A) 9.14
B) 23.21
C) 17.86
D) 16.36
Unlock Deck
Unlock for access to all 71 flashcards in this deck.
Unlock Deck
k this deck
36
Unlock Deck
Unlock for access to all 71 flashcards in this deck.
Unlock Deck
k this deck
37
Given that a contingency table has dimensions of 5 × 5, what is the critical value of chi-square at α = 0.05?
A) 37.652
B) 26.296
C) 31.410
D) 36.415
A) 37.652
B) 26.296
C) 31.410
D) 36.415
Unlock Deck
Unlock for access to all 71 flashcards in this deck.
Unlock Deck
k this deck
38
A four-year university has decided to implement a new approach to teaching statistics. Full-time and
adjunct professors were surveyed to determine whether they preferred the traditional lecture approach or
a computer approach for teaching statistics. Use hypothesis testing to test the independence of opinion
between the two groups.
What is the expected value of an adjunct professor who prefers computer instruction?
A) 21.50
B) 13.50
C) 11.67
D) 9.83
Unlock Deck
Unlock for access to all 71 flashcards in this deck.
Unlock Deck
k this deck
39
A contingency table is made up of 8 rows and 4 columns. How many degrees of freedom are present?
A) 32
B) 28
C) 24
D) 21
A) 32
B) 28
C) 24
D) 21
Unlock Deck
Unlock for access to all 71 flashcards in this deck.
Unlock Deck
k this deck
40
A four-year university has decided to implement a new approach to teaching statistics. Full-time and
adjunct professors were surveyed to determine whether they preferred the traditional lecture approach or
a computer approach for teaching statistics. Use hypothesis testing to test the independence of opinion
between the two groups.
What is the expected value of a full-time professor who has no preference?
A) 13.50
B) 9.83
C) 6.17
D) 7.33
Unlock Deck
Unlock for access to all 71 flashcards in this deck.
Unlock Deck
k this deck
41
A four-year university has decided to implement a new approach to teaching statistics. Full-time and
adjunct professors were surveyed to determine whether they preferred the traditional lecture approach or
a computer approach for teaching statistics. Use hypothesis testing to test the independence of opinion
between the two groups.
What is the expected value of an adjunct professor who prefers to lecture?
A) 7.33
B) 11.67
C) 21.50
D) 9.83
Unlock Deck
Unlock for access to all 71 flashcards in this deck.
Unlock Deck
k this deck
42
Unlock Deck
Unlock for access to all 71 flashcards in this deck.
Unlock Deck
k this deck
43
A) 1.596
B) 4.140
C) 1.686
D) 5.769
Unlock Deck
Unlock for access to all 71 flashcards in this deck.
Unlock Deck
k this deck
44
Unlock Deck
Unlock for access to all 71 flashcards in this deck.
Unlock Deck
k this deck
45
Unlock Deck
Unlock for access to all 71 flashcards in this deck.
Unlock Deck
k this deck
46
A) 12.20
B) 15.25
C) 20.33
D) 30.50
Unlock Deck
Unlock for access to all 71 flashcards in this deck.
Unlock Deck
k this deck
47
An assumption for the goodness-of-fit test is that the __________ frequency for each category must be
five or more.
________________________________________
five or more.
________________________________________
Unlock Deck
Unlock for access to all 71 flashcards in this deck.
Unlock Deck
k this deck
48
Unlock Deck
Unlock for access to all 71 flashcards in this deck.
Unlock Deck
k this deck
49
A) 26
B) 45
C) 60
D) 90
Unlock Deck
Unlock for access to all 71 flashcards in this deck.
Unlock Deck
k this deck
50
A four-year university has decided to implement a new approach to teaching statistics. Full-time and
adjunct professors were surveyed to determine whether they preferred the traditional lecture approach or
a computer approach for teaching statistics. Use hypothesis testing to test the independence of opinion
between the two groups.
What is the test value?
A) 0.36
B) 0.97
C) 0.14
D) 1.24
adjunct professors were surveyed to determine whether they preferred the traditional lecture approach or
a computer approach for teaching statistics. Use hypothesis testing to test the independence of opinion
between the two groups.
What is the test value?
A) 0.36
B) 0.97
C) 0.14
D) 1.24
Unlock Deck
Unlock for access to all 71 flashcards in this deck.
Unlock Deck
k this deck
51
Unlock Deck
Unlock for access to all 71 flashcards in this deck.
Unlock Deck
k this deck
52
Unlock Deck
Unlock for access to all 71 flashcards in this deck.
Unlock Deck
k this deck
53
A) 25
B) 30
C) 35
D) 50
Unlock Deck
Unlock for access to all 71 flashcards in this deck.
Unlock Deck
k this deck
54
Unlock Deck
Unlock for access to all 71 flashcards in this deck.
Unlock Deck
k this deck
55
Unlock Deck
Unlock for access to all 71 flashcards in this deck.
Unlock Deck
k this deck
56
Unlock Deck
Unlock for access to all 71 flashcards in this deck.
Unlock Deck
k this deck
57
Unlock Deck
Unlock for access to all 71 flashcards in this deck.
Unlock Deck
k this deck
58
Unlock Deck
Unlock for access to all 71 flashcards in this deck.
Unlock Deck
k this deck
59
Unlock Deck
Unlock for access to all 71 flashcards in this deck.
Unlock Deck
k this deck
60
Unlock Deck
Unlock for access to all 71 flashcards in this deck.
Unlock Deck
k this deck
61
If the null hypothesis is not rejected, it can be assumed the proportions are __________ and the
differences in them are due to chance.
________________________________________
differences in them are due to chance.
________________________________________
Unlock Deck
Unlock for access to all 71 flashcards in this deck.
Unlock Deck
k this deck
62
Unlock Deck
Unlock for access to all 71 flashcards in this deck.
Unlock Deck
k this deck
63
The chi-square distribution is continuous, whereas the goodness-of-fit test is __________.
________________________________________
________________________________________
Unlock Deck
Unlock for access to all 71 flashcards in this deck.
Unlock Deck
k this deck
64
The dean of a local school wants to determine if the grade distribution is independent of
the subject matter taught. How many degrees of freedom does this contingency table have?
the subject matter taught. How many degrees of freedom does this contingency table have?
Unlock Deck
Unlock for access to all 71 flashcards in this deck.
Unlock Deck
k this deck
65
The two types of test that use a contingency table are the independence test and the __________ test.
Unlock Deck
Unlock for access to all 71 flashcards in this deck.
Unlock Deck
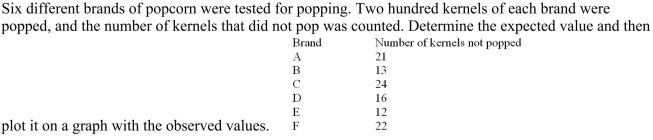
k this deck
66
A research firm reported that 15% of those surveyed described their health as poor, 26% as good, 40% as
very good, and 19% as excellent. A health professional in Halifax wants to determine if people in Halifax
have similar feelings toward their health. In a sample of 610 people in Halifax, 70 described their health
as poor, 180 as good, 220 as very good, and 140 as excellent. Plot the observed and expected values and
calculate the test value.
Unlock Deck
Unlock for access to all 71 flashcards in this deck.
Unlock Deck
k this deck
67
The degrees of freedom for a contingency table are __________.
________________________________________
contingency table are __________. ________________________________________
Unlock Deck
Unlock for access to all 71 flashcards in this deck.
Unlock Deck
k this deck
68
The method that uses the formula is called the __________ correction forcontinuity.
Unlock Deck
Unlock for access to all 71 flashcards in this deck.
Unlock Deck
k this deck
69
When data are arranged in table form for the chi-square independence test, it is called a __________
table.
________________________________________
table.
________________________________________
Unlock Deck
Unlock for access to all 71 flashcards in this deck.
Unlock Deck
k this deck
70
Unlock Deck
Unlock for access to all 71 flashcards in this deck.
Unlock Deck
k this deck
71
Unlock Deck
Unlock for access to all 71 flashcards in this deck.
Unlock Deck
k this deck
Unlock Deck
Unlock for access to all 71 flashcards in this deck.


